Netherlands Tin Market (2026-2032) | Industry, Share, Revenue, Companies, Size, Value, Outlook, Segmentation, Forecast, Trends, Analysis & Growth
Market Forecast By Product Type (Metal, Alloy, Compounds), By Application (Solder, Tin Plating, Chemicals, Other), By End-user Industry (Automotive, Electronics, Packaging (Food and Beverage), Glass, Other) And Competitive Landscape
| Product Code: ETC4861094 | Publication Date: Nov 2023 | Updated Date: Apr 2026 | Product Type: Market Research Report | |
| Publisher: 6Wresearch | Author: Shubham Padhi | No. of Pages: 60 | No. of Figures: 30 | No. of Tables: 5 |
Netherlands Tin Market Size (2020-2030)
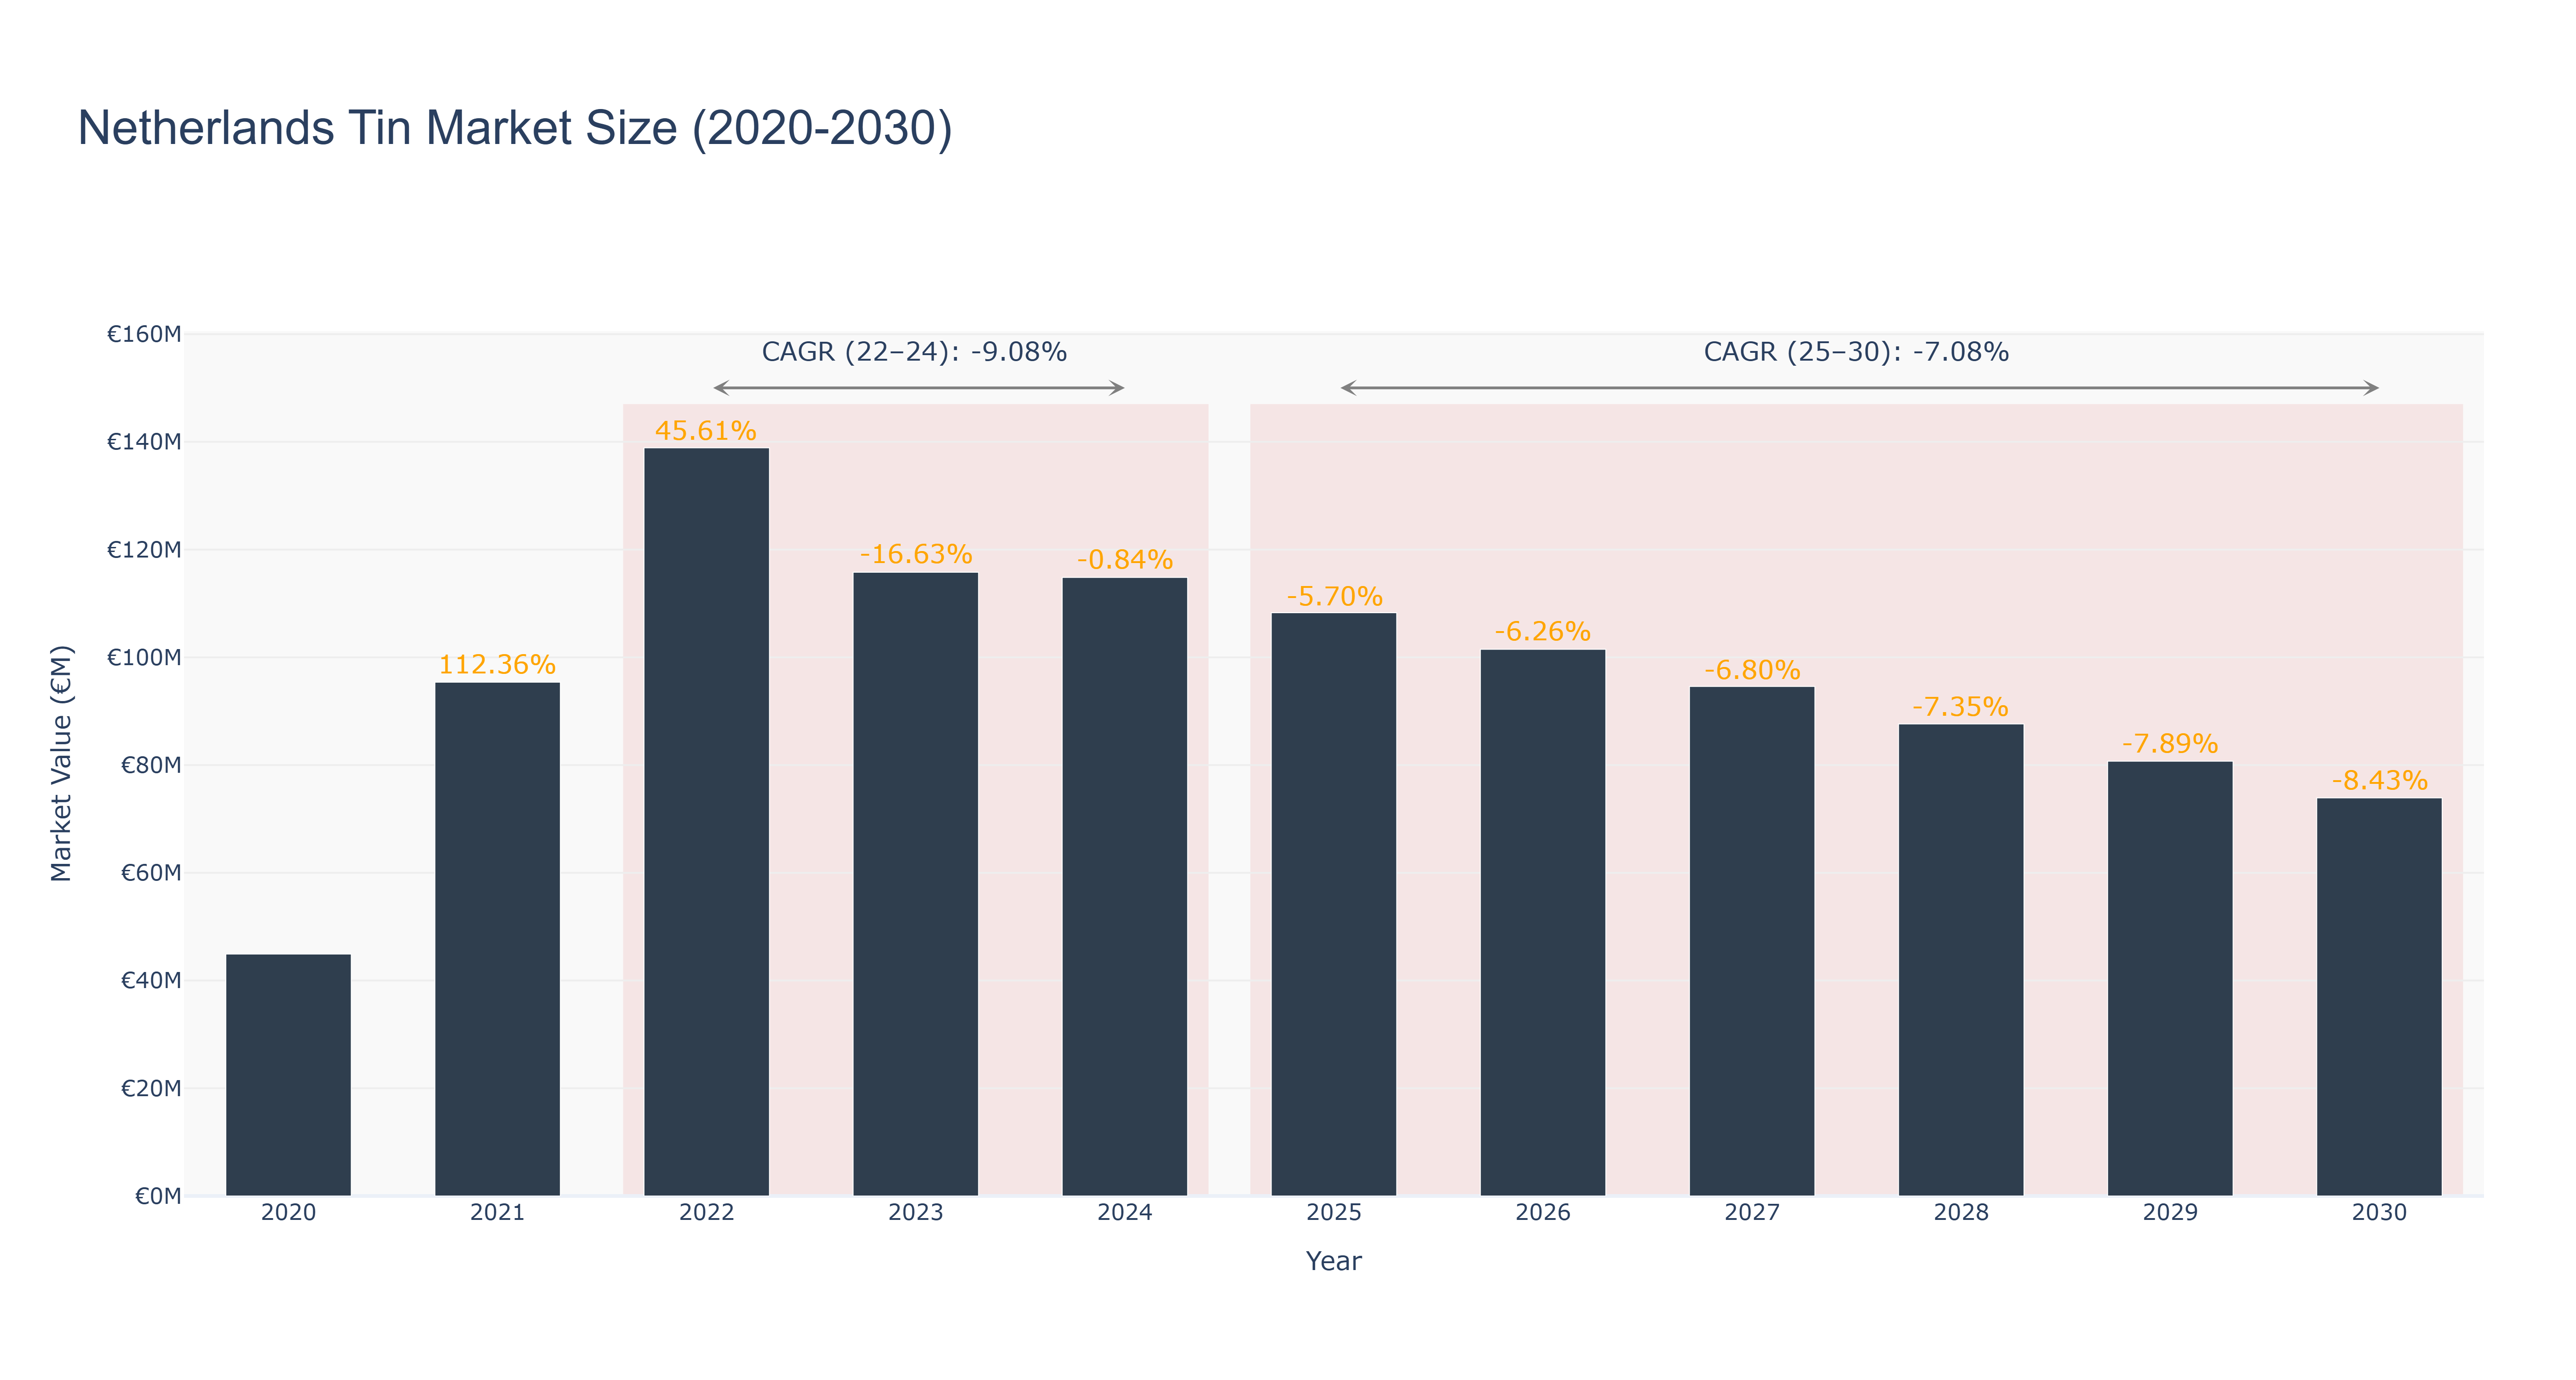
Netherlands Tin Market has shown a fluctuating trend over the years. The peak market size of €138.90 million was observed in 2022, followed by a decline to €73.92 million in 2030. Actual market size decreased from €44.92 million in 2020 to €114.83 million in 2024. The forecasted market size is expected to continue declining from 2025 to 2030. The CAGR for the period 2022-24 was -9.08%, while for 2025-30, it is projected at -7.08%. The market's downward trajectory can be attributed to global economic slowdowns and shifts in consumer preferences towards alternative materials. Looking ahead, the Netherlands Tin Market is set to witness advancements in sustainable tin mining practices to address environmental concerns and meet regulatory standards, ensuring long-term viability in the market.
Netherlands Tin Market: Production & Trade Performance (2019-2025)
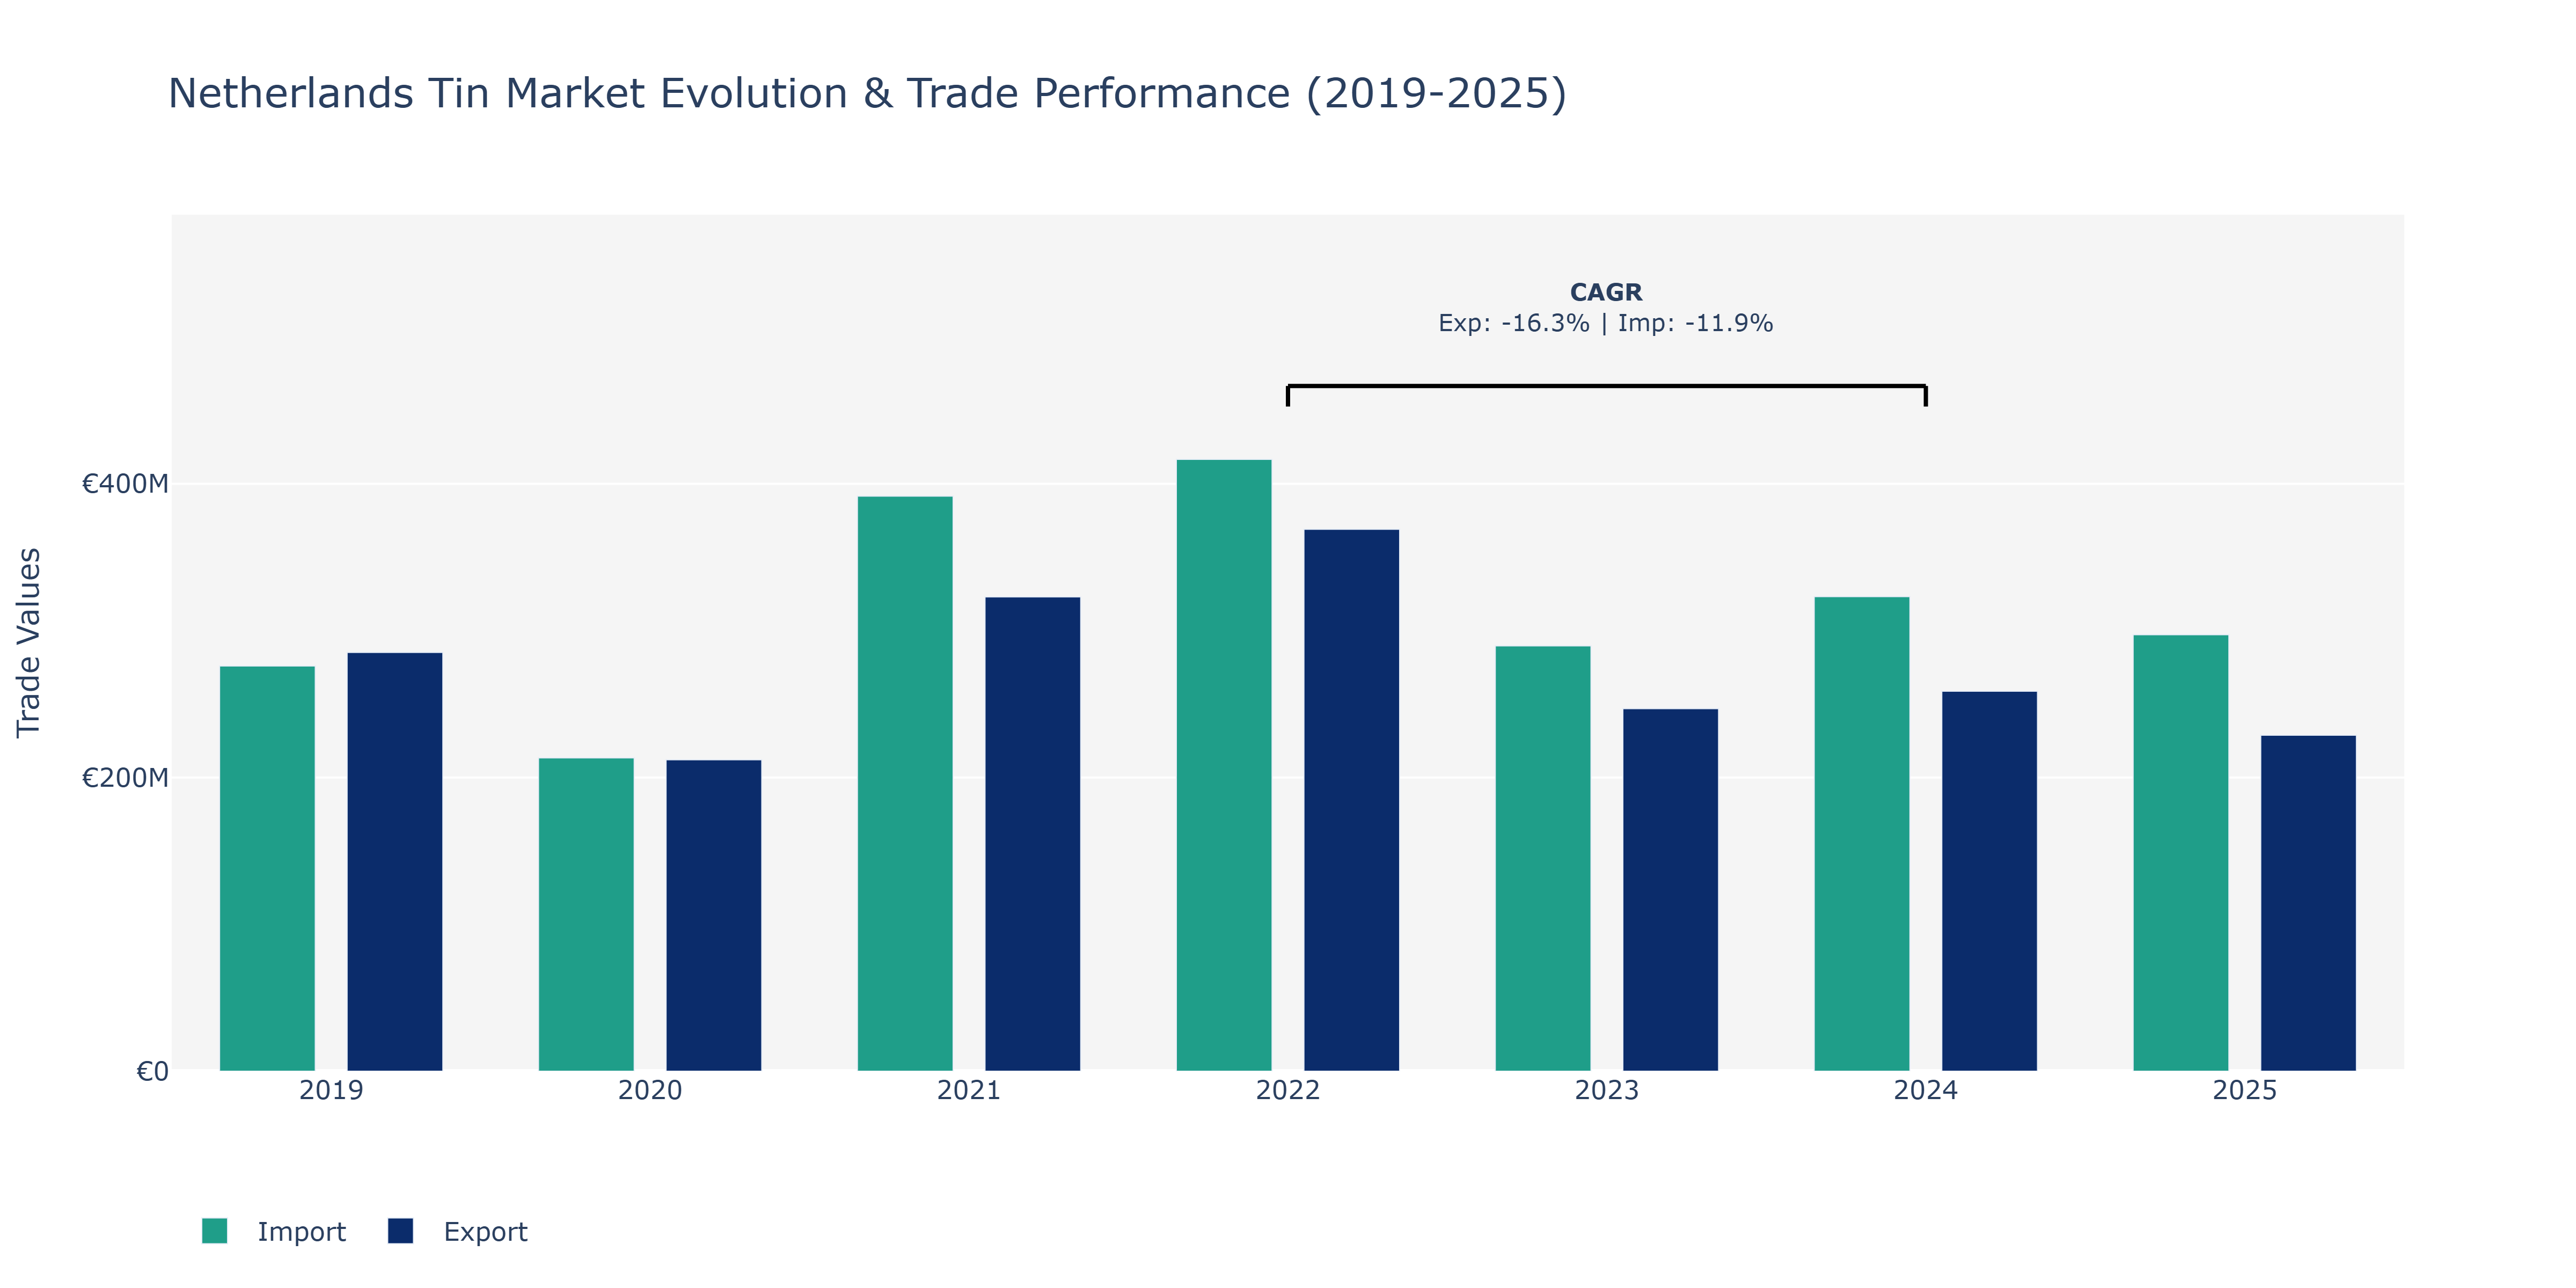
In the Netherlands Tin Market, exports experienced fluctuations over the analyzed period. Starting at €285.18 million in 2019, there was a notable decline in 2020 to €212.09 million before a significant recovery in 2021 to €322.97 million. The peak point was reached in 2022 at €368.97 million, followed by a decrease in the following years. On the other hand, imports showed a more consistent trend, with a steady increase from €275.91 million in 2019 to €391.53 million in 2021, reaching a peak in 2022 at €416.60 million. However, imports declined in the later years but remained above the initial value. These fluctuations can be attributed to various factors such as global demand shifts, economic conditions impacting trade, and changes in production capacities. The decrease in exports from 2022 to 2024 could be influenced by global market conditions affecting demand for tin products, while the varying import values may reflect changes in domestic consumption patterns or sourcing strategies within the Netherlands Tin Market.
Key Highlights of the Report:
- Netherlands Tin Market Outlook
- Market Size of Netherlands Tin Market, 2025
- Forecast of Netherlands Tin Market, 2032
- Historical Data and Forecast of Netherlands Tin Revenues & Volume for the Period 2022 - 2032F
- Netherlands Tin Market Trend Evolution
- Netherlands Tin Market Drivers and Challenges
- Netherlands Tin Price Trends
- Netherlands Tin Porter`s Five Forces
- Netherlands Tin Industry Life Cycle
- Historical Data and Forecast of Netherlands Tin Market Revenues & Volume By Product Type for the Period 2022 - 2032F
- Historical Data and Forecast of Netherlands Tin Market Revenues & Volume By Metal for the Period 2022 - 2032F
- Historical Data and Forecast of Netherlands Tin Market Revenues & Volume By Alloy for the Period 2022 - 2032F
- Historical Data and Forecast of Netherlands Tin Market Revenues & Volume By Compounds for the Period 2022 - 2032F
- Historical Data and Forecast of Netherlands Tin Market Revenues & Volume By Application for the Period 2022 - 2032F
- Historical Data and Forecast of Netherlands Tin Market Revenues & Volume By Solder for the Period 2022 - 2032F
- Historical Data and Forecast of Netherlands Tin Market Revenues & Volume By Tin Plating for the Period 2022 - 2032F
- Historical Data and Forecast of Netherlands Tin Market Revenues & Volume By Chemicals for the Period 2022 - 2032F
- Historical Data and Forecast of Netherlands Tin Market Revenues & Volume By Other for the Period 2022 - 2032F
- Historical Data and Forecast of Netherlands Tin Market Revenues & Volume By End-user Industry for the Period 2022 - 2032F
- Historical Data and Forecast of Netherlands Tin Market Revenues & Volume By Automotive for the Period 2022 - 2032F
- Historical Data and Forecast of Netherlands Tin Market Revenues & Volume By Electronics for the Period 2022 - 2032F
- Historical Data and Forecast of Netherlands Tin Market Revenues & Volume By Packaging (Food and Beverage) for the Period 2022 - 2032F
- Historical Data and Forecast of Netherlands Tin Market Revenues & Volume By Glass for the Period 2022 - 2032F
- Historical Data and Forecast of Netherlands Tin Market Revenues & Volume By Other for the Period 2022 - 2032F
- Netherlands Tin Import Export Trade Statistics
- Market Opportunity Assessment By Product Type
- Market Opportunity Assessment By Application
- Market Opportunity Assessment By End-user Industry
- Netherlands Tin Top Companies Market Share
- Netherlands Tin Competitive Benchmarking By Technical and Operational Parameters
- Netherlands Tin Company Profiles
- Netherlands Tin Key Strategic Recommendations
Frequently Asked Questions About the Market Study (FAQs):
6Wresearch actively monitors the Netherlands Tin Market and publishes its comprehensive annual report, highlighting emerging trends, growth drivers, revenue analysis, and forecast outlook. Our insights help businesses to make data-backed strategic decisions with ongoing market dynamics. Our analysts track relevent industries related to the Netherlands Tin Market, allowing our clients with actionable intelligence and reliable forecasts tailored to emerging regional needs.
Yes, we provide customisation as per your requirements. To learn more, feel free to contact us on sales@6wresearch.com
1 Executive Summary |
2 Introduction |
2.1 Key Highlights of the Report |
2.2 Report Description |
2.3 Market Scope & Segmentation |
2.4 Research Methodology |
2.5 Assumptions |
3 Netherlands Tin Market Overview |
3.1 Netherlands Country Macro Economic Indicators |
3.2 Netherlands Tin Market Revenues & Volume, 2022 & 2032F |
3.3 Netherlands Tin Market - Industry Life Cycle |
3.4 Netherlands Tin Market - Porter's Five Forces |
3.5 Netherlands Tin Market Revenues & Volume Share, By Product Type, 2022 & 2032F |
3.6 Netherlands Tin Market Revenues & Volume Share, By Application, 2022 & 2032F |
3.7 Netherlands Tin Market Revenues & Volume Share, By End-user Industry, 2022 & 2032F |
4 Netherlands Tin Market Dynamics |
4.1 Impact Analysis |
4.2 Market Drivers |
4.2.1 Increasing demand for tin in electronics manufacturing due to the growth of the technology industry in the Netherlands |
4.2.2 Favorable government regulations supporting the use of tin for sustainable and eco-friendly practices |
4.2.3 Growing awareness among consumers about the benefits of using tin products over other materials |
4.3 Market Restraints |
4.3.1 Fluctuating prices of tin in the global market impacting the cost of production and profitability for businesses in the Netherlands |
4.3.2 Competition from alternative materials like aluminum and steel affecting the market share of tin products |
4.3.3 Supply chain disruptions or geopolitical factors leading to uncertainties in the availability of tin resources |
5 Netherlands Tin Market Trends |
6 Netherlands Tin Market Segmentations |
6.1 Netherlands Tin Market, By Product Type |
6.1.1 Overview and Analysis |
6.1.2 Netherlands Tin Market Revenues & Volume, By Metal, 2022 - 2032F |
6.1.3 Netherlands Tin Market Revenues & Volume, By Alloy, 2022 - 2032F |
6.1.4 Netherlands Tin Market Revenues & Volume, By Compounds, 2022 - 2032F |
6.2 Netherlands Tin Market, By Application |
6.2.1 Overview and Analysis |
6.2.2 Netherlands Tin Market Revenues & Volume, By Solder, 2022 - 2032F |
6.2.3 Netherlands Tin Market Revenues & Volume, By Tin Plating, 2022 - 2032F |
6.2.4 Netherlands Tin Market Revenues & Volume, By Chemicals, 2022 - 2032F |
6.2.5 Netherlands Tin Market Revenues & Volume, By Other, 2022 - 2032F |
6.3 Netherlands Tin Market, By End-user Industry |
6.3.1 Overview and Analysis |
6.3.2 Netherlands Tin Market Revenues & Volume, By Automotive, 2022 - 2032F |
6.3.3 Netherlands Tin Market Revenues & Volume, By Electronics, 2022 - 2032F |
6.3.4 Netherlands Tin Market Revenues & Volume, By Packaging (Food and Beverage), 2022 - 2032F |
6.3.5 Netherlands Tin Market Revenues & Volume, By Glass, 2022 - 2032F |
6.3.6 Netherlands Tin Market Revenues & Volume, By Other, 2022 - 2032F |
7 Netherlands Tin Market Import-Export Trade Statistics |
7.1 Netherlands Tin Market Export to Major Countries |
7.2 Netherlands Tin Market Imports from Major Countries |
8 Netherlands Tin Market Key Performance Indicators |
8.1 Percentage of tin recycling rate in the Netherlands |
8.2 Number of new product launches incorporating tin in different industries |
8.3 Average time taken to procure tin resources for manufacturing processes |
9 Netherlands Tin Market - Opportunity Assessment |
9.1 Netherlands Tin Market Opportunity Assessment, By Product Type, 2022 & 2032F |
9.2 Netherlands Tin Market Opportunity Assessment, By Application, 2022 & 2032F |
9.3 Netherlands Tin Market Opportunity Assessment, By End-user Industry, 2022 & 2032F |
10 Netherlands Tin Market - Competitive Landscape |
10.1 Netherlands Tin Market Revenue Share, By Companies, 2025 |
10.2 Netherlands Tin Market Competitive Benchmarking, By Operating and Technical Parameters |
11 Company Profiles |
12 Recommendations | 13 Disclaimer |
Export potential assessment - trade Analytics for 2030
Export potential enables firms to identify high-growth global markets with greater confidence by combining advanced trade intelligence with a structured quantitative methodology. The framework analyzes emerging demand trends and country-level import patterns while integrating macroeconomic and trade datasets such as GDP and population forecasts, bilateral import–export flows, tariff structures, elasticity differentials between developed and developing economies, geographic distance, and import demand projections. Using weighted trade values from 2020–2024 as the base period to project country-to-country export potential for 2030, these inputs are operationalized through calculated drivers such as gravity model parameters, tariff impact factors, and projected GDP per-capita growth. Through an analysis of hidden potentials, demand hotspots, and market conditions that are most favorable to success, this method enables firms to focus on target countries, maximize returns, and global expansion with data, backed by accuracy.
By factoring in the projected importer demand gap that is currently unmet and could be potential opportunity, it identifies the potential for the Exporter (Country) among 190 countries, against the general trade analysis, which identifies the biggest importer or exporter.
To discover high-growth global markets and optimize your business strategy:
Click Here
Pricing
- Single User License$ 1,995
- Department License$ 2,400
- Site License$ 3,120
- Global License$ 3,795

Search
Thought Leadership and Analyst Meet


Our Clients
Latest Reports
- Philippines Polyhydroxybutyrate-co-Hydroxyvalerate Market (2026-2032) | Trends, Insights, Challenges, Restraints, Competition, Size, Value, Forecast, Pricing, Share, Outlook, Revenue, Investment Opportunities, Strategy, Drivers, Demand, Growth, segmentation, Analysis, Companies
- Peru Polyhydroxybutyrate-co-Hydroxyvalerate Market (2026-2032) | Growth, Demand, Challenges, Share, Trends, Analysis, Pricing, Investment Opportunities, Drivers, Value, Forecast, Competition, Size, Companies, Insights, Outlook, Restraints, segmentation, Revenue, Strategy
- Pakistan Polyhydroxybutyrate-co-Hydroxyvalerate Market (2026-2032) | Restraints, segmentation, Pricing, Forecast, Share, Strategy, Competition, Trends, Insights, Drivers, Challenges, Growth, Revenue, Outlook, Value, Investment Opportunities, Companies, Size, Analysis, Demand
- Oman Polyhydroxybutyrate-co-Hydroxyvalerate Market (2026-2032) | Drivers, segmentation, Insights, Competition, Pricing, Outlook, Size, Revenue, Challenges, Forecast, Analysis, Growth, Value, Share, Trends, Investment Opportunities, Strategy, Restraints, Companies, Demand
- Nigeria Polyhydroxybutyrate-co-Hydroxyvalerate Market (2026-2032) | Value, Investment Opportunities, Analysis, Revenue, Restraints, Pricing, Outlook, Competition, Demand, Growth, Forecast, Companies, Trends, Challenges, segmentation, Drivers, Insights, Share, Size, Strategy
- Nepal Polyhydroxybutyrate-co-Hydroxyvalerate Market (2026-2032) | Insights, Analysis, Drivers, Share, Revenue, Demand, segmentation, Investment Opportunities, Competition, Forecast, Growth, Pricing, Companies, Strategy, Trends, Restraints, Challenges, Outlook, Size, Value
- Myanmar Polyhydroxybutyrate-co-Hydroxyvalerate Market (2026-2032) | Outlook, Revenue, Strategy, Restraints, Drivers, segmentation, Share, Forecast, Competition, Insights, Growth, Pricing, Size, Demand, Value, Companies, Trends, Challenges, Investment Opportunities, Analysis
- Morocco Polyhydroxybutyrate-co-Hydroxyvalerate Market (2026-2032) | Outlook, Investment Opportunities, Restraints, Strategy, Forecast, Challenges, Drivers, Growth, Companies, segmentation, Trends, Size, Competition, Revenue, Demand, Insights, Share, Analysis, Value, Pricing
- Mexico Polyhydroxybutyrate-co-Hydroxyvalerate Market (2026-2032) | Size, Drivers, Outlook, Share, Strategy, Growth, Pricing, Challenges, Companies, Demand, Value, Investment Opportunities, Restraints, Trends, Forecast, segmentation, Analysis, Insights, Competition, Revenue
- Malaysia Polyhydroxybutyrate-co-Hydroxyvalerate Market (2026-2032) | Share, segmentation, Size, Companies, Analysis, Insights, Forecast, Value, Revenue, Drivers, Restraints, Challenges, Investment Opportunities, Trends, Competition, Strategy, Demand, Growth, Outlook, Pricing
Industry Events and Analyst Meet

HIMTEX 2026

India Refining Summit 2026

India EV Show 2026

EV tech India Expo 2026

Auto Tech Asia 2026
Whitepaper
- Middle East & Africa Commercial Security Market Click here to view more.
- Middle East & Africa Fire Safety Systems & Equipment Market Click here to view more.
- GCC Drone Market Click here to view more.
- Middle East Lighting Fixture Market Click here to view more.
- GCC Physical & Perimeter Security Market Click here to view more.
6WResearch In News
- Doha a strategic location for EV manufacturing hub: IPA Qatar
- Demand for luxury TVs surging in the GCC, says Samsung
- Empowering Growth: The Thriving Journey of Bangladesh’s Cable Industry
- Demand for luxury TVs surging in the GCC, says Samsung
- Video call with a traditional healer? Once unthinkable, it’s now common in South Africa
- Intelligent Buildings To Smooth GCC’s Path To Net Zero