Netherlands Winch Market (2025-2031) | Share, Forecast, Trends, Competitive Landscape, Segmentation, Industry, Companies, Growth, Value, Analysis, Outlook, Size & Revenue
Market Forecast By Type (Manual, Pneumatic, Electric, Hydraulic), By Application (Onshore, Offshore) And Competitive Landscape
| Product Code: ETC8551978 | Publication Date: Sep 2024 | Updated Date: Apr 2026 | Product Type: Market Research Report | |
| Publisher: 6Wresearch | Author: Sumit Sagar | No. of Pages: 75 | No. of Figures: 35 | No. of Tables: 20 |
Netherlands Winch Market Size (2020-2030)
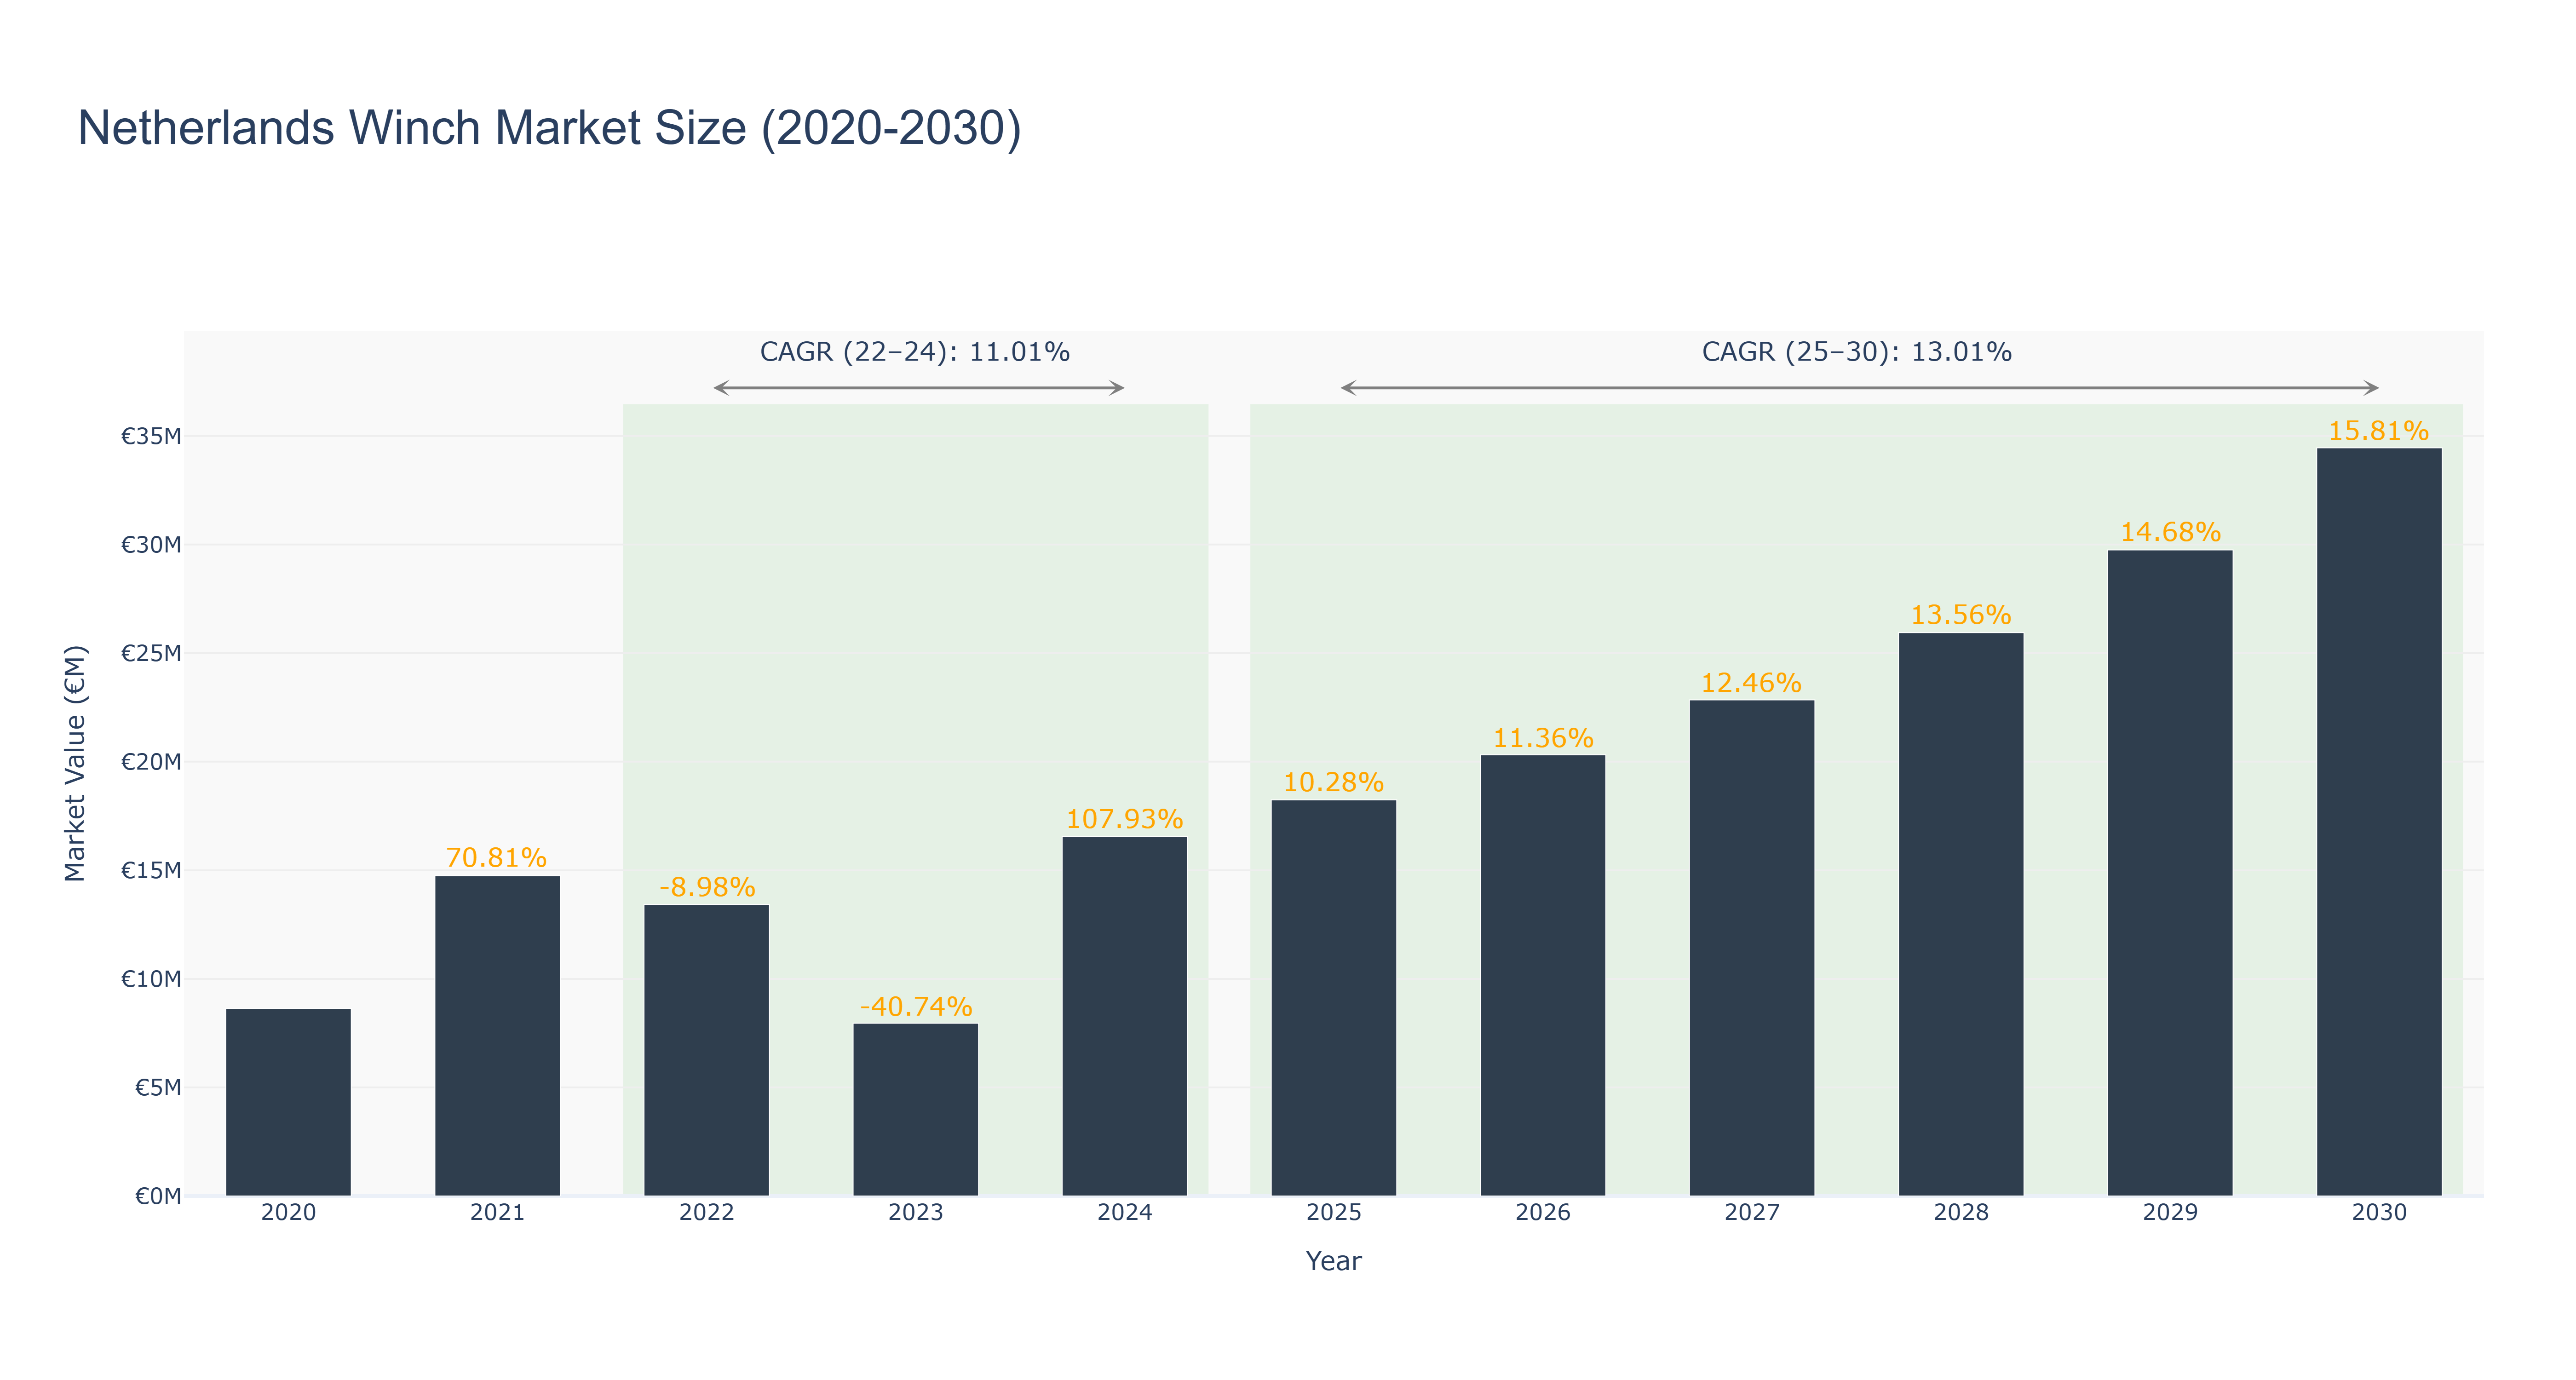
Netherlands Winch Market has shown a fluctuating trend over the past decade. The peak market size was observed in 2030 at €34.45 million. From 2020 to 2024, the market size experienced variations, starting at €8.64 million in 2020, reaching a low of €7.96 million in 2023, and then surging to €16.54 million in 2024. The forecasted market size from 2025 to 2030 shows a consistent growth trajectory, with an estimated size of €34.45 million in 2030. The CAGR for the periods 2022-24 and 2025-30 are 11.01% and 13.01%, respectively. Industry drivers such as technological advancements in winch systems and increasing demand in the marine and construction sectors are propelling market growth. Looking ahead, upcoming infrastructure projects in the Netherlands, like the Port of Rotterdam expansion, are set to further boost demand for winch systems in the region.
Netherlands Winch Market: Production & Trade Performance (2019-2025)
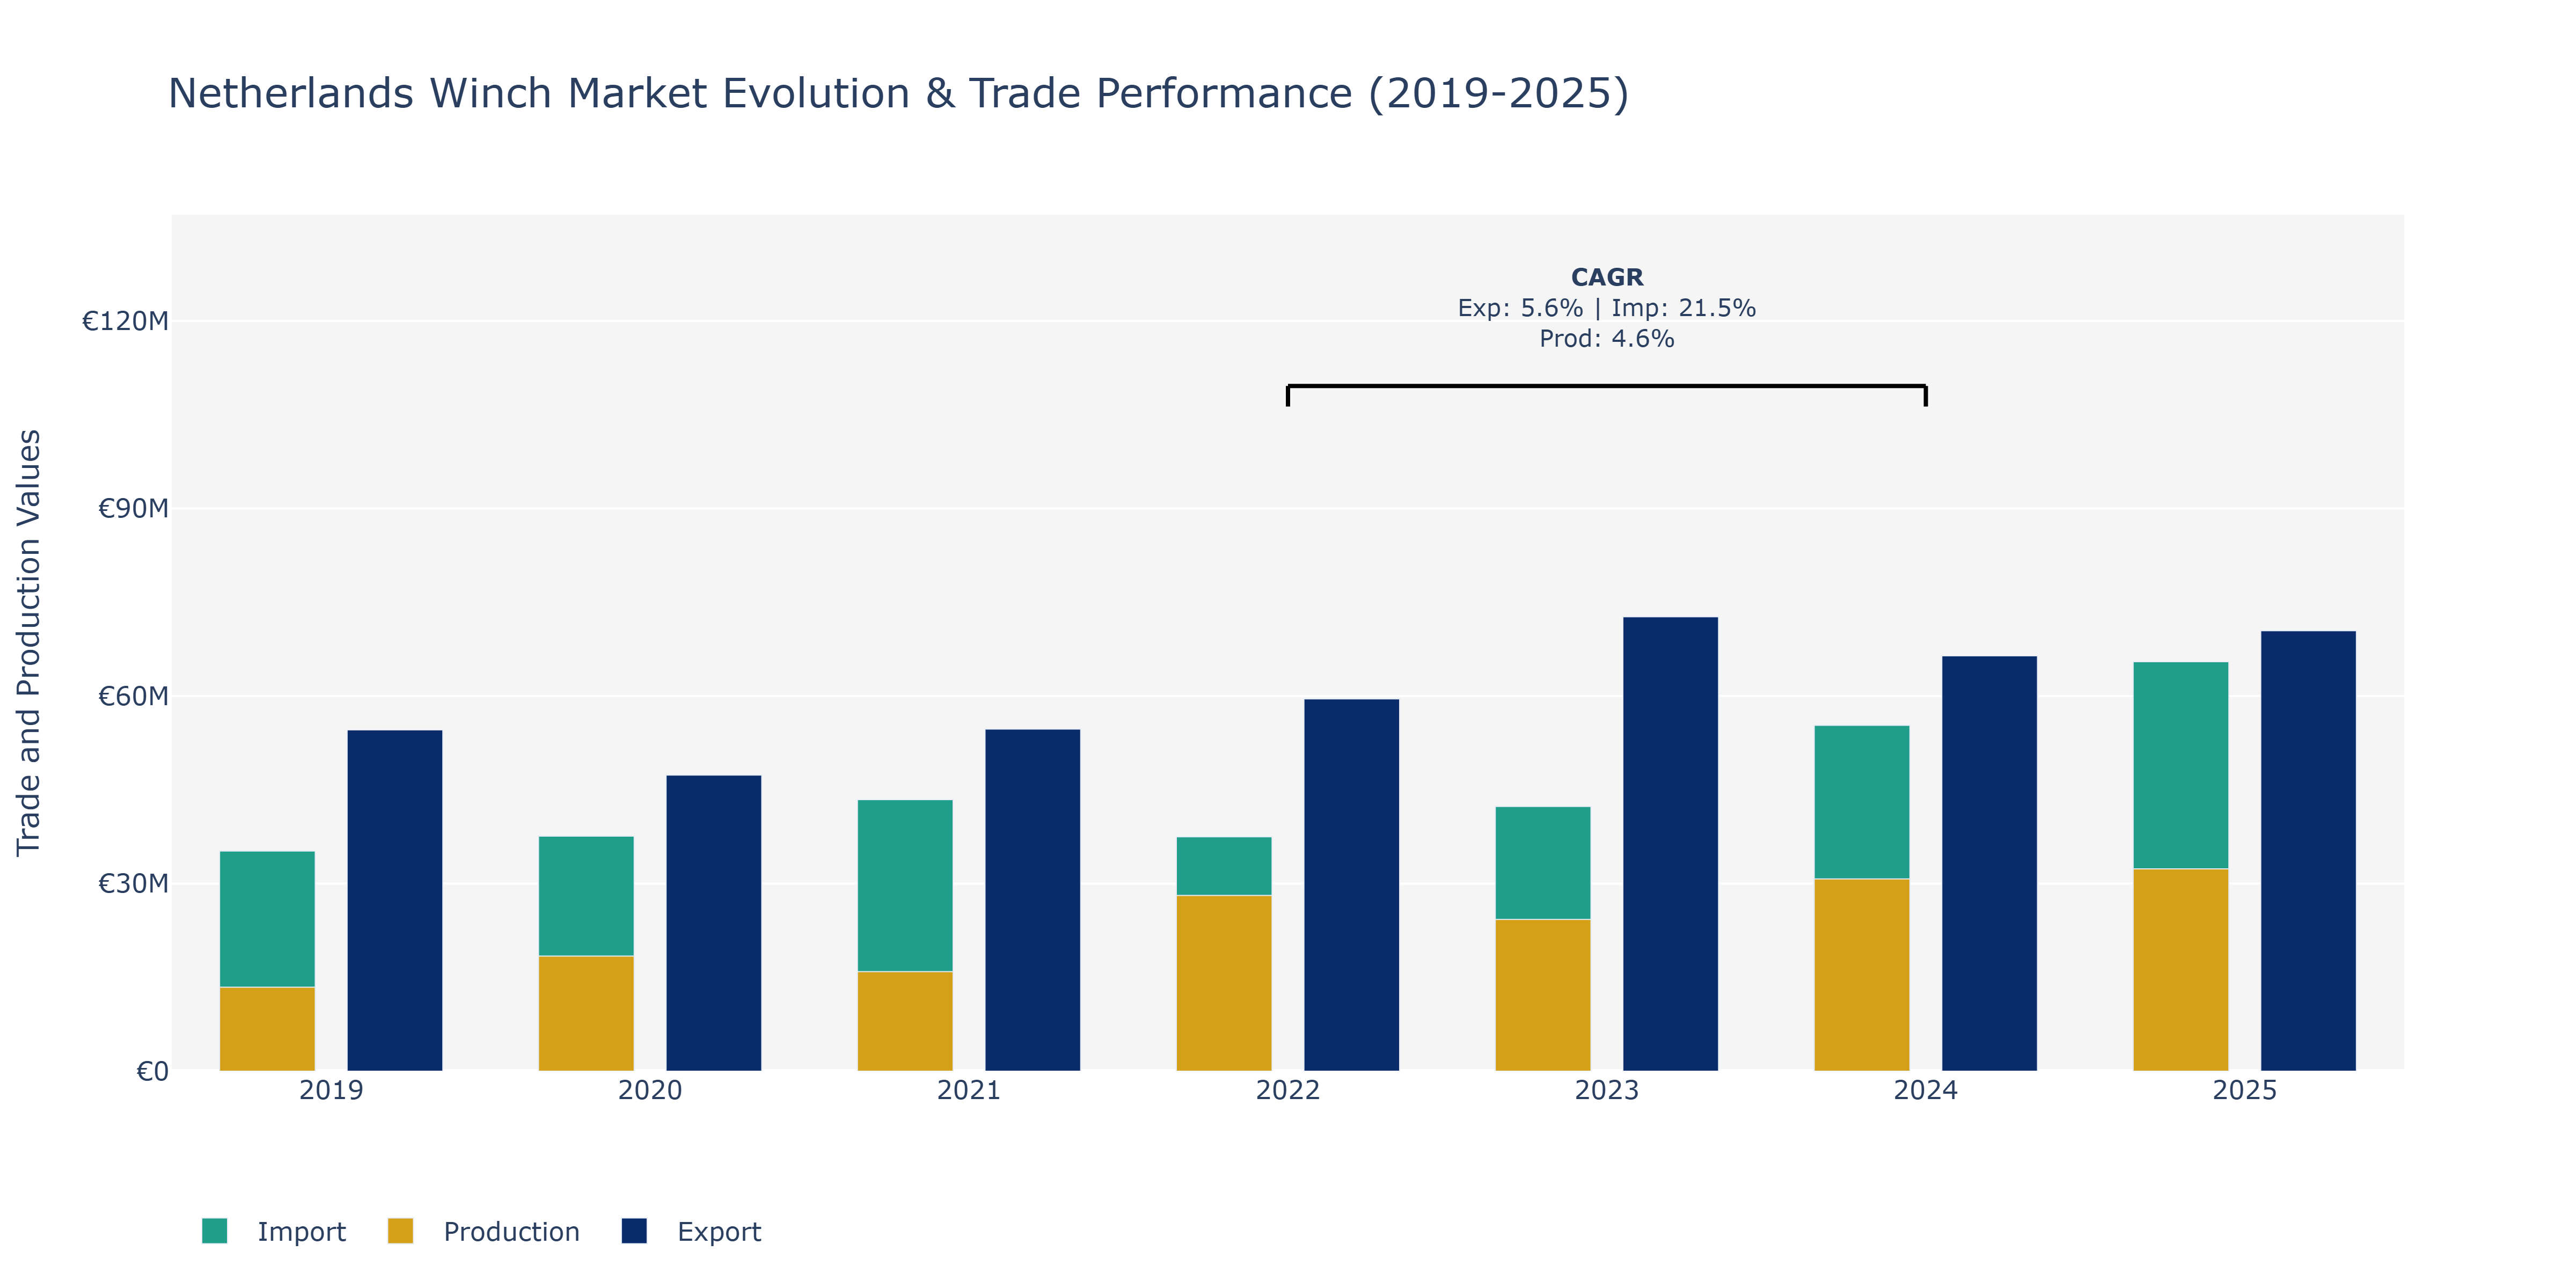
Between 2019 and 2025, the Netherlands Winch Market exhibited intriguing dynamics in Exports, Imports, and Production. Exports decreased from €54.59 million in 2019 to €47.36 million in 2020 but rebounded to €70.45 million in 2025, signaling a notable recovery and growth trend over the period. Imports, on the other hand, fluctuated, reaching a peak of €65.5 million in 2025 after several fluctuations. Production demonstrated a steady upward trajectory, rising from €13.43 million in 2019 to €32.36 million in 2025. These shifts could be attributed to various factors, including evolving global demand for winch products, advancements in technology enhancing production efficiency, and strategic trade partnerships influencing export and import volumes. The market's resilience and growth potential are evident, aligning with the expanding global maritime industry and the implementation of sustainable practices driving demand for winch equipment.
Key Highlights of the Report:
- Netherlands Winch Market Outlook
- Market Size of Netherlands Winch Market, 2024
- Forecast of Netherlands Winch Market, 2031
- Historical Data and Forecast of Netherlands Winch Revenues & Volume for the Period 2021- 2031
- Netherlands Winch Market Trend Evolution
- Netherlands Winch Market Drivers and Challenges
- Netherlands Winch Price Trends
- Netherlands Winch Porter's Five Forces
- Netherlands Winch Industry Life Cycle
- Historical Data and Forecast of Netherlands Winch Market Revenues & Volume By Type for the Period 2021- 2031
- Historical Data and Forecast of Netherlands Winch Market Revenues & Volume By Manual for the Period 2021- 2031
- Historical Data and Forecast of Netherlands Winch Market Revenues & Volume By Pneumatic for the Period 2021- 2031
- Historical Data and Forecast of Netherlands Winch Market Revenues & Volume By Electric for the Period 2021- 2031
- Historical Data and Forecast of Netherlands Winch Market Revenues & Volume By Hydraulic for the Period 2021- 2031
- Historical Data and Forecast of Netherlands Winch Market Revenues & Volume By Application for the Period 2021- 2031
- Historical Data and Forecast of Netherlands Winch Market Revenues & Volume By Onshore for the Period 2021- 2031
- Historical Data and Forecast of Netherlands Winch Market Revenues & Volume By Offshore for the Period 2021- 2031
- Netherlands Winch Import Export Trade Statistics
- Market Opportunity Assessment By Type
- Market Opportunity Assessment By Application
- Netherlands Winch Top Companies Market Share
- Netherlands Winch Competitive Benchmarking By Technical and Operational Parameters
- Netherlands Winch Company Profiles
- Netherlands Winch Key Strategic Recommendations
Frequently Asked Questions About the Market Study (FAQs):
6Wresearch actively monitors the Netherlands Winch Market and publishes its comprehensive annual report, highlighting emerging trends, growth drivers, revenue analysis, and forecast outlook. Our insights help businesses to make data-backed strategic decisions with ongoing market dynamics. Our analysts track relevent industries related to the Netherlands Winch Market, allowing our clients with actionable intelligence and reliable forecasts tailored to emerging regional needs.
Yes, we provide customisation as per your requirements. To learn more, feel free to contact us on sales@6wresearch.com
1 Executive Summary |
2 Introduction |
2.1 Key Highlights of the Report |
2.2 Report Description |
2.3 Market Scope & Segmentation |
2.4 Research Methodology |
2.5 Assumptions |
3 Netherlands Winch Market Overview |
3.1 Netherlands Country Macro Economic Indicators |
3.2 Netherlands Winch Market Revenues & Volume, 2021 & 2031F |
3.3 Netherlands Winch Market - Industry Life Cycle |
3.4 Netherlands Winch Market - Porter's Five Forces |
3.5 Netherlands Winch Market Revenues & Volume Share, By Type, 2021 & 2031F |
3.6 Netherlands Winch Market Revenues & Volume Share, By Application, 2021 & 2031F |
4 Netherlands Winch Market Dynamics |
4.1 Impact Analysis |
4.2 Market Drivers |
4.2.1 Increasing demand for winches in the marine industry for activities such as anchoring and mooring. |
4.2.2 Growth in the construction sector leading to higher demand for winches for lifting and pulling heavy materials. |
4.2.3 Rising investments in the renewable energy sector driving the need for winches for installation and maintenance of equipment. |
4.3 Market Restraints |
4.3.1 High initial investment required for purchasing winches may limit market growth. |
4.3.2 Stringent regulations and standards related to safety and quality in the manufacturing of winches could pose challenges to market players. |
4.3.3 Competition from alternative technologies such as hydraulic systems or cranes may impact the demand for winches. |
5 Netherlands Winch Market Trends |
6 Netherlands Winch Market, By Types |
6.1 Netherlands Winch Market, By Type |
6.1.1 Overview and Analysis |
6.1.2 Netherlands Winch Market Revenues & Volume, By Type, 2021- 2031F |
6.1.3 Netherlands Winch Market Revenues & Volume, By Manual, 2021- 2031F |
6.1.4 Netherlands Winch Market Revenues & Volume, By Pneumatic, 2021- 2031F |
6.1.5 Netherlands Winch Market Revenues & Volume, By Electric, 2021- 2031F |
6.1.6 Netherlands Winch Market Revenues & Volume, By Hydraulic, 2021- 2031F |
6.2 Netherlands Winch Market, By Application |
6.2.1 Overview and Analysis |
6.2.2 Netherlands Winch Market Revenues & Volume, By Onshore, 2021- 2031F |
6.2.3 Netherlands Winch Market Revenues & Volume, By Offshore, 2021- 2031F |
7 Netherlands Winch Market Import-Export Trade Statistics |
7.1 Netherlands Winch Market Export to Major Countries |
7.2 Netherlands Winch Market Imports from Major Countries |
8 Netherlands Winch Market Key Performance Indicators |
8.1 Average utilization rate of winches in key industries (marine, construction, renewable energy). |
8.2 Rate of adoption of advanced winch technologies in the Netherlands market. |
8.3 Number of new product developments or innovations introduced in the winch market. |
9 Netherlands Winch Market - Opportunity Assessment |
9.1 Netherlands Winch Market Opportunity Assessment, By Type, 2021 & 2031F |
9.2 Netherlands Winch Market Opportunity Assessment, By Application, 2021 & 2031F |
10 Netherlands Winch Market - Competitive Landscape |
10.1 Netherlands Winch Market Revenue Share, By Companies, 2024 |
10.2 Netherlands Winch Market Competitive Benchmarking, By Operating and Technical Parameters |
11 Company Profiles |
12 Recommendations |
13 Disclaimer |
Export potential assessment - trade Analytics for 2030
Export potential enables firms to identify high-growth global markets with greater confidence by combining advanced trade intelligence with a structured quantitative methodology. The framework analyzes emerging demand trends and country-level import patterns while integrating macroeconomic and trade datasets such as GDP and population forecasts, bilateral import–export flows, tariff structures, elasticity differentials between developed and developing economies, geographic distance, and import demand projections. Using weighted trade values from 2020–2024 as the base period to project country-to-country export potential for 2030, these inputs are operationalized through calculated drivers such as gravity model parameters, tariff impact factors, and projected GDP per-capita growth. Through an analysis of hidden potentials, demand hotspots, and market conditions that are most favorable to success, this method enables firms to focus on target countries, maximize returns, and global expansion with data, backed by accuracy.
By factoring in the projected importer demand gap that is currently unmet and could be potential opportunity, it identifies the potential for the Exporter (Country) among 190 countries, against the general trade analysis, which identifies the biggest importer or exporter.
To discover high-growth global markets and optimize your business strategy:
Click Here
Pricing
- Single User License$ 1,995
- Department License$ 2,400
- Site License$ 3,120
- Global License$ 3,795

Search
Thought Leadership and Analyst Meet


Our Clients
Latest Reports
- Philippines Polyhydroxybutyrate-co-Hydroxyvalerate Market (2026-2032) | Trends, Insights, Challenges, Restraints, Competition, Size, Value, Forecast, Pricing, Share, Outlook, Revenue, Investment Opportunities, Strategy, Drivers, Demand, Growth, segmentation, Analysis, Companies
- Peru Polyhydroxybutyrate-co-Hydroxyvalerate Market (2026-2032) | Growth, Demand, Challenges, Share, Trends, Analysis, Pricing, Investment Opportunities, Drivers, Value, Forecast, Competition, Size, Companies, Insights, Outlook, Restraints, segmentation, Revenue, Strategy
- Pakistan Polyhydroxybutyrate-co-Hydroxyvalerate Market (2026-2032) | Restraints, segmentation, Pricing, Forecast, Share, Strategy, Competition, Trends, Insights, Drivers, Challenges, Growth, Revenue, Outlook, Value, Investment Opportunities, Companies, Size, Analysis, Demand
- Oman Polyhydroxybutyrate-co-Hydroxyvalerate Market (2026-2032) | Drivers, segmentation, Insights, Competition, Pricing, Outlook, Size, Revenue, Challenges, Forecast, Analysis, Growth, Value, Share, Trends, Investment Opportunities, Strategy, Restraints, Companies, Demand
- Nigeria Polyhydroxybutyrate-co-Hydroxyvalerate Market (2026-2032) | Value, Investment Opportunities, Analysis, Revenue, Restraints, Pricing, Outlook, Competition, Demand, Growth, Forecast, Companies, Trends, Challenges, segmentation, Drivers, Insights, Share, Size, Strategy
- Nepal Polyhydroxybutyrate-co-Hydroxyvalerate Market (2026-2032) | Insights, Analysis, Drivers, Share, Revenue, Demand, segmentation, Investment Opportunities, Competition, Forecast, Growth, Pricing, Companies, Strategy, Trends, Restraints, Challenges, Outlook, Size, Value
- Myanmar Polyhydroxybutyrate-co-Hydroxyvalerate Market (2026-2032) | Outlook, Revenue, Strategy, Restraints, Drivers, segmentation, Share, Forecast, Competition, Insights, Growth, Pricing, Size, Demand, Value, Companies, Trends, Challenges, Investment Opportunities, Analysis
- Morocco Polyhydroxybutyrate-co-Hydroxyvalerate Market (2026-2032) | Outlook, Investment Opportunities, Restraints, Strategy, Forecast, Challenges, Drivers, Growth, Companies, segmentation, Trends, Size, Competition, Revenue, Demand, Insights, Share, Analysis, Value, Pricing
- Mexico Polyhydroxybutyrate-co-Hydroxyvalerate Market (2026-2032) | Size, Drivers, Outlook, Share, Strategy, Growth, Pricing, Challenges, Companies, Demand, Value, Investment Opportunities, Restraints, Trends, Forecast, segmentation, Analysis, Insights, Competition, Revenue
- Malaysia Polyhydroxybutyrate-co-Hydroxyvalerate Market (2026-2032) | Share, segmentation, Size, Companies, Analysis, Insights, Forecast, Value, Revenue, Drivers, Restraints, Challenges, Investment Opportunities, Trends, Competition, Strategy, Demand, Growth, Outlook, Pricing
Industry Events and Analyst Meet

HIMTEX 2026

India Refining Summit 2026

India EV Show 2026

EV tech India Expo 2026

Auto Tech Asia 2026
Whitepaper
- Middle East & Africa Commercial Security Market Click here to view more.
- Middle East & Africa Fire Safety Systems & Equipment Market Click here to view more.
- GCC Drone Market Click here to view more.
- Middle East Lighting Fixture Market Click here to view more.
- GCC Physical & Perimeter Security Market Click here to view more.
6WResearch In News
- Doha a strategic location for EV manufacturing hub: IPA Qatar
- Demand for luxury TVs surging in the GCC, says Samsung
- Empowering Growth: The Thriving Journey of Bangladesh’s Cable Industry
- Demand for luxury TVs surging in the GCC, says Samsung
- Video call with a traditional healer? Once unthinkable, it’s now common in South Africa
- Intelligent Buildings To Smooth GCC’s Path To Net Zero