New Zealand Kegs Market (2025-2031) | Segmentation, Size, Growth, Industry, Share, Value, Revenue, Forecast, Analysis, Trends, Companies & Outlook
Market Forecast By Material (Plastic, Tin, Stainless Steel), By Capacity (Up to 20 Liter, 20 Liter to 40 Liter, 40 Liter to 60 Liter, Above 60 Liter), By End Use (Alcoholic Beverages, Non-Alcoholic Beverages, Cooking Oil, Chemicals, Others), By Distribution Channel (Supermarket/Hypermarket, Commercial Liquor Store, Others) And Competitive Landscape
| Product Code: ETC5099431 | Publication Date: Nov 2023 | Updated Date: Nov 2025 | Product Type: Market Research Report | |
| Publisher: 6Wresearch | Author: Sachin Kumar Rai | No. of Pages: 60 | No. of Figures: 30 | No. of Tables: 5 |
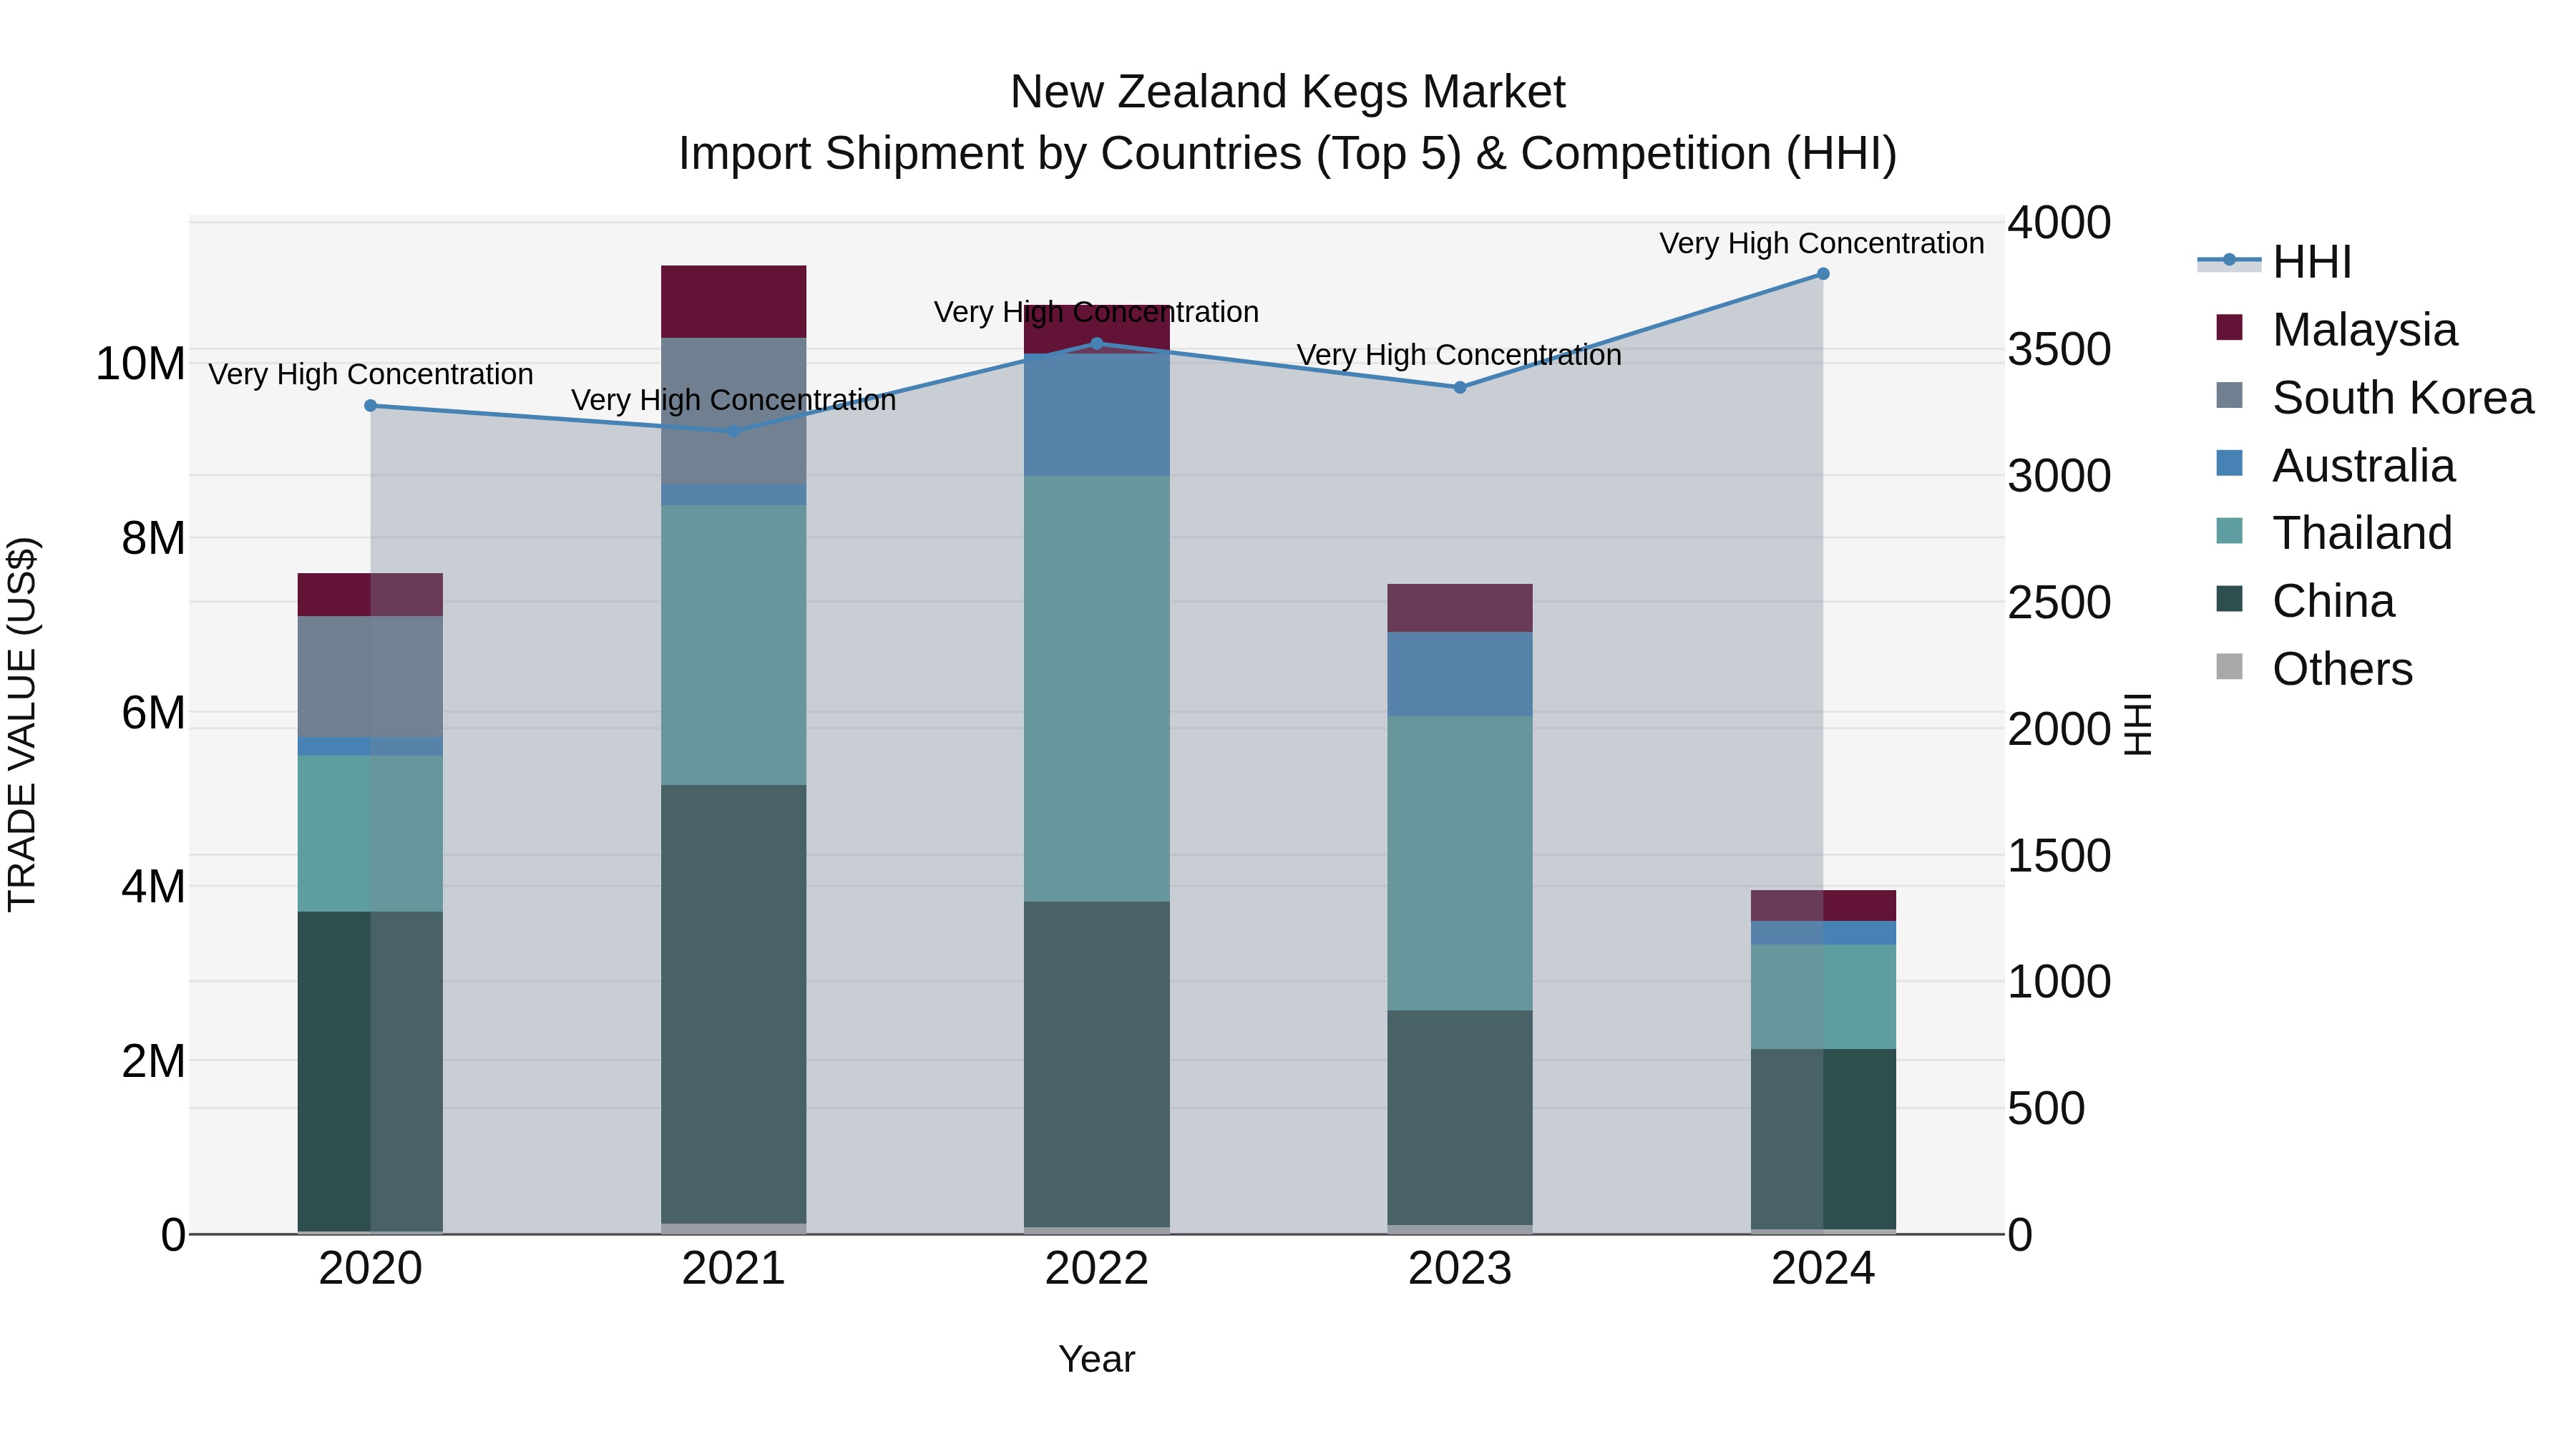
New Zealand Kegs Market Top 5 Importing Countries and Market Competition (HHI) Analysis
New Zealand`s keg import market in 2024 continues to be dominated by key players such as China, Thailand, Malaysia, Australia, and the USA. The high concentration levels indicate a competitive landscape, with the Herfindahl-Hirschman Index (HHI) remaining notably high. However, the market experienced a significant decline in both the compound annual growth rate (CAGR) from 2020 to 2024 at -15.08% and the growth rate from 2023 to 2024 at -47.13%. This suggests a challenging environment for keg importers in New Zealand, necessitating strategic adaptations to navigate the evolving market dynamics.
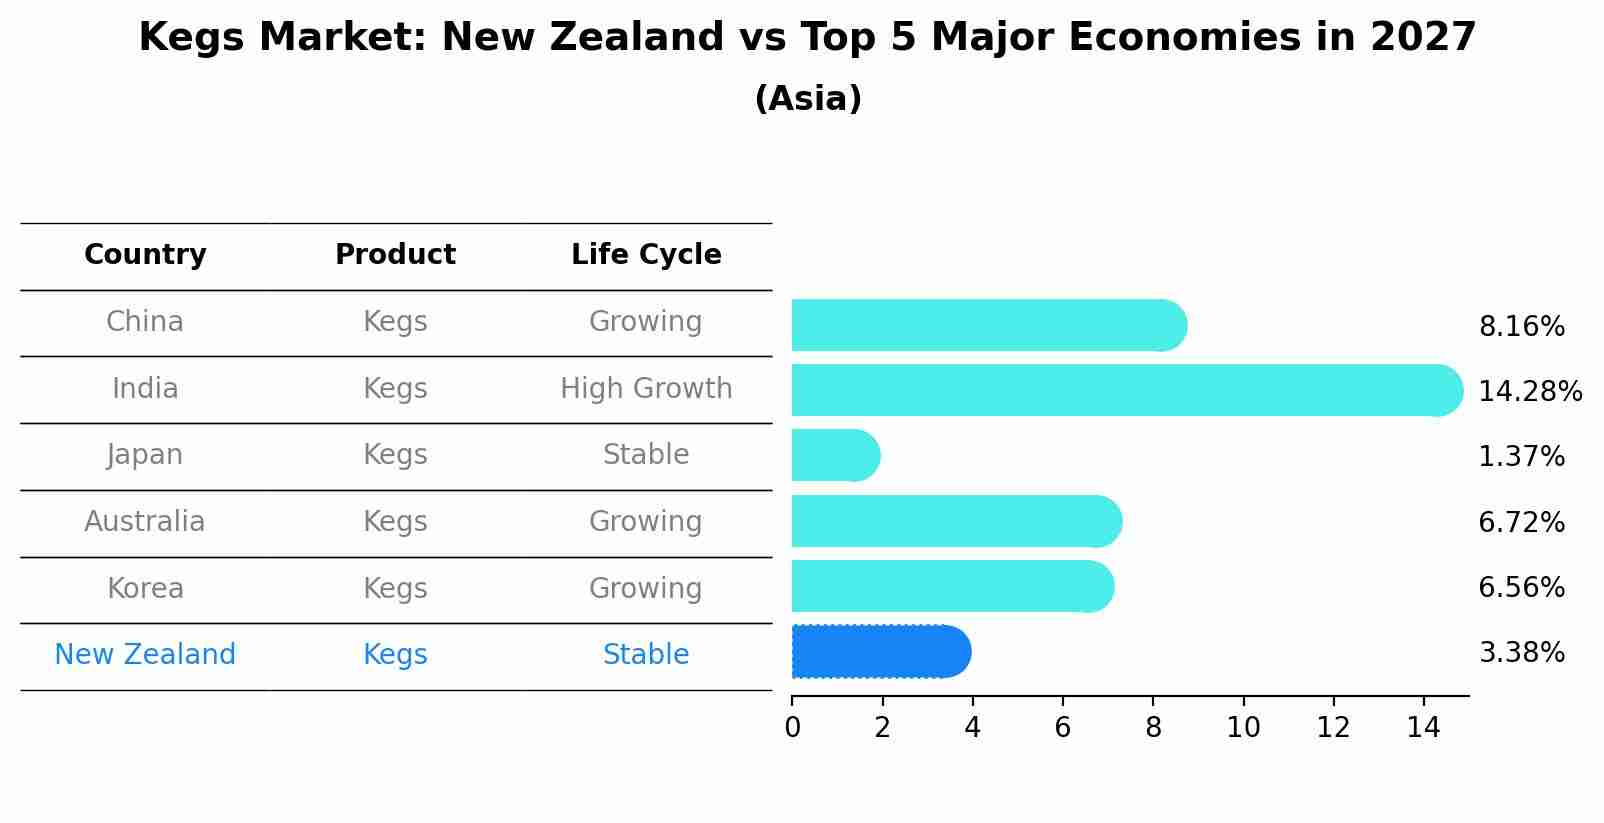
Kegs Market: New Zealand vs Top 5 Major Economies in 2027 (Asia)
By 2027, New Zealand's Kegs market is forecasted to achieve a stable growth rate of 3.38%, with China leading the Asia region, followed by India, Japan, Australia and South Korea.
New Zealand Kegs Market Overview
The kegs market in New Zealand is driven by the thriving beverage industry, particularly craft beer. The demand for high-quality, durable kegs is growing among breweries and beverage distributors.
Drivers of the market
The kegs market in New Zealand is influenced by the growing beverage industry, particularly the craft beer and cider segments. Kegs are essential for storing and transporting beverages, maintaining their freshness and quality. The increasing number of microbreweries and the rising popularity of draft beer contribute to market growth. Additionally, the use of kegs in the hospitality industry for events and on-premise consumption further drives demand.
Challenges of the market
The Kegs market in New Zealand faces challenges associated with changing consumption patterns and preferences, particularly in the alcoholic beverage industry. With the rise of craft breweries and microbreweries, keg suppliers must adapt to diverse customer demands while ensuring efficient logistics and quality control. Moreover, regulatory compliance and environmental sustainability considerations add complexity to the market landscape.
Government Policy of the market
Government policies supporting the beverage industry and sustainable packaging solutions drive the kegs market. Initiatives promoting recycling and reducing packaging waste are significant.
Key Highlights of the Report:
- New Zealand Kegs Market Outlook
- Market Size of New Zealand Kegs Market, 2024
- Forecast of New Zealand Kegs Market, 2031
- Historical Data and Forecast of New Zealand Kegs Revenues & Volume for the Period 2021-2031
- New Zealand Kegs Market Trend Evolution
- New Zealand Kegs Market Drivers and Challenges
- New Zealand Kegs Price Trends
- New Zealand Kegs Porter`s Five Forces
- New Zealand Kegs Industry Life Cycle
- Historical Data and Forecast of New Zealand Kegs Market Revenues & Volume By Material for the Period 2021-2031
- Historical Data and Forecast of New Zealand Kegs Market Revenues & Volume By Plastic for the Period 2021-2031
- Historical Data and Forecast of New Zealand Kegs Market Revenues & Volume By Tin for the Period 2021-2031
- Historical Data and Forecast of New Zealand Kegs Market Revenues & Volume By Stainless Steel for the Period 2021-2031
- Historical Data and Forecast of New Zealand Kegs Market Revenues & Volume By Capacity for the Period 2021-2031
- Historical Data and Forecast of New Zealand Kegs Market Revenues & Volume By Up to 20 Liter for the Period 2021-2031
- Historical Data and Forecast of New Zealand Kegs Market Revenues & Volume By 20 Liter to 40 Liter for the Period 2021-2031
- Historical Data and Forecast of New Zealand Kegs Market Revenues & Volume By 40 Liter to 60 Liter for the Period 2021-2031
- Historical Data and Forecast of New Zealand Kegs Market Revenues & Volume By Above 60 Liter for the Period 2021-2031
- Historical Data and Forecast of New Zealand Kegs Market Revenues & Volume By End Use for the Period 2021-2031
- Historical Data and Forecast of New Zealand Kegs Market Revenues & Volume By Alcoholic Beverages for the Period 2021-2031
- Historical Data and Forecast of New Zealand Kegs Market Revenues & Volume By Non-Alcoholic Beverages for the Period 2021-2031
- Historical Data and Forecast of New Zealand Kegs Market Revenues & Volume By Cooking Oil for the Period 2021-2031
- Historical Data and Forecast of New Zealand Kegs Market Revenues & Volume By Chemicals for the Period 2021-2031
- Historical Data and Forecast of New Zealand Kegs Market Revenues & Volume By Others for the Period 2021-2031
- Historical Data and Forecast of New Zealand Kegs Market Revenues & Volume By Distribution Channel for the Period 2021-2031
- Historical Data and Forecast of New Zealand Kegs Market Revenues & Volume By Supermarket/Hypermarket for the Period 2021-2031
- Historical Data and Forecast of New Zealand Kegs Market Revenues & Volume By Commercial Liquor Store for the Period 2021-2031
- Historical Data and Forecast of New Zealand Kegs Market Revenues & Volume By Others for the Period 2021-2031
- New Zealand Kegs Import Export Trade Statistics
- Market Opportunity Assessment By Material
- Market Opportunity Assessment By Capacity
- Market Opportunity Assessment By End Use
- Market Opportunity Assessment By Distribution Channel
- New Zealand Kegs Top Companies Market Share
- New Zealand Kegs Competitive Benchmarking By Technical and Operational Parameters
- New Zealand Kegs Company Profiles
- New Zealand Kegs Key Strategic Recommendations
Frequently Asked Questions About the Market Study (FAQs):
6Wresearch actively monitors the New Zealand Kegs Market and publishes its comprehensive annual report, highlighting emerging trends, growth drivers, revenue analysis, and forecast outlook. Our insights help businesses to make data-backed strategic decisions with ongoing market dynamics. Our analysts track relevent industries related to the New Zealand Kegs Market, allowing our clients with actionable intelligence and reliable forecasts tailored to emerging regional needs.
Yes, we provide customisation as per your requirements. To learn more, feel free to contact us on sales@6wresearch.com
1 Executive Summary |
2 Introduction |
2.1 Key Highlights of the Report |
2.2 Report Description |
2.3 Market Scope & Segmentation |
2.4 Research Methodology |
2.5 Assumptions |
3 New Zealand Kegs Market Overview |
3.1 New Zealand Country Macro Economic Indicators |
3.2 New Zealand Kegs Market Revenues & Volume, 2021 & 2031F |
3.3 New Zealand Kegs Market - Industry Life Cycle |
3.4 New Zealand Kegs Market - Porter's Five Forces |
3.5 New Zealand Kegs Market Revenues & Volume Share, By Material, 2021 & 2031F |
3.6 New Zealand Kegs Market Revenues & Volume Share, By Capacity, 2021 & 2031F |
3.7 New Zealand Kegs Market Revenues & Volume Share, By End Use, 2021 & 2031F |
3.8 New Zealand Kegs Market Revenues & Volume Share, By Distribution Channel, 2021 & 2031F |
4 New Zealand Kegs Market Dynamics |
4.1 Impact Analysis |
4.2 Market Drivers |
4.2.1 Growing popularity of craft breweries in New Zealand |
4.2.2 Increasing consumer preference for draft beer over bottled beer |
4.2.3 Rising demand for kegs in the hospitality sector |
4.3 Market Restraints |
4.3.1 High initial investment required for kegging equipment |
4.3.2 Strict regulations and compliance standards for kegging operations |
4.3.3 Limited availability of raw materials for keg production |
5 New Zealand Kegs Market Trends |
6 New Zealand Kegs Market Segmentations |
6.1 New Zealand Kegs Market, By Material |
6.1.1 Overview and Analysis |
6.1.2 New Zealand Kegs Market Revenues & Volume, By Plastic, 2021-2031F |
6.1.3 New Zealand Kegs Market Revenues & Volume, By Tin, 2021-2031F |
6.1.4 New Zealand Kegs Market Revenues & Volume, By Stainless Steel, 2021-2031F |
6.2 New Zealand Kegs Market, By Capacity |
6.2.1 Overview and Analysis |
6.2.2 New Zealand Kegs Market Revenues & Volume, By Up to 20 Liter, 2021-2031F |
6.2.3 New Zealand Kegs Market Revenues & Volume, By 20 Liter to 40 Liter, 2021-2031F |
6.2.4 New Zealand Kegs Market Revenues & Volume, By 40 Liter to 60 Liter, 2021-2031F |
6.2.5 New Zealand Kegs Market Revenues & Volume, By Above 60 Liter, 2021-2031F |
6.3 New Zealand Kegs Market, By End Use |
6.3.1 Overview and Analysis |
6.3.2 New Zealand Kegs Market Revenues & Volume, By Alcoholic Beverages, 2021-2031F |
6.3.3 New Zealand Kegs Market Revenues & Volume, By Non-Alcoholic Beverages, 2021-2031F |
6.3.4 New Zealand Kegs Market Revenues & Volume, By Cooking Oil, 2021-2031F |
6.3.5 New Zealand Kegs Market Revenues & Volume, By Chemicals, 2021-2031F |
6.3.6 New Zealand Kegs Market Revenues & Volume, By Others, 2021-2031F |
6.4 New Zealand Kegs Market, By Distribution Channel |
6.4.1 Overview and Analysis |
6.4.2 New Zealand Kegs Market Revenues & Volume, By Supermarket/Hypermarket, 2021-2031F |
6.4.3 New Zealand Kegs Market Revenues & Volume, By Commercial Liquor Store, 2021-2031F |
6.4.4 New Zealand Kegs Market Revenues & Volume, By Others, 2021-2031F |
7 New Zealand Kegs Market Import-Export Trade Statistics |
7.1 New Zealand Kegs Market Export to Major Countries |
7.2 New Zealand Kegs Market Imports from Major Countries |
8 New Zealand Kegs Market Key Performance Indicators |
8.1 Average keg turnover rate per month |
8.2 Percentage of breweries using kegs as their primary packaging option |
8.3 Number of new entrants in the kegs manufacturing industry |
9 New Zealand Kegs Market - Opportunity Assessment |
9.1 New Zealand Kegs Market Opportunity Assessment, By Material, 2021 & 2031F |
9.2 New Zealand Kegs Market Opportunity Assessment, By Capacity, 2021 & 2031F |
9.3 New Zealand Kegs Market Opportunity Assessment, By End Use, 2021 & 2031F |
9.4 New Zealand Kegs Market Opportunity Assessment, By Distribution Channel, 2021 & 2031F |
10 New Zealand Kegs Market - Competitive Landscape |
10.1 New Zealand Kegs Market Revenue Share, By Companies, 2024 |
10.2 New Zealand Kegs Market Competitive Benchmarking, By Operating and Technical Parameters |
11 Company Profiles |
12 Recommendations | 13 Disclaimer |
Export potential assessment - trade Analytics for 2030
Export potential enables firms to identify high-growth global markets with greater confidence by combining advanced trade intelligence with a structured quantitative methodology. The framework analyzes emerging demand trends and country-level import patterns while integrating macroeconomic and trade datasets such as GDP and population forecasts, bilateral import–export flows, tariff structures, elasticity differentials between developed and developing economies, geographic distance, and import demand projections. Using weighted trade values from 2020–2024 as the base period to project country-to-country export potential for 2030, these inputs are operationalized through calculated drivers such as gravity model parameters, tariff impact factors, and projected GDP per-capita growth. Through an analysis of hidden potentials, demand hotspots, and market conditions that are most favorable to success, this method enables firms to focus on target countries, maximize returns, and global expansion with data, backed by accuracy.
By factoring in the projected importer demand gap that is currently unmet and could be potential opportunity, it identifies the potential for the Exporter (Country) among 190 countries, against the general trade analysis, which identifies the biggest importer or exporter.
To discover high-growth global markets and optimize your business strategy:
Click Here
Pricing
- Single User License$ 1,995
- Department License$ 2,400
- Site License$ 3,120
- Global License$ 3,795

Search
Thought Leadership and Analyst Meet


Our Clients
Latest Reports
- Philippines Polyhydroxybutyrate-co-Hydroxyvalerate Market (2026-2032) | Trends, Insights, Challenges, Restraints, Competition, Size, Value, Forecast, Pricing, Share, Outlook, Revenue, Investment Opportunities, Strategy, Drivers, Demand, Growth, segmentation, Analysis, Companies
- Peru Polyhydroxybutyrate-co-Hydroxyvalerate Market (2026-2032) | Growth, Demand, Challenges, Share, Trends, Analysis, Pricing, Investment Opportunities, Drivers, Value, Forecast, Competition, Size, Companies, Insights, Outlook, Restraints, segmentation, Revenue, Strategy
- Pakistan Polyhydroxybutyrate-co-Hydroxyvalerate Market (2026-2032) | Restraints, segmentation, Pricing, Forecast, Share, Strategy, Competition, Trends, Insights, Drivers, Challenges, Growth, Revenue, Outlook, Value, Investment Opportunities, Companies, Size, Analysis, Demand
- Oman Polyhydroxybutyrate-co-Hydroxyvalerate Market (2026-2032) | Drivers, segmentation, Insights, Competition, Pricing, Outlook, Size, Revenue, Challenges, Forecast, Analysis, Growth, Value, Share, Trends, Investment Opportunities, Strategy, Restraints, Companies, Demand
- Nigeria Polyhydroxybutyrate-co-Hydroxyvalerate Market (2026-2032) | Value, Investment Opportunities, Analysis, Revenue, Restraints, Pricing, Outlook, Competition, Demand, Growth, Forecast, Companies, Trends, Challenges, segmentation, Drivers, Insights, Share, Size, Strategy
- Nepal Polyhydroxybutyrate-co-Hydroxyvalerate Market (2026-2032) | Insights, Analysis, Drivers, Share, Revenue, Demand, segmentation, Investment Opportunities, Competition, Forecast, Growth, Pricing, Companies, Strategy, Trends, Restraints, Challenges, Outlook, Size, Value
- Myanmar Polyhydroxybutyrate-co-Hydroxyvalerate Market (2026-2032) | Outlook, Revenue, Strategy, Restraints, Drivers, segmentation, Share, Forecast, Competition, Insights, Growth, Pricing, Size, Demand, Value, Companies, Trends, Challenges, Investment Opportunities, Analysis
- Morocco Polyhydroxybutyrate-co-Hydroxyvalerate Market (2026-2032) | Outlook, Investment Opportunities, Restraints, Strategy, Forecast, Challenges, Drivers, Growth, Companies, segmentation, Trends, Size, Competition, Revenue, Demand, Insights, Share, Analysis, Value, Pricing
- Mexico Polyhydroxybutyrate-co-Hydroxyvalerate Market (2026-2032) | Size, Drivers, Outlook, Share, Strategy, Growth, Pricing, Challenges, Companies, Demand, Value, Investment Opportunities, Restraints, Trends, Forecast, segmentation, Analysis, Insights, Competition, Revenue
- Malaysia Polyhydroxybutyrate-co-Hydroxyvalerate Market (2026-2032) | Share, segmentation, Size, Companies, Analysis, Insights, Forecast, Value, Revenue, Drivers, Restraints, Challenges, Investment Opportunities, Trends, Competition, Strategy, Demand, Growth, Outlook, Pricing
Industry Events and Analyst Meet

HIMTEX 2026

India Refining Summit 2026

India EV Show 2026

EV tech India Expo 2026

Auto Tech Asia 2026
Whitepaper
- Middle East & Africa Commercial Security Market Click here to view more.
- Middle East & Africa Fire Safety Systems & Equipment Market Click here to view more.
- GCC Drone Market Click here to view more.
- Middle East Lighting Fixture Market Click here to view more.
- GCC Physical & Perimeter Security Market Click here to view more.
6WResearch In News
- Doha a strategic location for EV manufacturing hub: IPA Qatar
- Demand for luxury TVs surging in the GCC, says Samsung
- Empowering Growth: The Thriving Journey of Bangladesh’s Cable Industry
- Demand for luxury TVs surging in the GCC, says Samsung
- Video call with a traditional healer? Once unthinkable, it’s now common in South Africa
- Intelligent Buildings To Smooth GCC’s Path To Net Zero