New Zealand Refractories Market (2025-2031) | Value, Outlook, Analysis, Trends, Companies, Revenue, Size, Share, Industry, Forecast, Segmentation & Growth
Market Forecast By Form Types (Shaped Refractories, Unshaped Refractories), By Product Types (Non-clay Refractory, Clay Refractory), By End-users (Iron & Steel, Cement, Non-Ferrous Metals, Glass, Others) And Competitive Landscape
| Product Code: ETC4654812 | Publication Date: Nov 2023 | Updated Date: Nov 2025 | Product Type: Market Research Report | |
| Publisher: 6Wresearch | Author: Shubham Deep | No. of Pages: 60 | No. of Figures: 30 | No. of Tables: 5 |
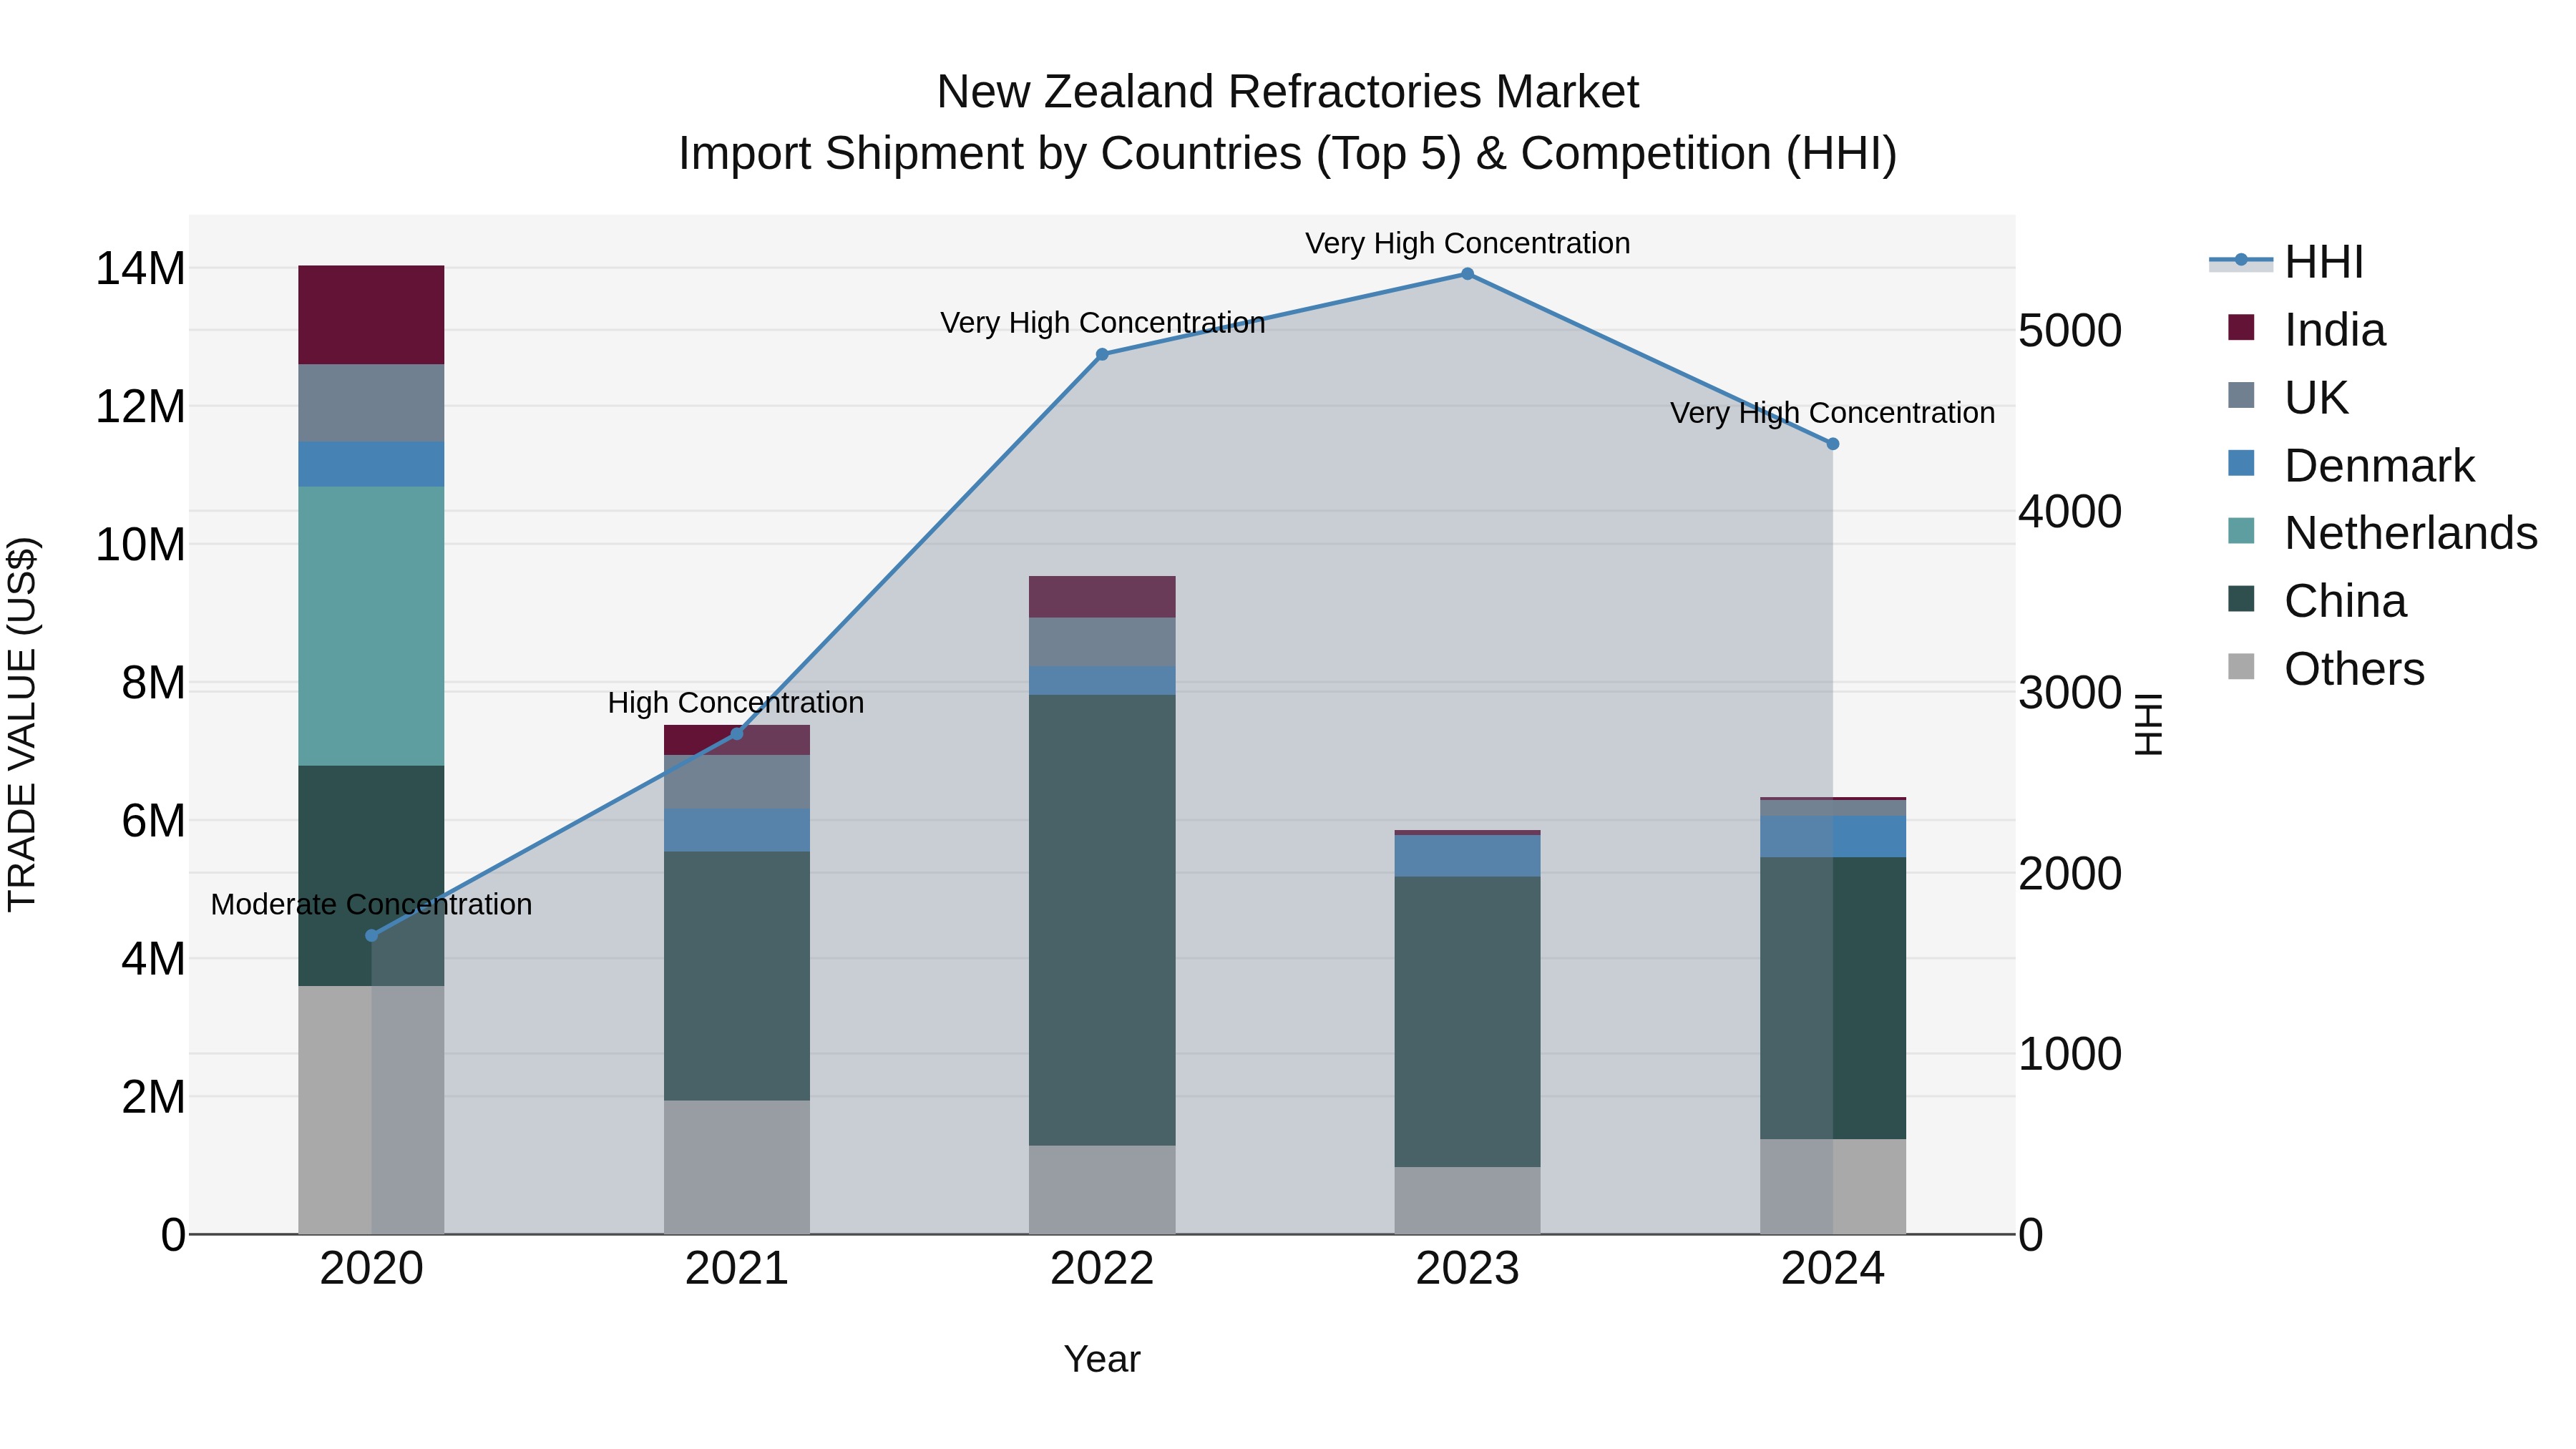
New Zealand Refractories Market Top 5 Importing Countries and Market Competition (HHI) Analysis
New Zealand`s refractories import market in 2024 continued to be dominated by key players such as China, Denmark, Australia, Germany, and Thailand. The high Herfindahl-Hirschman Index (HHI) indicates a concentrated market landscape. Despite a negative compound annual growth rate (CAGR) from 2020 to 2024, the industry saw a positive growth rate in 2024, indicating potential for recovery and expansion. The influx of imports from diverse countries suggests a competitive market environment and opportunities for innovation and collaboration within the refractories sector.
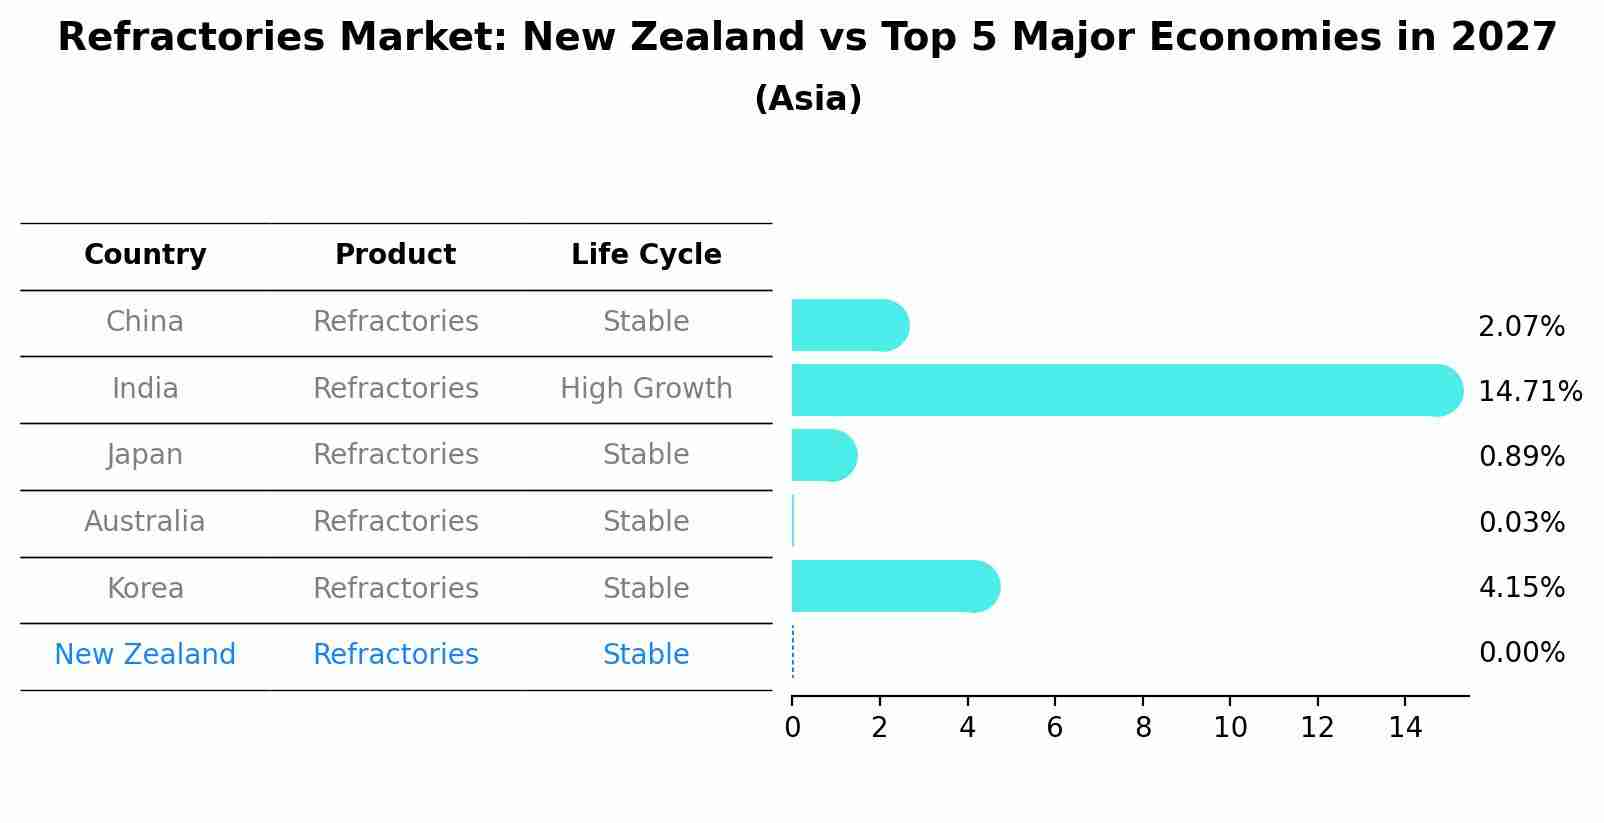
Refractories Market: New Zealand vs Top 5 Major Economies in 2027 (Asia)
The Refractories market in New Zealand is projected to grow at a stable growth rate of 0.00% by 2027, highlighting the country's increasing focus on advanced technologies within the Asia region, where China holds the dominant position, followed closely by India, Japan, Australia and South Korea, shaping overall regional demand.
New Zealand Refractories Market Overview
The refractories market in New Zealand serves industries such as steel, cement, glass, and ceramics, which require high-temperature materials capable of withstanding harsh operating conditions. The market is driven by factors such as industrial activity levels, infrastructure development, and technological advancements in refractory materials and manufacturing processes. Key players in the market offer a variety of refractory products, including bricks, monolithics, and precast shapes, tailored to the specific needs of different industries and applications.
Drivers of the market
The refractories market in New Zealand is driven by the demand from high-temperature industrial processes such as steel, cement, and glass manufacturing. The need for materials that can withstand extreme temperatures and corrosive environments is pushing the adoption of refractories. Additionally, the growth of the construction and infrastructure sectors, requiring durable and heat-resistant materials, is further contributing to market growth.
Challenges of the market
Challenges in the refrigerated vending machine market include high operational costs and maintenance. These machines require reliable cooling systems, which can be expensive to operate and maintain. Additionally, ensuring product freshness and meeting health and safety standards are critical for market success.
Government Policy of the market
The refractories market in New Zealand caters to diverse industries such as steel, cement, and glass manufacturing. Government policies aim to ensure high standards of product quality, safety, and energy efficiency in industrial operations.
Key Highlights of the Report:
- New Zealand Refractories Market Outlook
- Market Size of New Zealand Refractories Market, 2024
- Forecast of New Zealand Refractories Market, 2031
- Historical Data and Forecast of New Zealand Refractories Revenues & Volume for the Period 2021-2031
- New Zealand Refractories Market Trend Evolution
- New Zealand Refractories Market Drivers and Challenges
- New Zealand Refractories Price Trends
- New Zealand Refractories Porter`s Five Forces
- New Zealand Refractories Industry Life Cycle
- Historical Data and Forecast of New Zealand Refractories Market Revenues & Volume By Form Types for the Period 2021-2031
- Historical Data and Forecast of New Zealand Refractories Market Revenues & Volume By Shaped Refractories for the Period 2021-2031
- Historical Data and Forecast of New Zealand Refractories Market Revenues & Volume By Unshaped Refractories for the Period 2021-2031
- Historical Data and Forecast of New Zealand Refractories Market Revenues & Volume By Product Types for the Period 2021-2031
- Historical Data and Forecast of New Zealand Refractories Market Revenues & Volume By Non-clay Refractory for the Period 2021-2031
- Historical Data and Forecast of New Zealand Refractories Market Revenues & Volume By Clay Refractory for the Period 2021-2031
- Historical Data and Forecast of New Zealand Refractories Market Revenues & Volume By End-users for the Period 2021-2031
- Historical Data and Forecast of New Zealand Refractories Market Revenues & Volume By Iron & Steel for the Period 2021-2031
- Historical Data and Forecast of New Zealand Refractories Market Revenues & Volume By Cement for the Period 2021-2031
- Historical Data and Forecast of New Zealand Refractories Market Revenues & Volume By Non-Ferrous Metals for the Period 2021-2031
- Historical Data and Forecast of New Zealand Refractories Market Revenues & Volume By Glass for the Period 2021-2031
- Historical Data and Forecast of New Zealand Refractories Market Revenues & Volume By Others for the Period 2021-2031
- New Zealand Refractories Import Export Trade Statistics
- Market Opportunity Assessment By Form Types
- Market Opportunity Assessment By Product Types
- Market Opportunity Assessment By End-users
- New Zealand Refractories Top Companies Market Share
- New Zealand Refractories Competitive Benchmarking By Technical and Operational Parameters
- New Zealand Refractories Company Profiles
- New Zealand Refractories Key Strategic Recommendations
Frequently Asked Questions About the Market Study (FAQs):
6Wresearch actively monitors the New Zealand Refractories Market and publishes its comprehensive annual report, highlighting emerging trends, growth drivers, revenue analysis, and forecast outlook. Our insights help businesses to make data-backed strategic decisions with ongoing market dynamics. Our analysts track relevent industries related to the New Zealand Refractories Market, allowing our clients with actionable intelligence and reliable forecasts tailored to emerging regional needs.
Yes, we provide customisation as per your requirements. To learn more, feel free to contact us on sales@6wresearch.com
1 Executive Summary |
2 Introduction |
2.1 Key Highlights of the Report |
2.2 Report Description |
2.3 Market Scope & Segmentation |
2.4 Research Methodology |
2.5 Assumptions |
3 New Zealand Refractories Market Overview |
3.1 New Zealand Country Macro Economic Indicators |
3.2 New Zealand Refractories Market Revenues & Volume, 2021 & 2031F |
3.3 New Zealand Refractories Market - Industry Life Cycle |
3.4 New Zealand Refractories Market - Porter's Five Forces |
3.5 New Zealand Refractories Market Revenues & Volume Share, By Form Types, 2021 & 2031F |
3.6 New Zealand Refractories Market Revenues & Volume Share, By Product Types, 2021 & 2031F |
3.7 New Zealand Refractories Market Revenues & Volume Share, By End-users, 2021 & 2031F |
4 New Zealand Refractories Market Dynamics |
4.1 Impact Analysis |
4.2 Market Drivers |
4.2.1 Growing demand for refractories in industries such as steel, cement, and glass manufacturing |
4.2.2 Increasing focus on energy efficiency and sustainability driving the adoption of advanced refractory materials |
4.2.3 Rise in infrastructure development projects leading to higher demand for refractories products |
4.3 Market Restraints |
4.3.1 Fluctuating raw material prices impacting the overall production cost of refractories |
4.3.2 Stringent environmental regulations related to emissions and waste disposal affecting manufacturing processes |
5 New Zealand Refractories Market Trends |
6 New Zealand Refractories Market Segmentations |
6.1 New Zealand Refractories Market, By Form Types |
6.1.1 Overview and Analysis |
6.1.2 New Zealand Refractories Market Revenues & Volume, By Shaped Refractories, 2021-2031F |
6.1.3 New Zealand Refractories Market Revenues & Volume, By Unshaped Refractories, 2021-2031F |
6.2 New Zealand Refractories Market, By Product Types |
6.2.1 Overview and Analysis |
6.2.2 New Zealand Refractories Market Revenues & Volume, By Non-clay Refractory, 2021-2031F |
6.2.3 New Zealand Refractories Market Revenues & Volume, By Clay Refractory, 2021-2031F |
6.3 New Zealand Refractories Market, By End-users |
6.3.1 Overview and Analysis |
6.3.2 New Zealand Refractories Market Revenues & Volume, By Iron & Steel, 2021-2031F |
6.3.3 New Zealand Refractories Market Revenues & Volume, By Cement, 2021-2031F |
6.3.4 New Zealand Refractories Market Revenues & Volume, By Non-Ferrous Metals, 2021-2031F |
6.3.5 New Zealand Refractories Market Revenues & Volume, By Glass, 2021-2031F |
6.3.6 New Zealand Refractories Market Revenues & Volume, By Others, 2021-2031F |
7 New Zealand Refractories Market Import-Export Trade Statistics |
7.1 New Zealand Refractories Market Export to Major Countries |
7.2 New Zealand Refractories Market Imports from Major Countries |
8 New Zealand Refractories Market Key Performance Indicators |
8.1 Energy efficiency improvements in refractory products |
8.2 Adoption rate of advanced refractory materials in key industries |
8.3 Percentage of infrastructure projects utilizing refractories for construction requirements |
9 New Zealand Refractories Market - Opportunity Assessment |
9.1 New Zealand Refractories Market Opportunity Assessment, By Form Types, 2021 & 2031F |
9.2 New Zealand Refractories Market Opportunity Assessment, By Product Types, 2021 & 2031F |
9.3 New Zealand Refractories Market Opportunity Assessment, By End-users, 2021 & 2031F |
10 New Zealand Refractories Market - Competitive Landscape |
10.1 New Zealand Refractories Market Revenue Share, By Companies, 2024 |
10.2 New Zealand Refractories Market Competitive Benchmarking, By Operating and Technical Parameters |
11 Company Profiles |
12 Recommendations | 13 Disclaimer |
Export potential assessment - trade Analytics for 2030
Export potential enables firms to identify high-growth global markets with greater confidence by combining advanced trade intelligence with a structured quantitative methodology. The framework analyzes emerging demand trends and country-level import patterns while integrating macroeconomic and trade datasets such as GDP and population forecasts, bilateral import–export flows, tariff structures, elasticity differentials between developed and developing economies, geographic distance, and import demand projections. Using weighted trade values from 2020–2024 as the base period to project country-to-country export potential for 2030, these inputs are operationalized through calculated drivers such as gravity model parameters, tariff impact factors, and projected GDP per-capita growth. Through an analysis of hidden potentials, demand hotspots, and market conditions that are most favorable to success, this method enables firms to focus on target countries, maximize returns, and global expansion with data, backed by accuracy.
By factoring in the projected importer demand gap that is currently unmet and could be potential opportunity, it identifies the potential for the Exporter (Country) among 190 countries, against the general trade analysis, which identifies the biggest importer or exporter.
To discover high-growth global markets and optimize your business strategy:
Click Here
Pricing
- Single User License$ 1,995
- Department License$ 2,400
- Site License$ 3,120
- Global License$ 3,795

Search
Thought Leadership and Analyst Meet


Our Clients
Latest Reports
- China Electric Appliance Rental Market (2026-2032) | Trends, Revenue, Growth, Challenges, Size, Value, Outlook, Pricing, Strategy, Insights, Restraints, segmentation, Companies, Investment Opportunities, Analysis, Demand, Drivers, Competition, Forecast, Share
- Chile Electric Appliance Rental Market (2026-2032) | Outlook, Competition, Drivers, Strategy, Revenue, Analysis, Value, Pricing, Restraints, Size, Demand, Share, Growth, Forecast, Challenges, Insights, Investment Opportunities, Companies, Trends, segmentation
- Cambodia Electric Appliance Rental Market (2026-2032) | Companies, Analysis, Restraints, Pricing, Insights, Challenges, Outlook, Strategy, Forecast, Trends, Competition, Value, Revenue, Investment Opportunities, segmentation, Drivers, Size, Demand, Growth, Share
- Brazil Electric Appliance Rental Market (2026-2032) | Revenue, Strategy, Forecast, Companies, segmentation, Competition, Size, Investment Opportunities, Pricing, Restraints, Outlook, Challenges, Analysis, Drivers, Value, Demand, Insights, Trends, Growth, Share
- Bangladesh Electric Appliance Rental Market (2026-2032) | Drivers, Forecast, Investment Opportunities, Strategy, Insights, Demand, Challenges, Outlook, Trends, Competition, Value, Revenue, Size, Pricing, Analysis, Companies, Restraints, segmentation, Share, Growth
- Bahrain Electric Appliance Rental Market (2026-2032) | Outlook, Size, Competition, Restraints, Drivers, Value, Trends, Investment Opportunities, Insights, Forecast, Revenue, Strategy, Growth, Share, Demand, Analysis, Challenges, Companies, segmentation, Pricing
- Azerbaijan Electric Appliance Rental Market (2026-2032) | Trends, Investment Opportunities, Restraints, Insights, Strategy, Competition, Value, Growth, Demand, Drivers, Analysis, Forecast, Size, Share, Outlook, segmentation, Pricing, Challenges, Revenue, Companies
- Australia Electric Appliance Rental Market (2026-2032) | Challenges, Restraints, Forecast, Demand, Size, Competition, Pricing, Investment Opportunities, Revenue, Trends, Drivers, Growth, Outlook, Analysis, Strategy, Value, segmentation, Insights, Companies, Share
- Argentina Electric Appliance Rental Market (2026-2032) | Growth, Trends, Insights, Outlook, Forecast, Size, Drivers, Analysis, Restraints, Challenges, Share, Revenue, Investment Opportunities, Strategy, Demand, Value, Companies, segmentation, Competition, Pricing
- Algeria Electric Appliance Rental Market (2026-2032) | Share, Size, Value, Strategy, Competition, Outlook, Challenges, Companies, Trends, Pricing, Insights, Forecast, Investment Opportunities, Revenue, Growth, Restraints, segmentation, Analysis, Demand, Drivers
Industry Events and Analyst Meet

HIMTEX 2026

India Refining Summit 2026

India EV Show 2026

EV tech India Expo 2026

Auto Tech Asia 2026
Whitepaper
- Middle East & Africa Commercial Security Market Click here to view more.
- Middle East & Africa Fire Safety Systems & Equipment Market Click here to view more.
- GCC Drone Market Click here to view more.
- Middle East Lighting Fixture Market Click here to view more.
- GCC Physical & Perimeter Security Market Click here to view more.
6WResearch In News
- Doha a strategic location for EV manufacturing hub: IPA Qatar
- Demand for luxury TVs surging in the GCC, says Samsung
- Empowering Growth: The Thriving Journey of Bangladesh’s Cable Industry
- Demand for luxury TVs surging in the GCC, says Samsung
- Video call with a traditional healer? Once unthinkable, it’s now common in South Africa
- Intelligent Buildings To Smooth GCC’s Path To Net Zero