Nicaragua Process Oil Market (2026-2032) | Size, Industry, Revenue, Segmentation, Value, Trends, Companies, Outlook, Forecast, Analysis, Growth & Share
Market Forecast By Type (Aromatic, Paraffinic, Naphthenic, Non-carcinogenic), By Function (Extender Oil, Plasticizer, Solvent, Defoamer), By Production Technology (Convention Route, Gas to Liquid, Bio-based), By Application (Tire & Rubber, Polymer, Personal Care, Textile, Others) And Competitive Landscape
| Product Code: ETC5668919 | Publication Date: Nov 2023 | Updated Date: Mar 2026 | Product Type: Market Research Report | |
| Publisher: 6Wresearch | Author: Ravi Bhandari | No. of Pages: 60 | No. of Figures: 30 | No. of Tables: 5 |
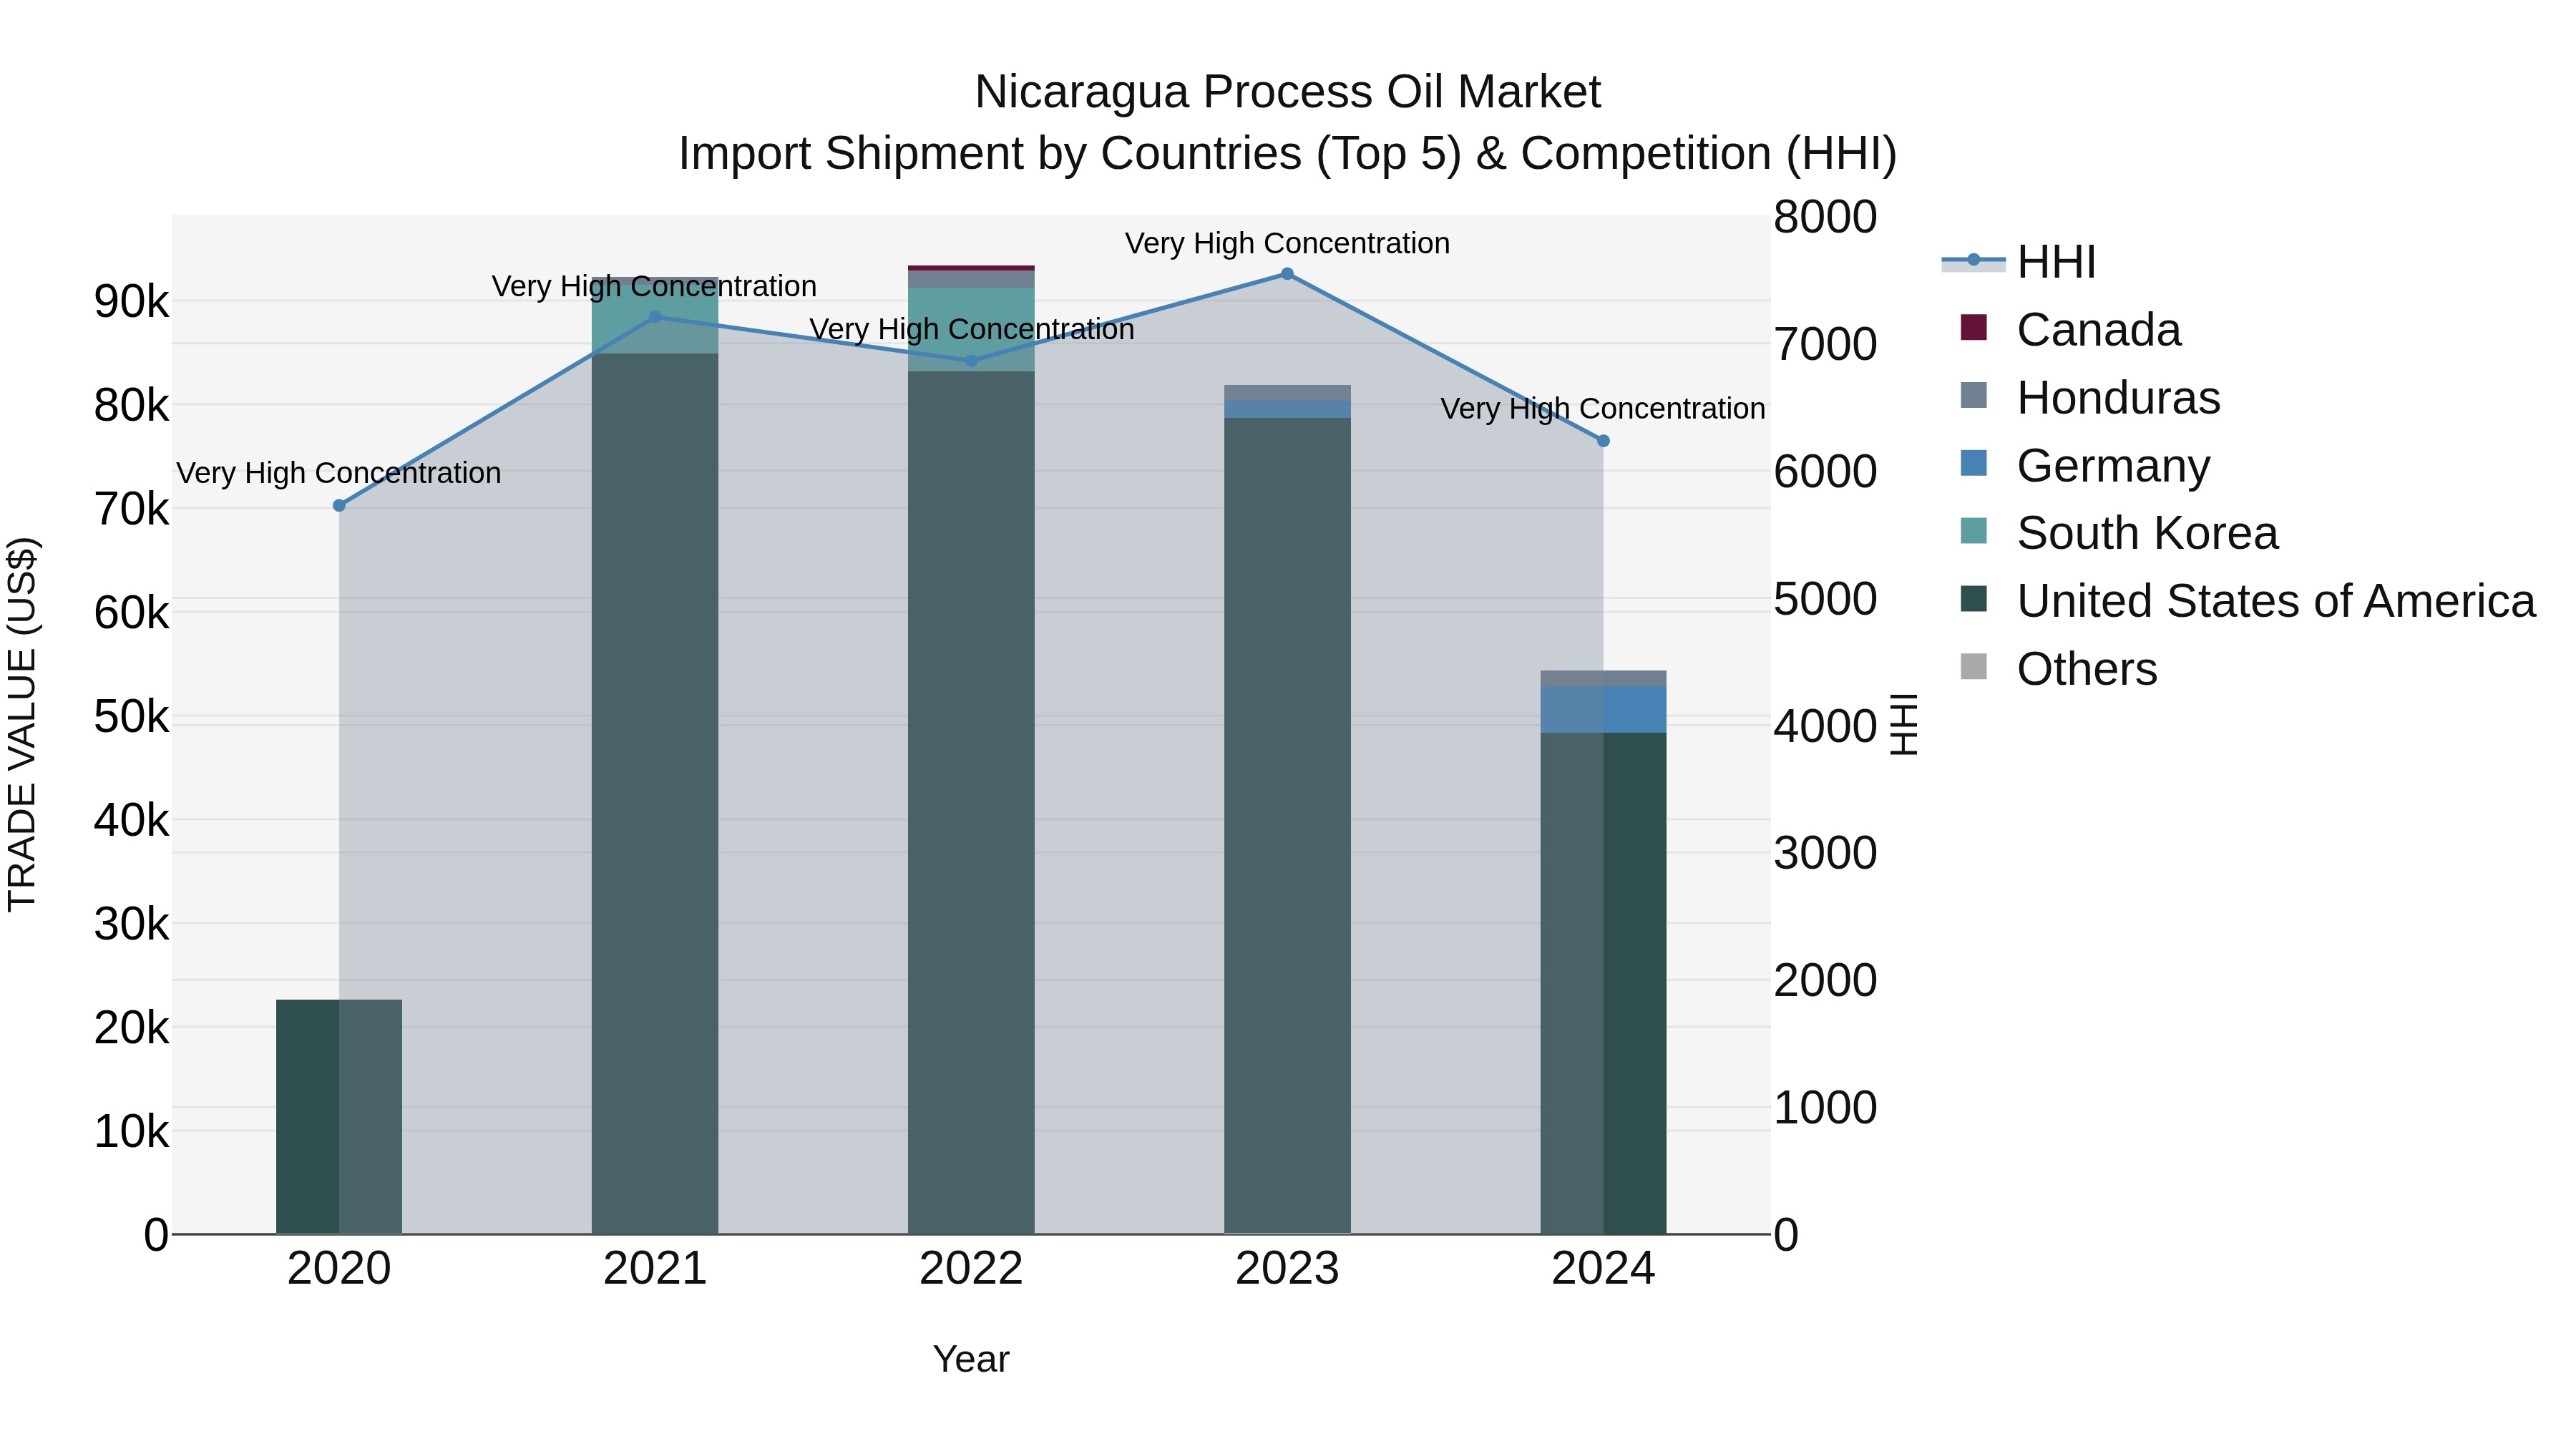
Nicaragua Process Oil Market: Top 5 Importing Countries and Market Competition (HHI) Analysis
In 2024, Nicaragua continued to heavily rely on process oil imports, with the United States, Germany, Honduras, Canada, and Japan being the top exporting countries. The high Herfindahl-Hirschman Index (HHI) suggests a concentrated market, potentially leading to supply chain vulnerabilities. Despite a strong compound annual growth rate (CAGR) of 24.46% from 2020 to 2024, the negative growth rate of -33.62% from 2023 to 2024 raises concerns about potential disruptions in the market. Monitoring market dynamics and diversifying import sources may be crucial for Nicaragua`s energy security and stability.
Key Highlights of the Report:
- Nicaragua Process Oil Market Outlook
- Market Size of Nicaragua Process Oil Market, 2025
- Forecast of Nicaragua Process Oil Market, 2032
- Historical Data and Forecast of Nicaragua Process Oil Revenues & Volume for the Period 2022 - 2032F
- Nicaragua Process Oil Market Trend Evolution
- Nicaragua Process Oil Market Drivers and Challenges
- Nicaragua Process Oil Price Trends
- Nicaragua Process Oil Porter`s Five Forces
- Nicaragua Process Oil Industry Life Cycle
- Historical Data and Forecast of Nicaragua Process Oil Market Revenues & Volume By Type for the Period 2022 - 2032F
- Historical Data and Forecast of Nicaragua Process Oil Market Revenues & Volume By Aromatic for the Period 2022 - 2032F
- Historical Data and Forecast of Nicaragua Process Oil Market Revenues & Volume By Paraffinic for the Period 2022 - 2032F
- Historical Data and Forecast of Nicaragua Process Oil Market Revenues & Volume By Naphthenic for the Period 2022 - 2032F
- Historical Data and Forecast of Nicaragua Process Oil Market Revenues & Volume By Non-carcinogenic for the Period 2022 - 2032F
- Historical Data and Forecast of Nicaragua Process Oil Market Revenues & Volume By Function for the Period 2022 - 2032F
- Historical Data and Forecast of Nicaragua Process Oil Market Revenues & Volume By Extender Oil for the Period 2022 - 2032F
- Historical Data and Forecast of Nicaragua Process Oil Market Revenues & Volume By Plasticizer for the Period 2022 - 2032F
- Historical Data and Forecast of Nicaragua Process Oil Market Revenues & Volume By Solvent for the Period 2022 - 2032F
- Historical Data and Forecast of Nicaragua Process Oil Market Revenues & Volume By Defoamer for the Period 2022 - 2032F
- Historical Data and Forecast of Nicaragua Process Oil Market Revenues & Volume By Production Technology for the Period 2022 - 2032F
- Historical Data and Forecast of Nicaragua Process Oil Market Revenues & Volume By Convention Route for the Period 2022 - 2032F
- Historical Data and Forecast of Nicaragua Process Oil Market Revenues & Volume By Gas to Liquid for the Period 2022 - 2032F
- Historical Data and Forecast of Nicaragua Process Oil Market Revenues & Volume By Bio-based for the Period 2022 - 2032F
- Historical Data and Forecast of Nicaragua Process Oil Market Revenues & Volume By Application for the Period 2022 - 2032F
- Historical Data and Forecast of Nicaragua Process Oil Market Revenues & Volume By Tire & Rubber for the Period 2022 - 2032F
- Historical Data and Forecast of Nicaragua Process Oil Market Revenues & Volume By Polymer for the Period 2022 - 2032F
- Historical Data and Forecast of Nicaragua Process Oil Market Revenues & Volume By Personal Care for the Period 2022 - 2032F
- Historical Data and Forecast of Nicaragua Process Oil Market Revenues & Volume By Textile for the Period 2022 - 2032F
- Historical Data and Forecast of Nicaragua Process Oil Market Revenues & Volume By Others for the Period 2022 - 2032F
- Nicaragua Process Oil Import Export Trade Statistics
- Market Opportunity Assessment By Type
- Market Opportunity Assessment By Function
- Market Opportunity Assessment By Production Technology
- Market Opportunity Assessment By Application
- Nicaragua Process Oil Top Companies Market Share
- Nicaragua Process Oil Competitive Benchmarking By Technical and Operational Parameters
- Nicaragua Process Oil Company Profiles
- Nicaragua Process Oil Key Strategic Recommendations
Frequently Asked Questions About the Market Study (FAQs):
6Wresearch actively monitors the Nicaragua Process Oil Market and publishes its comprehensive annual report, highlighting emerging trends, growth drivers, revenue analysis, and forecast outlook. Our insights help businesses to make data-backed strategic decisions with ongoing market dynamics. Our analysts track relevent industries related to the Nicaragua Process Oil Market, allowing our clients with actionable intelligence and reliable forecasts tailored to emerging regional needs.
Yes, we provide customisation as per your requirements. To learn more, feel free to contact us on sales@6wresearch.com
1 Executive Summary |
2 Introduction |
2.1 Key Highlights of the Report |
2.2 Report Description |
2.3 Market Scope & Segmentation |
2.4 Research Methodology |
2.5 Assumptions |
3 Nicaragua Process Oil Market Overview |
3.1 Nicaragua Country Macro Economic Indicators |
3.2 Nicaragua Process Oil Market Revenues & Volume, 2022 & 2032F |
3.3 Nicaragua Process Oil Market - Industry Life Cycle |
3.4 Nicaragua Process Oil Market - Porter's Five Forces |
3.5 Nicaragua Process Oil Market Revenues & Volume Share, By Type, 2022 & 2032F |
3.6 Nicaragua Process Oil Market Revenues & Volume Share, By Function, 2022 & 2032F |
3.7 Nicaragua Process Oil Market Revenues & Volume Share, By Production Technology, 2022 & 2032F |
3.8 Nicaragua Process Oil Market Revenues & Volume Share, By Application, 2022 & 2032F |
4 Nicaragua Process Oil Market Dynamics |
4.1 Impact Analysis |
4.2 Market Drivers |
4.2.1 Increasing demand for processed oils in Nicaragua due to changing dietary habits and lifestyle choices. |
4.2.2 Growth in the food and beverage industry in Nicaragua, leading to higher consumption of processed oils. |
4.2.3 Rising awareness about the health benefits of specific types of processed oils, driving market growth. |
4.3 Market Restraints |
4.3.1 Fluctuating prices of raw materials used in the production of processed oils, impacting profit margins. |
4.3.2 Regulatory challenges and compliance requirements affecting the production and distribution of processed oils in Nicaragua. |
5 Nicaragua Process Oil Market Trends |
6 Nicaragua Process Oil Market Segmentations |
6.1 Nicaragua Process Oil Market, By Type |
6.1.1 Overview and Analysis |
6.1.2 Nicaragua Process Oil Market Revenues & Volume, By Aromatic, 2022 - 2032F |
6.1.3 Nicaragua Process Oil Market Revenues & Volume, By Paraffinic, 2022 - 2032F |
6.1.4 Nicaragua Process Oil Market Revenues & Volume, By Naphthenic, 2022 - 2032F |
6.1.5 Nicaragua Process Oil Market Revenues & Volume, By Non-carcinogenic, 2022 - 2032F |
6.2 Nicaragua Process Oil Market, By Function |
6.2.1 Overview and Analysis |
6.2.2 Nicaragua Process Oil Market Revenues & Volume, By Extender Oil, 2022 - 2032F |
6.2.3 Nicaragua Process Oil Market Revenues & Volume, By Plasticizer, 2022 - 2032F |
6.2.4 Nicaragua Process Oil Market Revenues & Volume, By Solvent, 2022 - 2032F |
6.2.5 Nicaragua Process Oil Market Revenues & Volume, By Defoamer, 2022 - 2032F |
6.3 Nicaragua Process Oil Market, By Production Technology |
6.3.1 Overview and Analysis |
6.3.2 Nicaragua Process Oil Market Revenues & Volume, By Convention Route, 2022 - 2032F |
6.3.3 Nicaragua Process Oil Market Revenues & Volume, By Gas to Liquid, 2022 - 2032F |
6.3.4 Nicaragua Process Oil Market Revenues & Volume, By Bio-based, 2022 - 2032F |
6.4 Nicaragua Process Oil Market, By Application |
6.4.1 Overview and Analysis |
6.4.2 Nicaragua Process Oil Market Revenues & Volume, By Tire & Rubber, 2022 - 2032F |
6.4.3 Nicaragua Process Oil Market Revenues & Volume, By Polymer, 2022 - 2032F |
6.4.4 Nicaragua Process Oil Market Revenues & Volume, By Personal Care, 2022 - 2032F |
6.4.5 Nicaragua Process Oil Market Revenues & Volume, By Textile, 2022 - 2032F |
6.4.6 Nicaragua Process Oil Market Revenues & Volume, By Others, 2022 - 2032F |
7 Nicaragua Process Oil Market Import-Export Trade Statistics |
7.1 Nicaragua Process Oil Market Export to Major Countries |
7.2 Nicaragua Process Oil Market Imports from Major Countries |
8 Nicaragua Process Oil Market Key Performance Indicators |
8.1 Consumer awareness and perception surveys measuring the understanding of health benefits associated with processed oils. |
8.2 Production efficiency metrics such as yield per batch and wastage percentages. |
8.3 Quality control measures including adherence to food safety standards and certifications. |
8.4 Market penetration rate of different types of processed oils in the Nicaraguan market. |
9 Nicaragua Process Oil Market - Opportunity Assessment |
9.1 Nicaragua Process Oil Market Opportunity Assessment, By Type, 2022 & 2032F |
9.2 Nicaragua Process Oil Market Opportunity Assessment, By Function, 2022 & 2032F |
9.3 Nicaragua Process Oil Market Opportunity Assessment, By Production Technology, 2022 & 2032F |
9.4 Nicaragua Process Oil Market Opportunity Assessment, By Application, 2022 & 2032F |
10 Nicaragua Process Oil Market - Competitive Landscape |
10.1 Nicaragua Process Oil Market Revenue Share, By Companies, 2025 |
10.2 Nicaragua Process Oil Market Competitive Benchmarking, By Operating and Technical Parameters |
11 Company Profiles |
12 Recommendations | 13 Disclaimer |
Export potential assessment - trade Analytics for 2030
Export potential enables firms to identify high-growth global markets with greater confidence by combining advanced trade intelligence with a structured quantitative methodology. The framework analyzes emerging demand trends and country-level import patterns while integrating macroeconomic and trade datasets such as GDP and population forecasts, bilateral import–export flows, tariff structures, elasticity differentials between developed and developing economies, geographic distance, and import demand projections. Using weighted trade values from 2020–2024 as the base period to project country-to-country export potential for 2030, these inputs are operationalized through calculated drivers such as gravity model parameters, tariff impact factors, and projected GDP per-capita growth. Through an analysis of hidden potentials, demand hotspots, and market conditions that are most favorable to success, this method enables firms to focus on target countries, maximize returns, and global expansion with data, backed by accuracy.
By factoring in the projected importer demand gap that is currently unmet and could be potential opportunity, it identifies the potential for the Exporter (Country) among 190 countries, against the general trade analysis, which identifies the biggest importer or exporter.
To discover high-growth global markets and optimize your business strategy:
Click Here
Pricing
- Single User License$ 1,995
- Department License$ 2,400
- Site License$ 3,120
- Global License$ 3,795

Search
Thought Leadership and Analyst Meet


Our Clients
Latest Reports
- Philippines Polyhydroxybutyrate-co-Hydroxyvalerate Market (2026-2032) | Trends, Insights, Challenges, Restraints, Competition, Size, Value, Forecast, Pricing, Share, Outlook, Revenue, Investment Opportunities, Strategy, Drivers, Demand, Growth, segmentation, Analysis, Companies
- Peru Polyhydroxybutyrate-co-Hydroxyvalerate Market (2026-2032) | Growth, Demand, Challenges, Share, Trends, Analysis, Pricing, Investment Opportunities, Drivers, Value, Forecast, Competition, Size, Companies, Insights, Outlook, Restraints, segmentation, Revenue, Strategy
- Pakistan Polyhydroxybutyrate-co-Hydroxyvalerate Market (2026-2032) | Restraints, segmentation, Pricing, Forecast, Share, Strategy, Competition, Trends, Insights, Drivers, Challenges, Growth, Revenue, Outlook, Value, Investment Opportunities, Companies, Size, Analysis, Demand
- Oman Polyhydroxybutyrate-co-Hydroxyvalerate Market (2026-2032) | Drivers, segmentation, Insights, Competition, Pricing, Outlook, Size, Revenue, Challenges, Forecast, Analysis, Growth, Value, Share, Trends, Investment Opportunities, Strategy, Restraints, Companies, Demand
- Nigeria Polyhydroxybutyrate-co-Hydroxyvalerate Market (2026-2032) | Value, Investment Opportunities, Analysis, Revenue, Restraints, Pricing, Outlook, Competition, Demand, Growth, Forecast, Companies, Trends, Challenges, segmentation, Drivers, Insights, Share, Size, Strategy
- Nepal Polyhydroxybutyrate-co-Hydroxyvalerate Market (2026-2032) | Insights, Analysis, Drivers, Share, Revenue, Demand, segmentation, Investment Opportunities, Competition, Forecast, Growth, Pricing, Companies, Strategy, Trends, Restraints, Challenges, Outlook, Size, Value
- Myanmar Polyhydroxybutyrate-co-Hydroxyvalerate Market (2026-2032) | Outlook, Revenue, Strategy, Restraints, Drivers, segmentation, Share, Forecast, Competition, Insights, Growth, Pricing, Size, Demand, Value, Companies, Trends, Challenges, Investment Opportunities, Analysis
- Morocco Polyhydroxybutyrate-co-Hydroxyvalerate Market (2026-2032) | Outlook, Investment Opportunities, Restraints, Strategy, Forecast, Challenges, Drivers, Growth, Companies, segmentation, Trends, Size, Competition, Revenue, Demand, Insights, Share, Analysis, Value, Pricing
- Mexico Polyhydroxybutyrate-co-Hydroxyvalerate Market (2026-2032) | Size, Drivers, Outlook, Share, Strategy, Growth, Pricing, Challenges, Companies, Demand, Value, Investment Opportunities, Restraints, Trends, Forecast, segmentation, Analysis, Insights, Competition, Revenue
- Malaysia Polyhydroxybutyrate-co-Hydroxyvalerate Market (2026-2032) | Share, segmentation, Size, Companies, Analysis, Insights, Forecast, Value, Revenue, Drivers, Restraints, Challenges, Investment Opportunities, Trends, Competition, Strategy, Demand, Growth, Outlook, Pricing
Industry Events and Analyst Meet

HIMTEX 2026

India Refining Summit 2026

India EV Show 2026

EV tech India Expo 2026

Auto Tech Asia 2026
Whitepaper
- Middle East & Africa Commercial Security Market Click here to view more.
- Middle East & Africa Fire Safety Systems & Equipment Market Click here to view more.
- GCC Drone Market Click here to view more.
- Middle East Lighting Fixture Market Click here to view more.
- GCC Physical & Perimeter Security Market Click here to view more.
6WResearch In News
- Doha a strategic location for EV manufacturing hub: IPA Qatar
- Demand for luxury TVs surging in the GCC, says Samsung
- Empowering Growth: The Thriving Journey of Bangladesh’s Cable Industry
- Demand for luxury TVs surging in the GCC, says Samsung
- Video call with a traditional healer? Once unthinkable, it’s now common in South Africa
- Intelligent Buildings To Smooth GCC’s Path To Net Zero