Niger Liquid Particle Counters Market (2026-2032) | Analysis, Forecast, Growth, Segmentation, Size & Revenue, Value, Outlook, Companies, Industry, Competitive Landscape, Trends, Share
Market Forecast By Type (Airborne Particle Counters, Liquid Particle Counters, Others), By Technology (Online Particle Counters, Offline Particle Counters), By Liquid Type (Water and Aqueous Fluids, Oil and Hydraulic Fluids), By Components (Device, Software, Services), By Technique (Light Obscuration, Light Scattering), By End-User (Life Sciences and Medical Device Industry, Semiconductor Industry, Automotive Industry, Aerospace Industry, Food and Beverage Industry, Others) And Competitive Landscape
| Product Code: ETC8606678 | Publication Date: Sep 2024 | Updated Date: Apr 2026 | Product Type: Market Research Report | |
| Publisher: 6Wresearch | Author: Dhaval Chaurasia | No. of Pages: 75 | No. of Figures: 35 | No. of Tables: 20 |
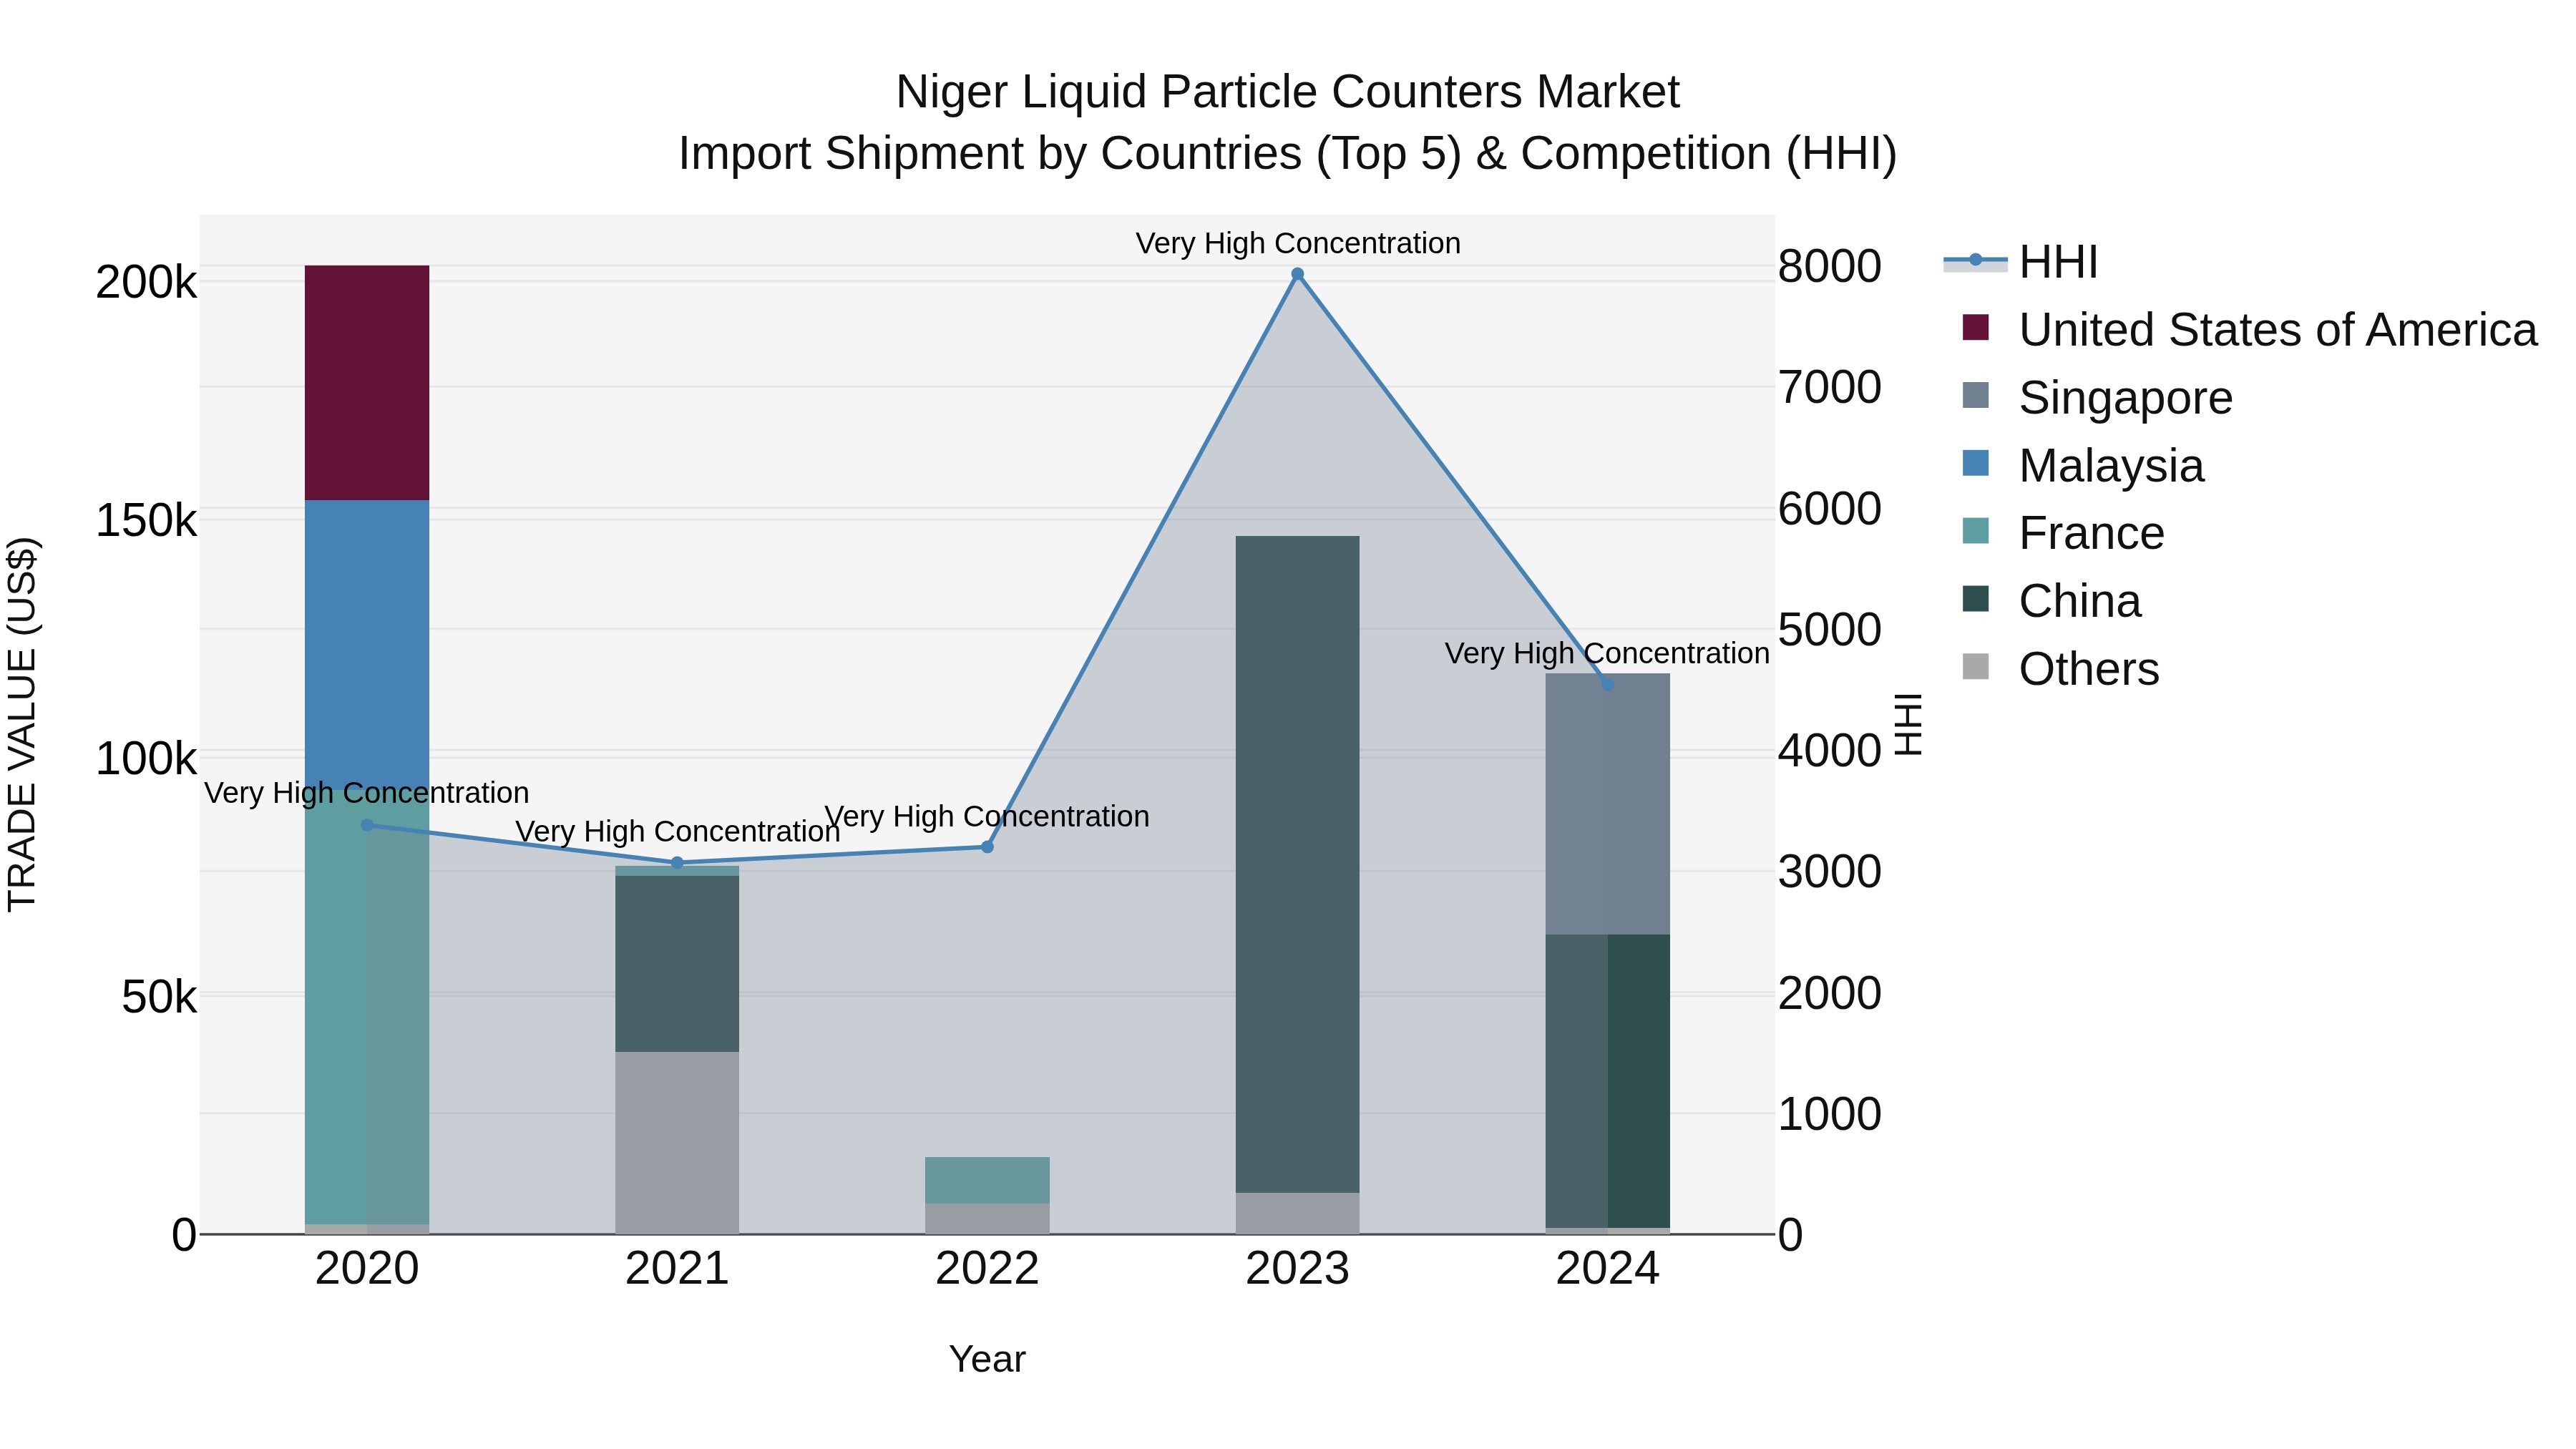
Niger Liquid Particle Counters Market: Top 5 Importing Countries and Market Competition (HHI) Analysis
Niger continues to rely on imports of liquid particle counters, with top exporting countries in 2024 being China, Singapore, Tunisia, Taiwan, and France. The high Herfindahl-Hirschman Index (HHI) indicates a concentrated market. However, the industry experienced a significant decline with a compound annual growth rate (CAGR) of -12.76% from 2020 to 2024. The negative growth rate of -19.64% in 2024 highlights ongoing challenges in the market. Stakeholders should closely monitor these trends to make informed decisions and adapt to the changing market dynamics.
Key Highlights of the Report:
- Niger Liquid Particle Counters Market Outlook
- Market Size of Niger Liquid Particle Counters Market, 2025
- Forecast of Niger Liquid Particle Counters Market, 2032
- Historical Data and Forecast of Niger Liquid Particle Counters Revenues & Volume for the Period 2022 - 2032
- Niger Liquid Particle Counters Market Trend Evolution
- Niger Liquid Particle Counters Market Drivers and Challenges
- Niger Liquid Particle Counters Price Trends
- Niger Liquid Particle Counters Porter's Five Forces
- Niger Liquid Particle Counters Industry Life Cycle
- Historical Data and Forecast of Niger Liquid Particle Counters Market Revenues & Volume By Type for the Period 2022 - 2032
- Historical Data and Forecast of Niger Liquid Particle Counters Market Revenues & Volume By Airborne Particle Counters for the Period 2022 - 2032
- Historical Data and Forecast of Niger Liquid Particle Counters Market Revenues & Volume By Liquid Particle Counters for the Period 2022 - 2032
- Historical Data and Forecast of Niger Liquid Particle Counters Market Revenues & Volume By Others for the Period 2022 - 2032
- Historical Data and Forecast of Niger Liquid Particle Counters Market Revenues & Volume By Technology for the Period 2022 - 2032
- Historical Data and Forecast of Niger Liquid Particle Counters Market Revenues & Volume By Online Particle Counters for the Period 2022 - 2032
- Historical Data and Forecast of Niger Liquid Particle Counters Market Revenues & Volume By Offline Particle Counters for the Period 2022 - 2032
- Historical Data and Forecast of Niger Liquid Particle Counters Market Revenues & Volume By Liquid Type for the Period 2022 - 2032
- Historical Data and Forecast of Niger Liquid Particle Counters Market Revenues & Volume By Water and Aqueous Fluids for the Period 2022 - 2032
- Historical Data and Forecast of Niger Liquid Particle Counters Market Revenues & Volume By Oil and Hydraulic Fluids for the Period 2022 - 2032
- Historical Data and Forecast of Niger Liquid Particle Counters Market Revenues & Volume By Components for the Period 2022 - 2032
- Historical Data and Forecast of Niger Liquid Particle Counters Market Revenues & Volume By Device for the Period 2022 - 2032
- Historical Data and Forecast of Niger Liquid Particle Counters Market Revenues & Volume By Software for the Period 2022 - 2032
- Historical Data and Forecast of Niger Liquid Particle Counters Market Revenues & Volume By Services for the Period 2022 - 2032
- Historical Data and Forecast of Niger Liquid Particle Counters Market Revenues & Volume By Technique for the Period 2022 - 2032
- Historical Data and Forecast of Niger Liquid Particle Counters Market Revenues & Volume By Light Obscuration for the Period 2022 - 2032
- Historical Data and Forecast of Niger Liquid Particle Counters Market Revenues & Volume By Light Scattering for the Period 2022 - 2032
- Historical Data and Forecast of Niger Liquid Particle Counters Market Revenues & Volume By End-User for the Period 2022 - 2032
- Historical Data and Forecast of Niger Liquid Particle Counters Market Revenues & Volume By Life Sciences and Medical Device Industry for the Period 2022 - 2032
- Historical Data and Forecast of Niger Liquid Particle Counters Market Revenues & Volume By Semiconductor Industry for the Period 2022 - 2032
- Historical Data and Forecast of Niger Liquid Particle Counters Market Revenues & Volume By Automotive Industry for the Period 2022 - 2032
- Historical Data and Forecast of Niger Liquid Particle Counters Market Revenues & Volume By Aerospace Industry for the Period 2022 - 2032
- Historical Data and Forecast of Niger Liquid Particle Counters Market Revenues & Volume By Food and Beverage Industry for the Period 2022 - 2032
- Historical Data and Forecast of Niger Liquid Particle Counters Market Revenues & Volume By Others for the Period 2022 - 2032
- Niger Liquid Particle Counters Import Export Trade Statistics
- Market Opportunity Assessment By Type
- Market Opportunity Assessment By Technology
- Market Opportunity Assessment By Liquid Type
- Market Opportunity Assessment By Components
- Market Opportunity Assessment By Technique
- Market Opportunity Assessment By End-User
- Niger Liquid Particle Counters Top Companies Market Share
- Niger Liquid Particle Counters Competitive Benchmarking By Technical and Operational Parameters
- Niger Liquid Particle Counters Company Profiles
- Niger Liquid Particle Counters Key Strategic Recommendations
Frequently Asked Questions About the Market Study (FAQs):
6Wresearch actively monitors the Niger Liquid Particle Counters Market and publishes its comprehensive annual report, highlighting emerging trends, growth drivers, revenue analysis, and forecast outlook. Our insights help businesses to make data-backed strategic decisions with ongoing market dynamics. Our analysts track relevent industries related to the Niger Liquid Particle Counters Market, allowing our clients with actionable intelligence and reliable forecasts tailored to emerging regional needs.
Yes, we provide customisation as per your requirements. To learn more, feel free to contact us on sales@6wresearch.com
1 Executive Summary |
2 Introduction |
2.1 Key Highlights of the Report |
2.2 Report Description |
2.3 Market Scope & Segmentation |
2.4 Research Methodology |
2.5 Assumptions |
3 Niger Liquid Particle Counters Market Overview |
3.1 Niger Country Macro Economic Indicators |
3.2 Niger Liquid Particle Counters Market Revenues & Volume, 2022 & 2032F |
3.3 Niger Liquid Particle Counters Market - Industry Life Cycle |
3.4 Niger Liquid Particle Counters Market - Porter's Five Forces |
3.5 Niger Liquid Particle Counters Market Revenues & Volume Share, By Type, 2022 & 2032F |
3.6 Niger Liquid Particle Counters Market Revenues & Volume Share, By Technology, 2022 & 2032F |
3.7 Niger Liquid Particle Counters Market Revenues & Volume Share, By Liquid Type, 2022 & 2032F |
3.8 Niger Liquid Particle Counters Market Revenues & Volume Share, By Components, 2022 & 2032F |
3.9 Niger Liquid Particle Counters Market Revenues & Volume Share, By Technique, 2022 & 2032F |
3.10 Niger Liquid Particle Counters Market Revenues & Volume Share, By End-User, 2022 & 2032F |
4 Niger Liquid Particle Counters Market Dynamics |
4.1 Impact Analysis |
4.2 Market Drivers |
4.2.1 Increasing demand for cleanroom monitoring in industries such as pharmaceuticals, healthcare, and electronics, which require liquid particle counters for quality control. |
4.2.2 Stringent regulations and standards related to cleanroom monitoring and contamination control drive the adoption of liquid particle counters in Niger. |
4.2.3 Technological advancements leading to the development of more accurate and efficient liquid particle counters, attracting customers looking for reliable solutions. |
4.3 Market Restraints |
4.3.1 High initial investment costs associated with liquid particle counters may deter small and medium-sized enterprises from investing in this technology. |
4.3.2 Lack of awareness and understanding about the benefits and importance of liquid particle counters among potential end-users could limit market growth. |
4.3.3 Dependence on imports for advanced liquid particle counting technology may lead to supply chain disruptions and impact market growth. |
5 Niger Liquid Particle Counters Market Trends |
6 Niger Liquid Particle Counters Market, By Types |
6.1 Niger Liquid Particle Counters Market, By Type |
6.1.1 Overview and Analysis |
6.1.2 Niger Liquid Particle Counters Market Revenues & Volume, By Type, 2022 - 2032F |
6.1.3 Niger Liquid Particle Counters Market Revenues & Volume, By Airborne Particle Counters, 2022 - 2032F |
6.1.4 Niger Liquid Particle Counters Market Revenues & Volume, By Liquid Particle Counters, 2022 - 2032F |
6.1.5 Niger Liquid Particle Counters Market Revenues & Volume, By Others, 2022 - 2032F |
6.2 Niger Liquid Particle Counters Market, By Technology |
6.2.1 Overview and Analysis |
6.2.2 Niger Liquid Particle Counters Market Revenues & Volume, By Online Particle Counters, 2022 - 2032F |
6.2.3 Niger Liquid Particle Counters Market Revenues & Volume, By Offline Particle Counters, 2022 - 2032F |
6.3 Niger Liquid Particle Counters Market, By Liquid Type |
6.3.1 Overview and Analysis |
6.3.2 Niger Liquid Particle Counters Market Revenues & Volume, By Water and Aqueous Fluids, 2022 - 2032F |
6.3.3 Niger Liquid Particle Counters Market Revenues & Volume, By Oil and Hydraulic Fluids, 2022 - 2032F |
6.4 Niger Liquid Particle Counters Market, By Components |
6.4.1 Overview and Analysis |
6.4.2 Niger Liquid Particle Counters Market Revenues & Volume, By Device, 2022 - 2032F |
6.4.3 Niger Liquid Particle Counters Market Revenues & Volume, By Software, 2022 - 2032F |
6.4.4 Niger Liquid Particle Counters Market Revenues & Volume, By Services, 2022 - 2032F |
6.5 Niger Liquid Particle Counters Market, By Technique |
6.5.1 Overview and Analysis |
6.5.2 Niger Liquid Particle Counters Market Revenues & Volume, By Light Obscuration, 2022 - 2032F |
6.5.3 Niger Liquid Particle Counters Market Revenues & Volume, By Light Scattering, 2022 - 2032F |
6.6 Niger Liquid Particle Counters Market, By End-User |
6.6.1 Overview and Analysis |
6.6.2 Niger Liquid Particle Counters Market Revenues & Volume, By Life Sciences and Medical Device Industry, 2022 - 2032F |
6.6.3 Niger Liquid Particle Counters Market Revenues & Volume, By Semiconductor Industry, 2022 - 2032F |
6.6.4 Niger Liquid Particle Counters Market Revenues & Volume, By Automotive Industry, 2022 - 2032F |
6.6.5 Niger Liquid Particle Counters Market Revenues & Volume, By Aerospace Industry, 2022 - 2032F |
6.6.6 Niger Liquid Particle Counters Market Revenues & Volume, By Food and Beverage Industry, 2022 - 2032F |
6.6.7 Niger Liquid Particle Counters Market Revenues & Volume, By Others, 2022 - 2032F |
7 Niger Liquid Particle Counters Market Import-Export Trade Statistics |
7.1 Niger Liquid Particle Counters Market Export to Major Countries |
7.2 Niger Liquid Particle Counters Market Imports from Major Countries |
8 Niger Liquid Particle Counters Market Key Performance Indicators |
8.1 Calibration frequency: Regular calibration of liquid particle counters indicates their accuracy and reliability, impacting customer satisfaction and market growth. |
8.2 Adoption rate in key industries: Tracking the rate at which industries such as pharmaceuticals, healthcare, and electronics adopt liquid particle counters can indicate market penetration and potential growth areas. |
8.3 Maintenance cost trends: Monitoring trends in maintenance costs for liquid particle counters can provide insights into product efficiency, durability, and overall market demand. |
9 Niger Liquid Particle Counters Market - Opportunity Assessment |
9.1 Niger Liquid Particle Counters Market Opportunity Assessment, By Type, 2022 & 2032F |
9.2 Niger Liquid Particle Counters Market Opportunity Assessment, By Technology, 2022 & 2032F |
9.3 Niger Liquid Particle Counters Market Opportunity Assessment, By Liquid Type, 2022 & 2032F |
9.4 Niger Liquid Particle Counters Market Opportunity Assessment, By Components, 2022 & 2032F |
9.5 Niger Liquid Particle Counters Market Opportunity Assessment, By Technique, 2022 & 2032F |
9.6 Niger Liquid Particle Counters Market Opportunity Assessment, By End-User, 2022 & 2032F |
10 Niger Liquid Particle Counters Market - Competitive Landscape |
10.1 Niger Liquid Particle Counters Market Revenue Share, By Companies, 2025 |
10.2 Niger Liquid Particle Counters Market Competitive Benchmarking, By Operating and Technical Parameters |
11 Company Profiles |
12 Recommendations |
13 Disclaimer |
Export potential assessment - trade Analytics for 2030
Export potential enables firms to identify high-growth global markets with greater confidence by combining advanced trade intelligence with a structured quantitative methodology. The framework analyzes emerging demand trends and country-level import patterns while integrating macroeconomic and trade datasets such as GDP and population forecasts, bilateral import–export flows, tariff structures, elasticity differentials between developed and developing economies, geographic distance, and import demand projections. Using weighted trade values from 2020–2024 as the base period to project country-to-country export potential for 2030, these inputs are operationalized through calculated drivers such as gravity model parameters, tariff impact factors, and projected GDP per-capita growth. Through an analysis of hidden potentials, demand hotspots, and market conditions that are most favorable to success, this method enables firms to focus on target countries, maximize returns, and global expansion with data, backed by accuracy.
By factoring in the projected importer demand gap that is currently unmet and could be potential opportunity, it identifies the potential for the Exporter (Country) among 190 countries, against the general trade analysis, which identifies the biggest importer or exporter.
To discover high-growth global markets and optimize your business strategy:
Click Here
Pricing
- Single User License$ 1,995
- Department License$ 2,400
- Site License$ 3,120
- Global License$ 3,795

Search
Thought Leadership and Analyst Meet


Our Clients
Latest Reports
- Philippines Polyhydroxybutyrate-co-Hydroxyvalerate Market (2026-2032) | Trends, Insights, Challenges, Restraints, Competition, Size, Value, Forecast, Pricing, Share, Outlook, Revenue, Investment Opportunities, Strategy, Drivers, Demand, Growth, segmentation, Analysis, Companies
- Peru Polyhydroxybutyrate-co-Hydroxyvalerate Market (2026-2032) | Growth, Demand, Challenges, Share, Trends, Analysis, Pricing, Investment Opportunities, Drivers, Value, Forecast, Competition, Size, Companies, Insights, Outlook, Restraints, segmentation, Revenue, Strategy
- Pakistan Polyhydroxybutyrate-co-Hydroxyvalerate Market (2026-2032) | Restraints, segmentation, Pricing, Forecast, Share, Strategy, Competition, Trends, Insights, Drivers, Challenges, Growth, Revenue, Outlook, Value, Investment Opportunities, Companies, Size, Analysis, Demand
- Oman Polyhydroxybutyrate-co-Hydroxyvalerate Market (2026-2032) | Drivers, segmentation, Insights, Competition, Pricing, Outlook, Size, Revenue, Challenges, Forecast, Analysis, Growth, Value, Share, Trends, Investment Opportunities, Strategy, Restraints, Companies, Demand
- Nigeria Polyhydroxybutyrate-co-Hydroxyvalerate Market (2026-2032) | Value, Investment Opportunities, Analysis, Revenue, Restraints, Pricing, Outlook, Competition, Demand, Growth, Forecast, Companies, Trends, Challenges, segmentation, Drivers, Insights, Share, Size, Strategy
- Nepal Polyhydroxybutyrate-co-Hydroxyvalerate Market (2026-2032) | Insights, Analysis, Drivers, Share, Revenue, Demand, segmentation, Investment Opportunities, Competition, Forecast, Growth, Pricing, Companies, Strategy, Trends, Restraints, Challenges, Outlook, Size, Value
- Myanmar Polyhydroxybutyrate-co-Hydroxyvalerate Market (2026-2032) | Outlook, Revenue, Strategy, Restraints, Drivers, segmentation, Share, Forecast, Competition, Insights, Growth, Pricing, Size, Demand, Value, Companies, Trends, Challenges, Investment Opportunities, Analysis
- Morocco Polyhydroxybutyrate-co-Hydroxyvalerate Market (2026-2032) | Outlook, Investment Opportunities, Restraints, Strategy, Forecast, Challenges, Drivers, Growth, Companies, segmentation, Trends, Size, Competition, Revenue, Demand, Insights, Share, Analysis, Value, Pricing
- Mexico Polyhydroxybutyrate-co-Hydroxyvalerate Market (2026-2032) | Size, Drivers, Outlook, Share, Strategy, Growth, Pricing, Challenges, Companies, Demand, Value, Investment Opportunities, Restraints, Trends, Forecast, segmentation, Analysis, Insights, Competition, Revenue
- Malaysia Polyhydroxybutyrate-co-Hydroxyvalerate Market (2026-2032) | Share, segmentation, Size, Companies, Analysis, Insights, Forecast, Value, Revenue, Drivers, Restraints, Challenges, Investment Opportunities, Trends, Competition, Strategy, Demand, Growth, Outlook, Pricing
Industry Events and Analyst Meet

HIMTEX 2026

India Refining Summit 2026

India EV Show 2026

EV tech India Expo 2026

Auto Tech Asia 2026
Whitepaper
- Middle East & Africa Commercial Security Market Click here to view more.
- Middle East & Africa Fire Safety Systems & Equipment Market Click here to view more.
- GCC Drone Market Click here to view more.
- Middle East Lighting Fixture Market Click here to view more.
- GCC Physical & Perimeter Security Market Click here to view more.
6WResearch In News
- Doha a strategic location for EV manufacturing hub: IPA Qatar
- Demand for luxury TVs surging in the GCC, says Samsung
- Empowering Growth: The Thriving Journey of Bangladesh’s Cable Industry
- Demand for luxury TVs surging in the GCC, says Samsung
- Video call with a traditional healer? Once unthinkable, it’s now common in South Africa
- Intelligent Buildings To Smooth GCC’s Path To Net Zero