Niger Potable Water Tank Coatings Market (2026-2032) | Revenue, Supply, Companies, Opportunities, Challenges, Strategic Insights, Drivers, Industry, Consumer Insights, Restraints, Outlook, Share, Forecast, Investment Trends, Segments, Segmentation, Value, Strategy, Competitive, Pricing Analysis, Size, Trends, Growth, Competition, Demand, Analysis
Market Forecast By Coating Type (Epoxy, Polyurethane, Acrylic, Zinc-Rich, Others), By Application (Steel Tanks, Concrete Tanks, Underground Tanks, Overhead Tanks), By End Use Industry (Water Treatment, Municipal, Industrial, Residential), By Material Type (Organic, Inorganic, Hybrid, Others) And Competitive Landscape
| Product Code: ETC13125327 | Publication Date: Apr 2025 | Updated Date: Apr 2026 | Product Type: Market Research Report | |
| Publisher: 6Wresearch | Author: Sachin Kumar Rai | No. of Pages: 65 | No. of Figures: 34 | No. of Tables: 19 |
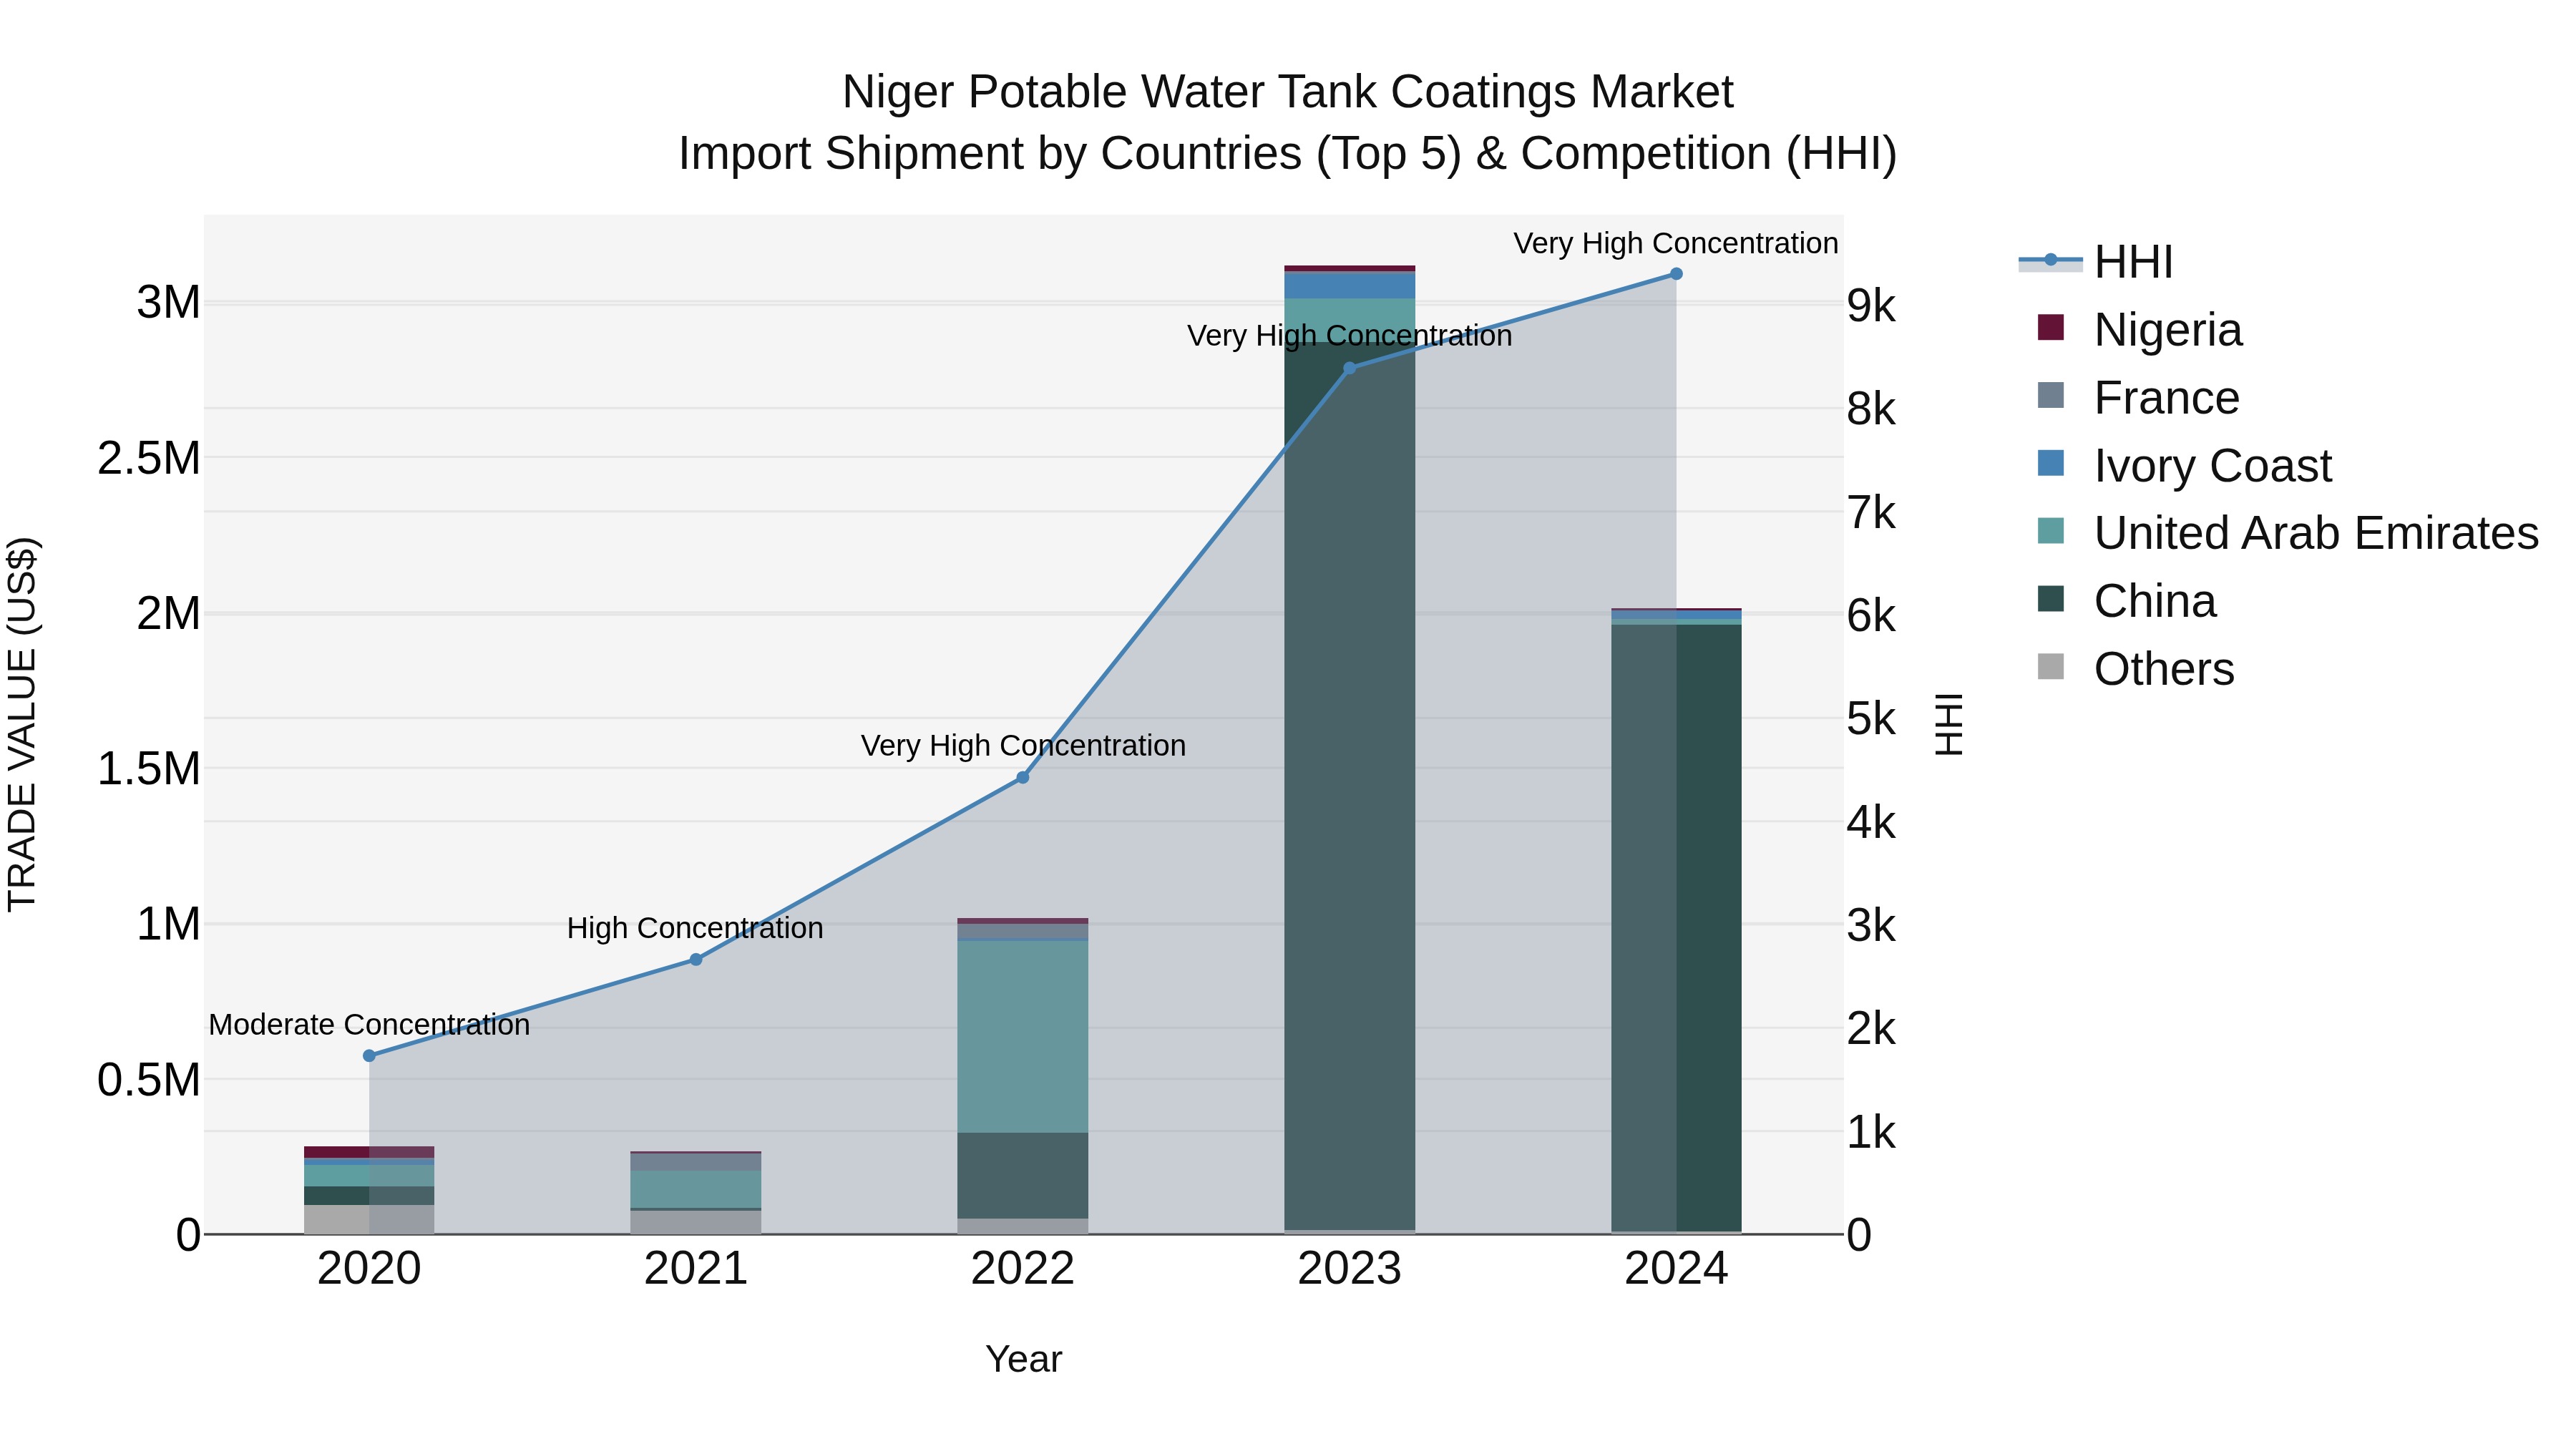
Niger Potable Water Tank Coatings Market: Top 5 Importing Countries and Market Competition (HHI) Analysis
Despite a steep decline in growth rate from 2023 to 2024, the potable water tank coatings import market in Niger saw impressive growth with a CAGR of 63.49% from 2020 to 2024. The top exporting countries to Niger in 2024 were China, Ivory Coast, United Arab Emirates, Nigeria, and Algeria, contributing to a high Herfindahl-Hirschman Index (HHI) indicating market concentration. This suggests a competitive landscape dominated by these key players. Niger`s reliance on these countries for potable water tank coatings underscores the importance of maintaining strong trade relationships to meet the country`s infrastructure needs.
Key Highlights of the Report:
- Niger Potable Water Tank Coatings Market Outlook
- Market Size of Niger Potable Water Tank Coatings Market, 2025
- Forecast of Niger Potable Water Tank Coatings Market, 2032
- Historical Data and Forecast of Niger Potable Water Tank Coatings Revenues & Volume for the Period 2022 - 2032F
- Niger Potable Water Tank Coatings Market Trend Evolution
- Niger Potable Water Tank Coatings Market Drivers and Challenges
- Niger Potable Water Tank Coatings Price Trends
- Niger Potable Water Tank Coatings Porter's Five Forces
- Niger Potable Water Tank Coatings Industry Life Cycle
- Historical Data and Forecast of Niger Potable Water Tank Coatings Market Revenues & Volume By Coating Type for the Period 2022 - 2032F
- Historical Data and Forecast of Niger Potable Water Tank Coatings Market Revenues & Volume By Epoxy for the Period 2022 - 2032F
- Historical Data and Forecast of Niger Potable Water Tank Coatings Market Revenues & Volume By Polyurethane for the Period 2022 - 2032F
- Historical Data and Forecast of Niger Potable Water Tank Coatings Market Revenues & Volume By Acrylic for the Period 2022 - 2032F
- Historical Data and Forecast of Niger Potable Water Tank Coatings Market Revenues & Volume By Zinc-Rich for the Period 2022 - 2032F
- Historical Data and Forecast of Niger Potable Water Tank Coatings Market Revenues & Volume By Others for the Period 2022 - 2032F
- Historical Data and Forecast of Niger Potable Water Tank Coatings Market Revenues & Volume By Application for the Period 2022 - 2032F
- Historical Data and Forecast of Niger Potable Water Tank Coatings Market Revenues & Volume By Steel Tanks for the Period 2022 - 2032F
- Historical Data and Forecast of Niger Potable Water Tank Coatings Market Revenues & Volume By Concrete Tanks for the Period 2022 - 2032F
- Historical Data and Forecast of Niger Potable Water Tank Coatings Market Revenues & Volume By Underground Tanks for the Period 2022 - 2032F
- Historical Data and Forecast of Niger Potable Water Tank Coatings Market Revenues & Volume By Overhead Tanks for the Period 2022 - 2032F
- Historical Data and Forecast of Niger Potable Water Tank Coatings Market Revenues & Volume By End Use Industry for the Period 2022 - 2032F
- Historical Data and Forecast of Niger Potable Water Tank Coatings Market Revenues & Volume By Water Treatment for the Period 2022 - 2032F
- Historical Data and Forecast of Niger Potable Water Tank Coatings Market Revenues & Volume By Municipal for the Period 2022 - 2032F
- Historical Data and Forecast of Niger Potable Water Tank Coatings Market Revenues & Volume By Industrial for the Period 2022 - 2032F
- Historical Data and Forecast of Niger Potable Water Tank Coatings Market Revenues & Volume By Residential for the Period 2022 - 2032F
- Historical Data and Forecast of Niger Potable Water Tank Coatings Market Revenues & Volume By Material Type for the Period 2022 - 2032F
- Historical Data and Forecast of Niger Potable Water Tank Coatings Market Revenues & Volume By Organic for the Period 2022 - 2032F
- Historical Data and Forecast of Niger Potable Water Tank Coatings Market Revenues & Volume By Inorganic for the Period 2022 - 2032F
- Historical Data and Forecast of Niger Potable Water Tank Coatings Market Revenues & Volume By Hybrid for the Period 2022 - 2032F
- Historical Data and Forecast of Niger Potable Water Tank Coatings Market Revenues & Volume By Others for the Period 2022 - 2032F
- Niger Potable Water Tank Coatings Import Export Trade Statistics
- Market Opportunity Assessment By Coating Type
- Market Opportunity Assessment By Application
- Market Opportunity Assessment By End Use Industry
- Market Opportunity Assessment By Material Type
- Niger Potable Water Tank Coatings Top Companies Market Share
- Niger Potable Water Tank Coatings Competitive Benchmarking By Technical and Operational Parameters
- Niger Potable Water Tank Coatings Company Profiles
- Niger Potable Water Tank Coatings Key Strategic Recommendations
Frequently Asked Questions About the Market Study (FAQs):
6Wresearch actively monitors the Niger Potable Water Tank Coatings Market and publishes its comprehensive annual report, highlighting emerging trends, growth drivers, revenue analysis, and forecast outlook. Our insights help businesses to make data-backed strategic decisions with ongoing market dynamics. Our analysts track relevent industries related to the Niger Potable Water Tank Coatings Market, allowing our clients with actionable intelligence and reliable forecasts tailored to emerging regional needs.
Yes, we provide customisation as per your requirements. To learn more, feel free to contact us on sales@6wresearch.com
1 Executive Summary |
2 Introduction |
2.1 Key Highlights of the Report |
2.2 Report Description |
2.3 Market Scope & Segmentation |
2.4 Research Methodology |
2.5 Assumptions |
3 Niger Potable Water Tank Coatings Market Overview |
3.1 Niger Country Macro Economic Indicators |
3.2 Niger Potable Water Tank Coatings Market Revenues & Volume, 2022 & 2032F |
3.3 Niger Potable Water Tank Coatings Market - Industry Life Cycle |
3.4 Niger Potable Water Tank Coatings Market - Porter's Five Forces |
3.5 Niger Potable Water Tank Coatings Market Revenues & Volume Share, By Coating Type, 2022 & 2032F |
3.6 Niger Potable Water Tank Coatings Market Revenues & Volume Share, By Application, 2022 & 2032F |
3.7 Niger Potable Water Tank Coatings Market Revenues & Volume Share, By End Use Industry, 2022 & 2032F |
3.8 Niger Potable Water Tank Coatings Market Revenues & Volume Share, By Material Type, 2022 & 2032F |
4 Niger Potable Water Tank Coatings Market Dynamics |
4.1 Impact Analysis |
4.2 Market Drivers |
4.2.1 Increasing urbanization and industrialization in Niger leading to the construction of more water storage tanks |
4.2.2 Growing awareness about the importance of water quality and the need for protective coatings on water tanks |
4.2.3 Government initiatives and regulations promoting the use of potable water tank coatings |
4.3 Market Restraints |
4.3.1 High initial investment required for implementing potable water tank coatings |
4.3.2 Limited availability of skilled labor for the application of specialized coatings |
4.3.3 Fluctuating prices of raw materials used in the manufacturing of water tank coatings |
5 Niger Potable Water Tank Coatings Market Trends |
6 Niger Potable Water Tank Coatings Market, By Types |
6.1 Niger Potable Water Tank Coatings Market, By Coating Type |
6.1.1 Overview and Analysis |
6.1.2 Niger Potable Water Tank Coatings Market Revenues & Volume, By Coating Type, 2022 - 2032F |
6.1.3 Niger Potable Water Tank Coatings Market Revenues & Volume, By Epoxy, 2022 - 2032F |
6.1.4 Niger Potable Water Tank Coatings Market Revenues & Volume, By Polyurethane, 2022 - 2032F |
6.1.5 Niger Potable Water Tank Coatings Market Revenues & Volume, By Acrylic, 2022 - 2032F |
6.1.6 Niger Potable Water Tank Coatings Market Revenues & Volume, By Zinc-Rich, 2022 - 2032F |
6.1.7 Niger Potable Water Tank Coatings Market Revenues & Volume, By Others, 2022 - 2032F |
6.2 Niger Potable Water Tank Coatings Market, By Application |
6.2.1 Overview and Analysis |
6.2.2 Niger Potable Water Tank Coatings Market Revenues & Volume, By Steel Tanks, 2022 - 2032F |
6.2.3 Niger Potable Water Tank Coatings Market Revenues & Volume, By Concrete Tanks, 2022 - 2032F |
6.2.4 Niger Potable Water Tank Coatings Market Revenues & Volume, By Underground Tanks, 2022 - 2032F |
6.2.5 Niger Potable Water Tank Coatings Market Revenues & Volume, By Overhead Tanks, 2022 - 2032F |
6.3 Niger Potable Water Tank Coatings Market, By End Use Industry |
6.3.1 Overview and Analysis |
6.3.2 Niger Potable Water Tank Coatings Market Revenues & Volume, By Water Treatment, 2022 - 2032F |
6.3.3 Niger Potable Water Tank Coatings Market Revenues & Volume, By Municipal, 2022 - 2032F |
6.3.4 Niger Potable Water Tank Coatings Market Revenues & Volume, By Industrial, 2022 - 2032F |
6.3.5 Niger Potable Water Tank Coatings Market Revenues & Volume, By Residential, 2022 - 2032F |
6.4 Niger Potable Water Tank Coatings Market, By Material Type |
6.4.1 Overview and Analysis |
6.4.2 Niger Potable Water Tank Coatings Market Revenues & Volume, By Organic, 2022 - 2032F |
6.4.3 Niger Potable Water Tank Coatings Market Revenues & Volume, By Inorganic, 2022 - 2032F |
6.4.4 Niger Potable Water Tank Coatings Market Revenues & Volume, By Hybrid, 2022 - 2032F |
6.4.5 Niger Potable Water Tank Coatings Market Revenues & Volume, By Others, 2022 - 2032F |
7 Niger Potable Water Tank Coatings Market Import-Export Trade Statistics |
7.1 Niger Potable Water Tank Coatings Market Export to Major Countries |
7.2 Niger Potable Water Tank Coatings Market Imports from Major Countries |
8 Niger Potable Water Tank Coatings Market Key Performance Indicators |
8.1 Rate of adoption of potable water tank coatings in new construction projects |
8.2 Average lifespan of water tank coatings in different environmental conditions |
8.3 Number of compliance checks and certifications obtained by water tank coatings manufacturers |
8.4 Percentage of water tank maintenance budgets allocated towards coatings upkeep |
8.5 Environmental impact assessment scores for water tank coatings used in Niger |
9 Niger Potable Water Tank Coatings Market - Opportunity Assessment |
9.1 Niger Potable Water Tank Coatings Market Opportunity Assessment, By Coating Type, 2022 & 2032F |
9.2 Niger Potable Water Tank Coatings Market Opportunity Assessment, By Application, 2022 & 2032F |
9.3 Niger Potable Water Tank Coatings Market Opportunity Assessment, By End Use Industry, 2022 & 2032F |
9.4 Niger Potable Water Tank Coatings Market Opportunity Assessment, By Material Type, 2022 & 2032F |
10 Niger Potable Water Tank Coatings Market - Competitive Landscape |
10.1 Niger Potable Water Tank Coatings Market Revenue Share, By Companies, 2025 |
10.2 Niger Potable Water Tank Coatings Market Competitive Benchmarking, By Operating and Technical Parameters |
11 Company Profiles |
12 Recommendations |
13 Disclaimer |
Export potential assessment - trade Analytics for 2030
Export potential enables firms to identify high-growth global markets with greater confidence by combining advanced trade intelligence with a structured quantitative methodology. The framework analyzes emerging demand trends and country-level import patterns while integrating macroeconomic and trade datasets such as GDP and population forecasts, bilateral import–export flows, tariff structures, elasticity differentials between developed and developing economies, geographic distance, and import demand projections. Using weighted trade values from 2020–2024 as the base period to project country-to-country export potential for 2030, these inputs are operationalized through calculated drivers such as gravity model parameters, tariff impact factors, and projected GDP per-capita growth. Through an analysis of hidden potentials, demand hotspots, and market conditions that are most favorable to success, this method enables firms to focus on target countries, maximize returns, and global expansion with data, backed by accuracy.
By factoring in the projected importer demand gap that is currently unmet and could be potential opportunity, it identifies the potential for the Exporter (Country) among 190 countries, against the general trade analysis, which identifies the biggest importer or exporter.
To discover high-growth global markets and optimize your business strategy:
Click Here
Pricing
- Single User License$ 1,995
- Department License$ 2,400
- Site License$ 3,120
- Global License$ 3,795

Search
Thought Leadership and Analyst Meet


Our Clients
Latest Reports
- China Electric Appliance Rental Market (2026-2032) | Trends, Revenue, Growth, Challenges, Size, Value, Outlook, Pricing, Strategy, Insights, Restraints, segmentation, Companies, Investment Opportunities, Analysis, Demand, Drivers, Competition, Forecast, Share
- Chile Electric Appliance Rental Market (2026-2032) | Outlook, Competition, Drivers, Strategy, Revenue, Analysis, Value, Pricing, Restraints, Size, Demand, Share, Growth, Forecast, Challenges, Insights, Investment Opportunities, Companies, Trends, segmentation
- Cambodia Electric Appliance Rental Market (2026-2032) | Companies, Analysis, Restraints, Pricing, Insights, Challenges, Outlook, Strategy, Forecast, Trends, Competition, Value, Revenue, Investment Opportunities, segmentation, Drivers, Size, Demand, Growth, Share
- Brazil Electric Appliance Rental Market (2026-2032) | Revenue, Strategy, Forecast, Companies, segmentation, Competition, Size, Investment Opportunities, Pricing, Restraints, Outlook, Challenges, Analysis, Drivers, Value, Demand, Insights, Trends, Growth, Share
- Bangladesh Electric Appliance Rental Market (2026-2032) | Drivers, Forecast, Investment Opportunities, Strategy, Insights, Demand, Challenges, Outlook, Trends, Competition, Value, Revenue, Size, Pricing, Analysis, Companies, Restraints, segmentation, Share, Growth
- Bahrain Electric Appliance Rental Market (2026-2032) | Outlook, Size, Competition, Restraints, Drivers, Value, Trends, Investment Opportunities, Insights, Forecast, Revenue, Strategy, Growth, Share, Demand, Analysis, Challenges, Companies, segmentation, Pricing
- Azerbaijan Electric Appliance Rental Market (2026-2032) | Trends, Investment Opportunities, Restraints, Insights, Strategy, Competition, Value, Growth, Demand, Drivers, Analysis, Forecast, Size, Share, Outlook, segmentation, Pricing, Challenges, Revenue, Companies
- Australia Electric Appliance Rental Market (2026-2032) | Challenges, Restraints, Forecast, Demand, Size, Competition, Pricing, Investment Opportunities, Revenue, Trends, Drivers, Growth, Outlook, Analysis, Strategy, Value, segmentation, Insights, Companies, Share
- Argentina Electric Appliance Rental Market (2026-2032) | Growth, Trends, Insights, Outlook, Forecast, Size, Drivers, Analysis, Restraints, Challenges, Share, Revenue, Investment Opportunities, Strategy, Demand, Value, Companies, segmentation, Competition, Pricing
- Algeria Electric Appliance Rental Market (2026-2032) | Share, Size, Value, Strategy, Competition, Outlook, Challenges, Companies, Trends, Pricing, Insights, Forecast, Investment Opportunities, Revenue, Growth, Restraints, segmentation, Analysis, Demand, Drivers
Industry Events and Analyst Meet

HIMTEX 2026

India Refining Summit 2026

India EV Show 2026

EV tech India Expo 2026

Auto Tech Asia 2026
Whitepaper
- Middle East & Africa Commercial Security Market Click here to view more.
- Middle East & Africa Fire Safety Systems & Equipment Market Click here to view more.
- GCC Drone Market Click here to view more.
- Middle East Lighting Fixture Market Click here to view more.
- GCC Physical & Perimeter Security Market Click here to view more.
6WResearch In News
- Doha a strategic location for EV manufacturing hub: IPA Qatar
- Demand for luxury TVs surging in the GCC, says Samsung
- Empowering Growth: The Thriving Journey of Bangladesh’s Cable Industry
- Demand for luxury TVs surging in the GCC, says Samsung
- Video call with a traditional healer? Once unthinkable, it’s now common in South Africa
- Intelligent Buildings To Smooth GCC’s Path To Net Zero