Nigeria Photopolymers Market (2026-2032) | Segmentation, Size & Revenue, Industry, Forecast, Growth, Companies, Value, Competitive Landscape, Analysis, Share, Trends, Outlook
Market Forecast By Performance (Low Performance, Mid Performance, High Performance), By Technology (Stereolithography (SLA), Digital Light Processing (DLP), Continuous Digital Light Processing (cDLP)), By Application (Dental, Medical, Audiology, Jewelry, Automotive, Prototyping, Industrial/Engineering) And Competitive Landscape
| Product Code: ETC8632449 | Publication Date: Sep 2024 | Updated Date: Apr 2026 | Product Type: Market Research Report | |
| Publisher: 6Wresearch | Author: Dhaval Chaurasia | No. of Pages: 75 | No. of Figures: 35 | No. of Tables: 20 |
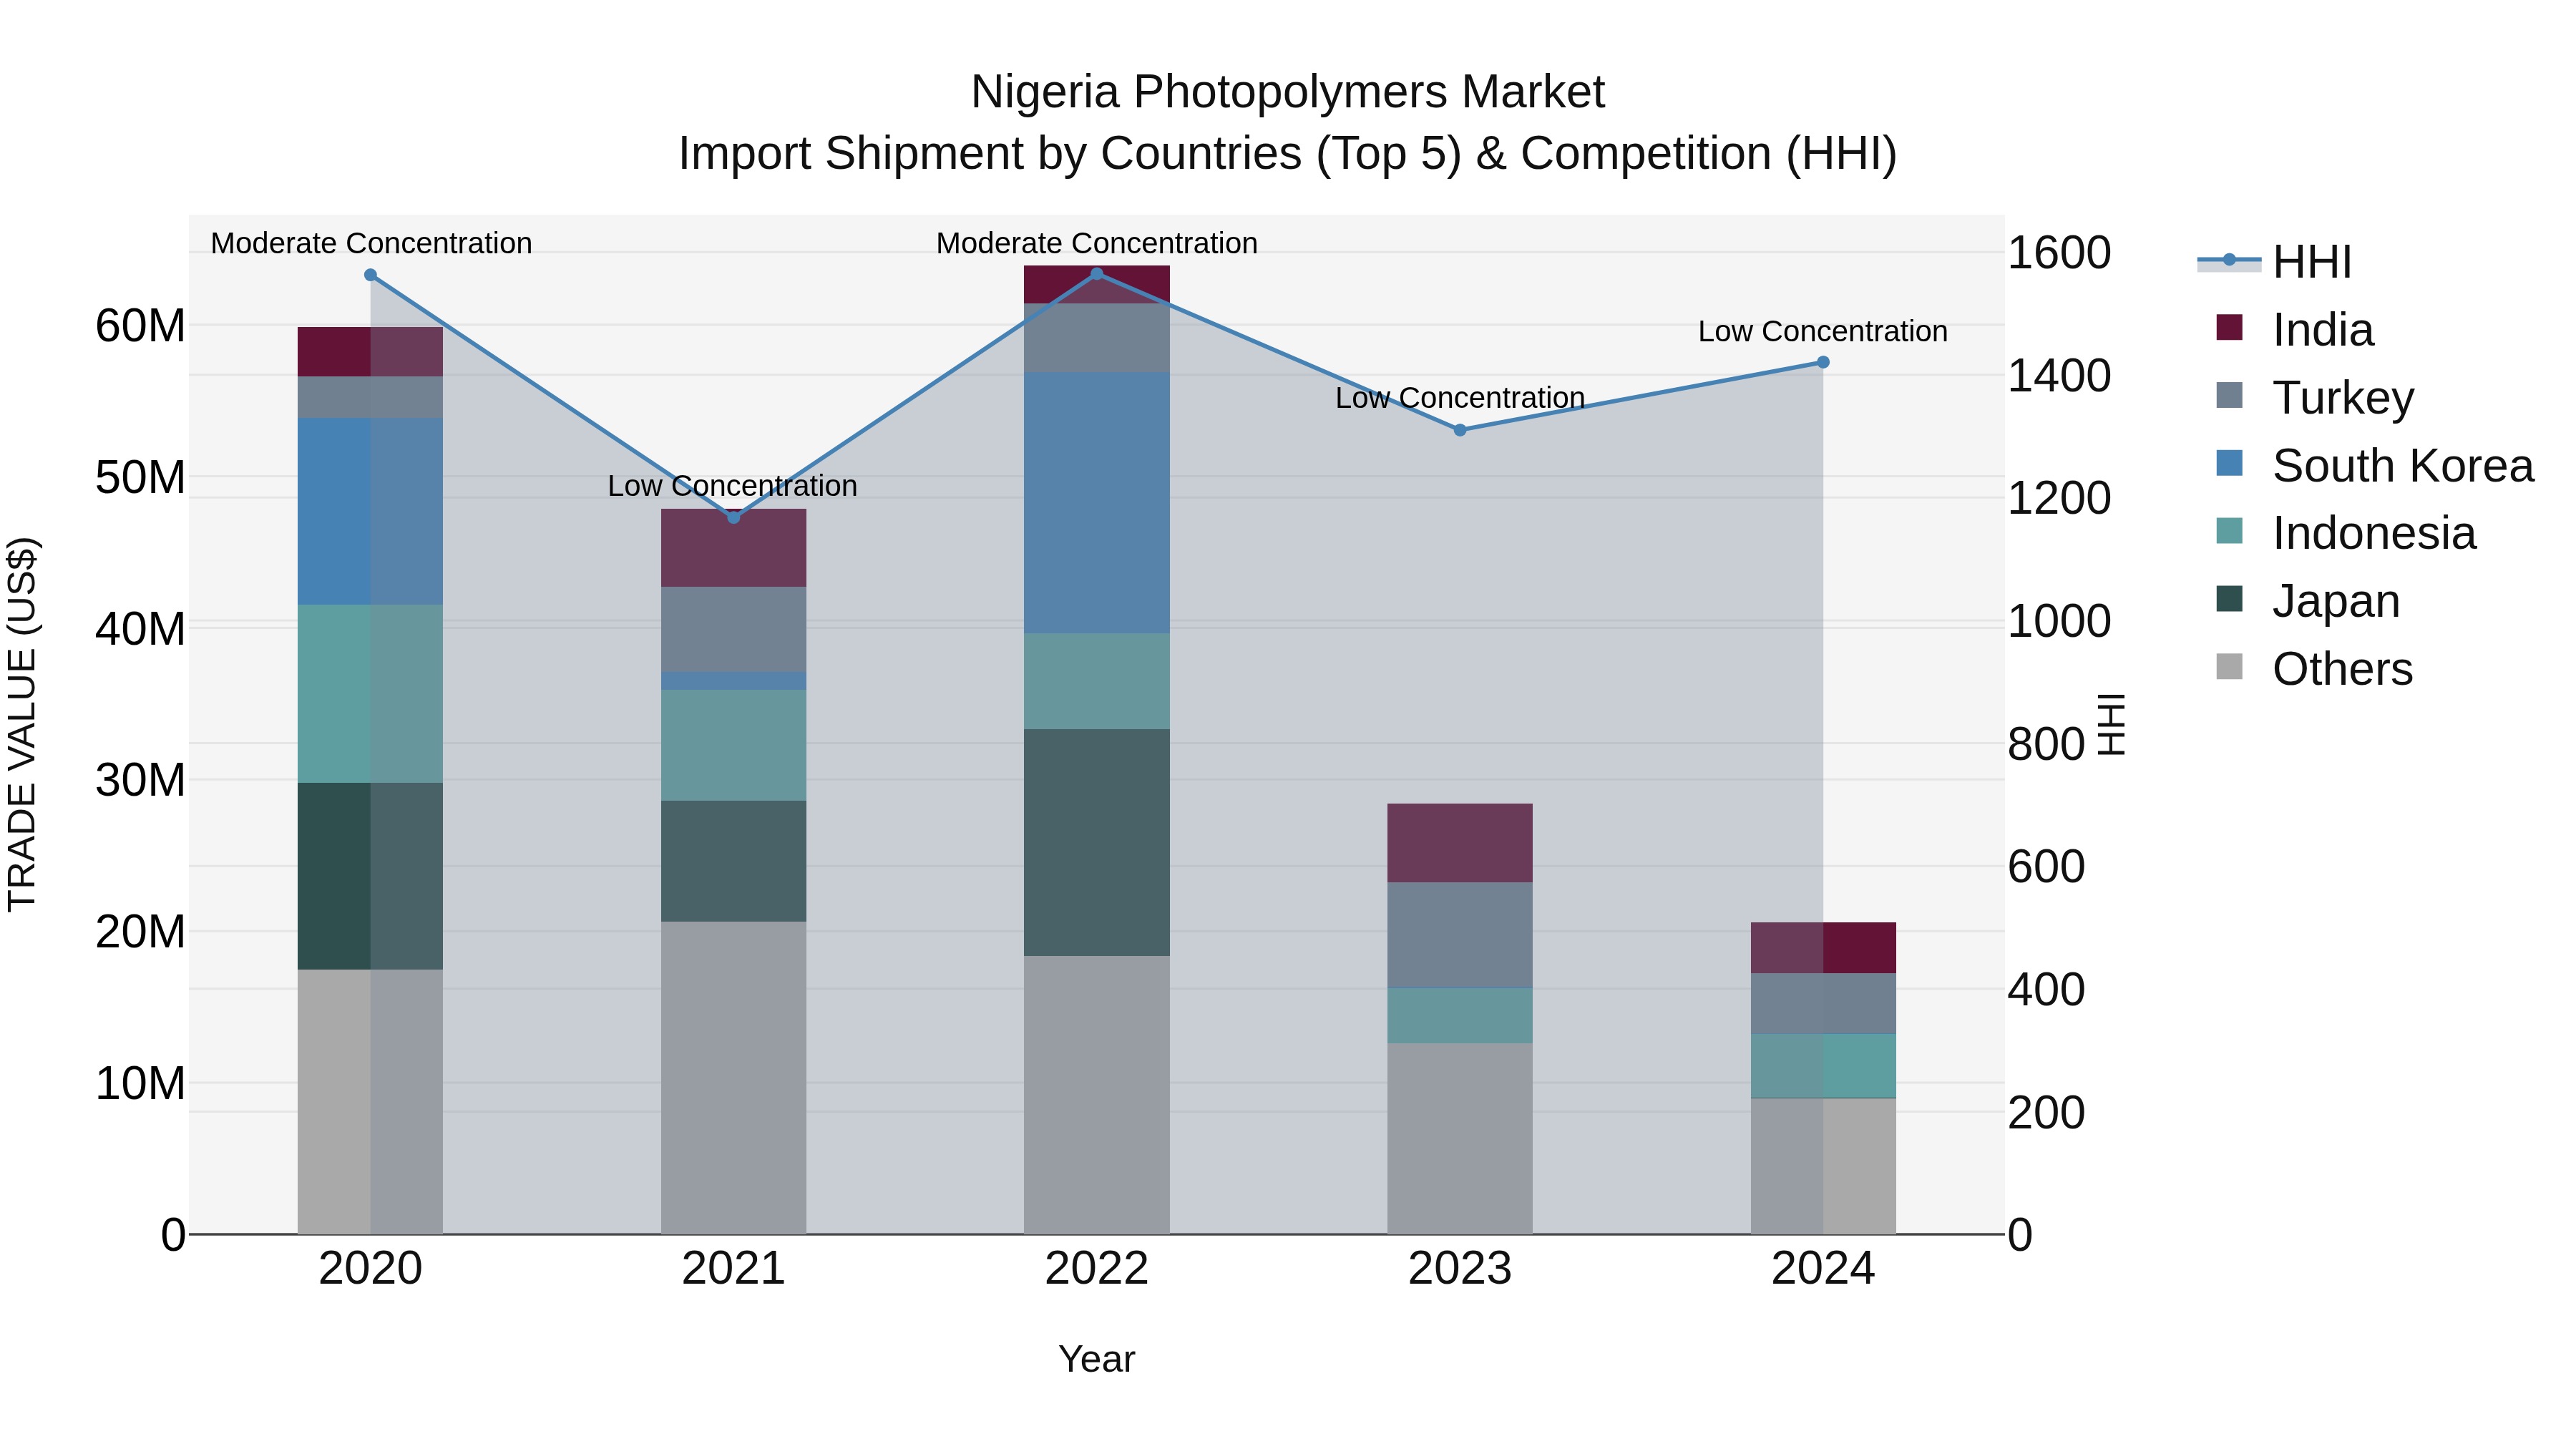
Nigeria Photopolymers Market Top 5 Importing Countries and Market Competition (HHI) Analysis
In 2024, Nigeria saw significant photopolymers import shipments from Indonesia, Turkey, India, UAE, and China. Despite the diverse sources, the market remained highly competitive with a low Herfindahl-Hirschman Index (HHI) concentration. The compound annual growth rate (CAGR) from 2020 to 2024 was notably negative at -23.43%, with a further decline in the growth rate from 2023 to 2024 at -27.65%. This data suggests a challenging market environment for photopolymer imports in Nigeria, emphasizing the need for strategic market positioning and innovation.
Key Highlights of the Report:
- Nigeria Photopolymers Market Outlook
- Market Size of Nigeria Photopolymers Market, 2025
- Forecast of Nigeria Photopolymers Market, 2032
- Historical Data and Forecast of Nigeria Photopolymers Revenues & Volume for the Period 2022 - 2032
- Nigeria Photopolymers Market Trend Evolution
- Nigeria Photopolymers Market Drivers and Challenges
- Nigeria Photopolymers Price Trends
- Nigeria Photopolymers Porter's Five Forces
- Nigeria Photopolymers Industry Life Cycle
- Historical Data and Forecast of Nigeria Photopolymers Market Revenues & Volume By Performance for the Period 2022 - 2032
- Historical Data and Forecast of Nigeria Photopolymers Market Revenues & Volume By Low Performance for the Period 2022 - 2032
- Historical Data and Forecast of Nigeria Photopolymers Market Revenues & Volume By Mid Performance for the Period 2022 - 2032
- Historical Data and Forecast of Nigeria Photopolymers Market Revenues & Volume By High Performance for the Period 2022 - 2032
- Historical Data and Forecast of Nigeria Photopolymers Market Revenues & Volume By Technology for the Period 2022 - 2032
- Historical Data and Forecast of Nigeria Photopolymers Market Revenues & Volume By Stereolithography (SLA) for the Period 2022 - 2032
- Historical Data and Forecast of Nigeria Photopolymers Market Revenues & Volume By Digital Light Processing (DLP) for the Period 2022 - 2032
- Historical Data and Forecast of Nigeria Photopolymers Market Revenues & Volume By Continuous Digital Light Processing (cDLP) for the Period 2022 - 2032
- Historical Data and Forecast of Nigeria Photopolymers Market Revenues & Volume By Application for the Period 2022 - 2032
- Historical Data and Forecast of Nigeria Photopolymers Market Revenues & Volume By Dental for the Period 2022 - 2032
- Historical Data and Forecast of Nigeria Photopolymers Market Revenues & Volume By Medical for the Period 2022 - 2032
- Historical Data and Forecast of Nigeria Photopolymers Market Revenues & Volume By Audiology for the Period 2022 - 2032
- Historical Data and Forecast of Nigeria Photopolymers Market Revenues & Volume By Jewelry for the Period 2022 - 2032
- Historical Data and Forecast of Nigeria Photopolymers Market Revenues & Volume By Automotive for the Period 2022 - 2032
- Historical Data and Forecast of Nigeria Photopolymers Market Revenues & Volume By Prototyping for the Period 2022 - 2032
- Historical Data and Forecast of Nigeria Photopolymers Market Revenues & Volume By Industrial/Engineering for the Period 2022 - 2032
- Nigeria Photopolymers Import Export Trade Statistics
- Market Opportunity Assessment By Performance
- Market Opportunity Assessment By Technology
- Market Opportunity Assessment By Application
- Nigeria Photopolymers Top Companies Market Share
- Nigeria Photopolymers Competitive Benchmarking By Technical and Operational Parameters
- Nigeria Photopolymers Company Profiles
- Nigeria Photopolymers Key Strategic Recommendations
Frequently Asked Questions About the Market Study (FAQs):
6Wresearch actively monitors the Nigeria Photopolymers Market and publishes its comprehensive annual report, highlighting emerging trends, growth drivers, revenue analysis, and forecast outlook. Our insights help businesses to make data-backed strategic decisions with ongoing market dynamics. Our analysts track relevent industries related to the Nigeria Photopolymers Market, allowing our clients with actionable intelligence and reliable forecasts tailored to emerging regional needs.
Yes, we provide customisation as per your requirements. To learn more, feel free to contact us on sales@6wresearch.com
1 Executive Summary |
2 Introduction |
2.1 Key Highlights of the Report |
2.2 Report Description |
2.3 Market Scope & Segmentation |
2.4 Research Methodology |
2.5 Assumptions |
3 Nigeria Photopolymers Market Overview |
3.1 Nigeria Country Macro Economic Indicators |
3.2 Nigeria Photopolymers Market Revenues & Volume, 2022 & 2032F |
3.3 Nigeria Photopolymers Market - Industry Life Cycle |
3.4 Nigeria Photopolymers Market - Porter's Five Forces |
3.5 Nigeria Photopolymers Market Revenues & Volume Share, By Performance, 2022 & 2032F |
3.6 Nigeria Photopolymers Market Revenues & Volume Share, By Technology, 2022 & 2032F |
3.7 Nigeria Photopolymers Market Revenues & Volume Share, By Application, 2022 & 2032F |
4 Nigeria Photopolymers Market Dynamics |
4.1 Impact Analysis |
4.2 Market Drivers |
4.2.1 Increasing demand for photopolymers in industries such as electronics, automotive, and packaging due to their properties like high strength, durability, and resistance to heat and chemicals. |
4.2.2 Growing adoption of photopolymers in 3D printing and rapid prototyping applications, driven by advancements in technology and cost-effectiveness. |
4.2.3 Government initiatives and investments in infrastructure development and industrial growth, leading to a rise in demand for photopolymers for construction and manufacturing purposes. |
4.3 Market Restraints |
4.3.1 Fluctuating prices of raw materials used in photopolymer production, such as acrylic acid and acrylate monomers, impacting the overall production cost and pricing of photopolymers. |
4.3.2 Environmental concerns related to the disposal and recycling of photopolymers, leading to regulatory challenges and increasing pressure to develop sustainable and eco-friendly alternatives. |
4.3.3 Competition from other materials like thermoplastics and traditional manufacturing methods, posing a challenge to the market growth of photopolymers in Nigeria. |
5 Nigeria Photopolymers Market Trends |
6 Nigeria Photopolymers Market, By Types |
6.1 Nigeria Photopolymers Market, By Performance |
6.1.1 Overview and Analysis |
6.1.2 Nigeria Photopolymers Market Revenues & Volume, By Performance, 2022 - 2032F |
6.1.3 Nigeria Photopolymers Market Revenues & Volume, By Low Performance, 2022 - 2032F |
6.1.4 Nigeria Photopolymers Market Revenues & Volume, By Mid Performance, 2022 - 2032F |
6.1.5 Nigeria Photopolymers Market Revenues & Volume, By High Performance, 2022 - 2032F |
6.2 Nigeria Photopolymers Market, By Technology |
6.2.1 Overview and Analysis |
6.2.2 Nigeria Photopolymers Market Revenues & Volume, By Stereolithography (SLA), 2022 - 2032F |
6.2.3 Nigeria Photopolymers Market Revenues & Volume, By Digital Light Processing (DLP), 2022 - 2032F |
6.2.4 Nigeria Photopolymers Market Revenues & Volume, By Continuous Digital Light Processing (cDLP), 2022 - 2032F |
6.3 Nigeria Photopolymers Market, By Application |
6.3.1 Overview and Analysis |
6.3.2 Nigeria Photopolymers Market Revenues & Volume, By Dental, 2022 - 2032F |
6.3.3 Nigeria Photopolymers Market Revenues & Volume, By Medical, 2022 - 2032F |
6.3.4 Nigeria Photopolymers Market Revenues & Volume, By Audiology, 2022 - 2032F |
6.3.5 Nigeria Photopolymers Market Revenues & Volume, By Jewelry, 2022 - 2032F |
6.3.6 Nigeria Photopolymers Market Revenues & Volume, By Automotive, 2022 - 2032F |
6.3.7 Nigeria Photopolymers Market Revenues & Volume, By Prototyping, 2022 - 2032F |
7 Nigeria Photopolymers Market Import-Export Trade Statistics |
7.1 Nigeria Photopolymers Market Export to Major Countries |
7.2 Nigeria Photopolymers Market Imports from Major Countries |
8 Nigeria Photopolymers Market Key Performance Indicators |
8.1 Research and development investments in new photopolymer formulations and technologies to enhance product performance and expand application possibilities. |
8.2 Number of patents filed or granted for photopolymer innovations, indicating the level of technological advancement and potential market differentiation. |
8.3 Adoption rate of photopolymer-based products in key industries and applications, reflecting the market acceptance and growth potential of photopolymers in Nigeria. |
9 Nigeria Photopolymers Market - Opportunity Assessment |
9.1 Nigeria Photopolymers Market Opportunity Assessment, By Performance, 2022 & 2032F |
9.2 Nigeria Photopolymers Market Opportunity Assessment, By Technology, 2022 & 2032F |
9.3 Nigeria Photopolymers Market Opportunity Assessment, By Application, 2022 & 2032F |
10 Nigeria Photopolymers Market - Competitive Landscape |
10.1 Nigeria Photopolymers Market Revenue Share, By Companies, 2025 |
10.2 Nigeria Photopolymers Market Competitive Benchmarking, By Operating and Technical Parameters |
11 Company Profiles |
12 Recommendations |
13 Disclaimer |
Export potential assessment - trade Analytics for 2030
Export potential enables firms to identify high-growth global markets with greater confidence by combining advanced trade intelligence with a structured quantitative methodology. The framework analyzes emerging demand trends and country-level import patterns while integrating macroeconomic and trade datasets such as GDP and population forecasts, bilateral import–export flows, tariff structures, elasticity differentials between developed and developing economies, geographic distance, and import demand projections. Using weighted trade values from 2020–2024 as the base period to project country-to-country export potential for 2030, these inputs are operationalized through calculated drivers such as gravity model parameters, tariff impact factors, and projected GDP per-capita growth. Through an analysis of hidden potentials, demand hotspots, and market conditions that are most favorable to success, this method enables firms to focus on target countries, maximize returns, and global expansion with data, backed by accuracy.
By factoring in the projected importer demand gap that is currently unmet and could be potential opportunity, it identifies the potential for the Exporter (Country) among 190 countries, against the general trade analysis, which identifies the biggest importer or exporter.
To discover high-growth global markets and optimize your business strategy:
Click Here
Pricing
- Single User License$ 1,995
- Department License$ 2,400
- Site License$ 3,120
- Global License$ 3,795

Search
Thought Leadership and Analyst Meet


Our Clients
Latest Reports
- China Electric Appliance Rental Market (2026-2032) | Trends, Revenue, Growth, Challenges, Size, Value, Outlook, Pricing, Strategy, Insights, Restraints, segmentation, Companies, Investment Opportunities, Analysis, Demand, Drivers, Competition, Forecast, Share
- Chile Electric Appliance Rental Market (2026-2032) | Outlook, Competition, Drivers, Strategy, Revenue, Analysis, Value, Pricing, Restraints, Size, Demand, Share, Growth, Forecast, Challenges, Insights, Investment Opportunities, Companies, Trends, segmentation
- Cambodia Electric Appliance Rental Market (2026-2032) | Companies, Analysis, Restraints, Pricing, Insights, Challenges, Outlook, Strategy, Forecast, Trends, Competition, Value, Revenue, Investment Opportunities, segmentation, Drivers, Size, Demand, Growth, Share
- Brazil Electric Appliance Rental Market (2026-2032) | Revenue, Strategy, Forecast, Companies, segmentation, Competition, Size, Investment Opportunities, Pricing, Restraints, Outlook, Challenges, Analysis, Drivers, Value, Demand, Insights, Trends, Growth, Share
- Bangladesh Electric Appliance Rental Market (2026-2032) | Drivers, Forecast, Investment Opportunities, Strategy, Insights, Demand, Challenges, Outlook, Trends, Competition, Value, Revenue, Size, Pricing, Analysis, Companies, Restraints, segmentation, Share, Growth
- Bahrain Electric Appliance Rental Market (2026-2032) | Outlook, Size, Competition, Restraints, Drivers, Value, Trends, Investment Opportunities, Insights, Forecast, Revenue, Strategy, Growth, Share, Demand, Analysis, Challenges, Companies, segmentation, Pricing
- Azerbaijan Electric Appliance Rental Market (2026-2032) | Trends, Investment Opportunities, Restraints, Insights, Strategy, Competition, Value, Growth, Demand, Drivers, Analysis, Forecast, Size, Share, Outlook, segmentation, Pricing, Challenges, Revenue, Companies
- Australia Electric Appliance Rental Market (2026-2032) | Challenges, Restraints, Forecast, Demand, Size, Competition, Pricing, Investment Opportunities, Revenue, Trends, Drivers, Growth, Outlook, Analysis, Strategy, Value, segmentation, Insights, Companies, Share
- Argentina Electric Appliance Rental Market (2026-2032) | Growth, Trends, Insights, Outlook, Forecast, Size, Drivers, Analysis, Restraints, Challenges, Share, Revenue, Investment Opportunities, Strategy, Demand, Value, Companies, segmentation, Competition, Pricing
- Algeria Electric Appliance Rental Market (2026-2032) | Share, Size, Value, Strategy, Competition, Outlook, Challenges, Companies, Trends, Pricing, Insights, Forecast, Investment Opportunities, Revenue, Growth, Restraints, segmentation, Analysis, Demand, Drivers
Industry Events and Analyst Meet

HIMTEX 2026

India Refining Summit 2026

India EV Show 2026

EV tech India Expo 2026

Auto Tech Asia 2026
Whitepaper
- Middle East & Africa Commercial Security Market Click here to view more.
- Middle East & Africa Fire Safety Systems & Equipment Market Click here to view more.
- GCC Drone Market Click here to view more.
- Middle East Lighting Fixture Market Click here to view more.
- GCC Physical & Perimeter Security Market Click here to view more.
6WResearch In News
- Doha a strategic location for EV manufacturing hub: IPA Qatar
- Demand for luxury TVs surging in the GCC, says Samsung
- Empowering Growth: The Thriving Journey of Bangladesh’s Cable Industry
- Demand for luxury TVs surging in the GCC, says Samsung
- Video call with a traditional healer? Once unthinkable, it’s now common in South Africa
- Intelligent Buildings To Smooth GCC’s Path To Net Zero