North America Chiller Market (2025-2031) | Pricing Analysis, Investment Trends, Supply, Companies, Analysis, Segments, Challenges, Revenue, Outlook, Demand, Drivers, Opportunities, Value, Size, Competition, Share, Restraints, Segmentation, Strategy, Consumer Insights, Growth, Industry, Forecast, Trends, Strategic Insights, Competitive
Market Forecast by By Countries (United States, Canada, Rest of North America), By Heat Rejection Method/Type of Cooling (Water Cooled, Air Cooled), By Compressor Type (Screw Chillers, Scroll Chillers, Reciprocating Chillers, Centrifugal Chillers, Absorption Chillers), By End User (Residential, Commercial, Industrial (Chemicals & Petrochemicals, Food & Beverage, Medical, Plastics, Others)), And Competitive Landscape
| Product Code: ETC13200614 | Publication Date: Apr 2025 | Updated Date: Dec 2025 | Product Type: Market Research Report | |
| Publisher: 6Wresearch | No. of Pages: 89 | No. of Figures: 37 | No. of Tables: 24 | |
Topics Covered in North America Chiller Market Report
North America Chiller Market Report thoroughly covers the market by countries, heat rejection method/type of cooling, compressor type, and End User. North America Chiller Market Outlook report provides an unbiased and detailed analysis of the ongoing North America Chiller Market trends, opportunities/high growth areas, and market drivers. This would help stakeholders devise and align their market strategies according to the current and future market dynamics.
North America Chiller Market Synopsis
The North America Chiller Market witnessed strong growth between 2021 and 2024, driven primarily by sustained expansion in non-residential and institutional infrastructure, alongside an aging commercial building stock and tightening energy-efficiency regulations. Construction spending in the U.S. exceeded annually, with non-residential buildings and non-building infrastructure rising YoY, reflecting momentum in healthcare, education, energy, data centers, and mixed-use developments.
Chiller demand in the region is structurally replacement-led rather than new-build-driven, as U.S. commercial buildings were constructed before the early-2000s, anchoring demand toward retrofit and system upgrades independent of residential construction volatility. This aging installed base, combined with long chiller lifecycles, has converted market growth into a recurring, infrastructure-backed demand cycle rather than a short-term construction-linked upswing.
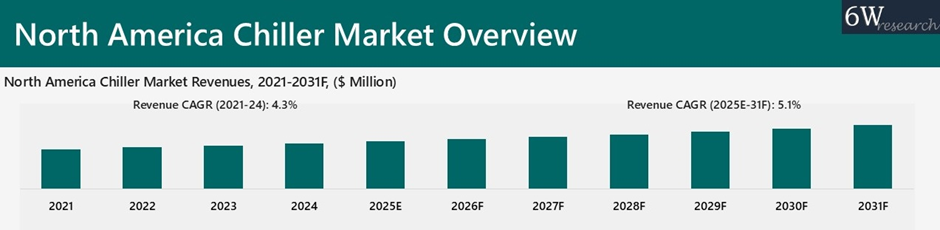
According to 6Wresearch, North America Chiller Market is projected to grow at a CAGR of 5.1% from 2025-2031F, fueled by a shift toward replacement-led demand and regulation-supported upgrades. Energy-efficiency regulations, decarbonization mandates, and large-scale retrofit incentives are accelerating the replacement of legacy HVAC systems across commercial and institutional buildings. The Inflation Reduction Act, adoption of updated ASHRAE 90.1 standards, and fiscal incentives such as Section 179D deductions are directly improving project economics for high-efficiency chiller upgrades. In Canada, government-backed programs targeting multi-million building retrofits by 2030 are further supporting demand for modern, low-GWP chiller systems across public and private infrastructure.
In parallel, high-intensity verticals are emerging as key volume and value drivers for the chiller market. Data centers have seen a sharp rise in IT capacity additions between 2021 and 2025, with U.S. data centers consuming more electricity in 2023, while cooling systems account for a significant share of operational energy use. Healthcare and life-sciences infrastructure have also expanded materially, alongside double-digit growth in life-sciences capital expenditure. These sectors require continuous, non-discretionary cooling, reinforcing demand for high-capacity, high-reliability chillers and expanding the long-term installed base across North America.
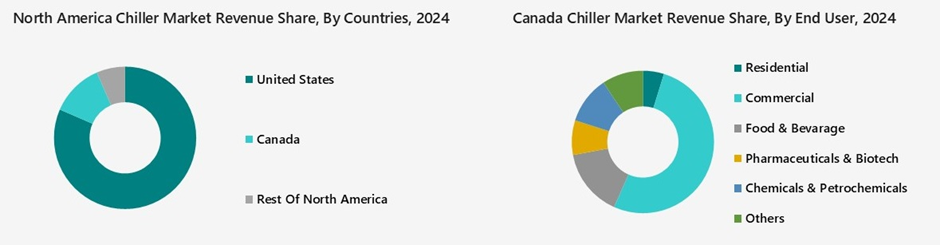
Market Segmentation By Countries
Rest of North America shows the highest CAGR, making it the fastest-growing opportunity in the region. Growth is driven by a smaller base effect, rising commercial construction, increasing HVAC penetration, and rapid adoption of modern, energy-efficient cooling systems across emerging urban and industrial clusters, outpacing the U.S. and Canada on a growth-rate basis.
Market Segmentation By Heat Rejection Method/Type of Cooling
Air-cooled chillers present the stronger growth opportunity in both the United States and Canada. Higher growth is driven by faster deployment in retrofit projects, rising data center additions, lower installation and water-use constraints, and increasing preference for modular, scalable cooling solutions across commercial and light industrial facilities.
Market Segmentation By Compressor Type
Absorption chillers show the highest growth in both the U.S. and Canada. Growth is driven by rising waste-heat recovery projects, district energy systems, CHP adoption, and decarbonization policies pushing low-electricity, heat-driven cooling solutions despite their smaller base.
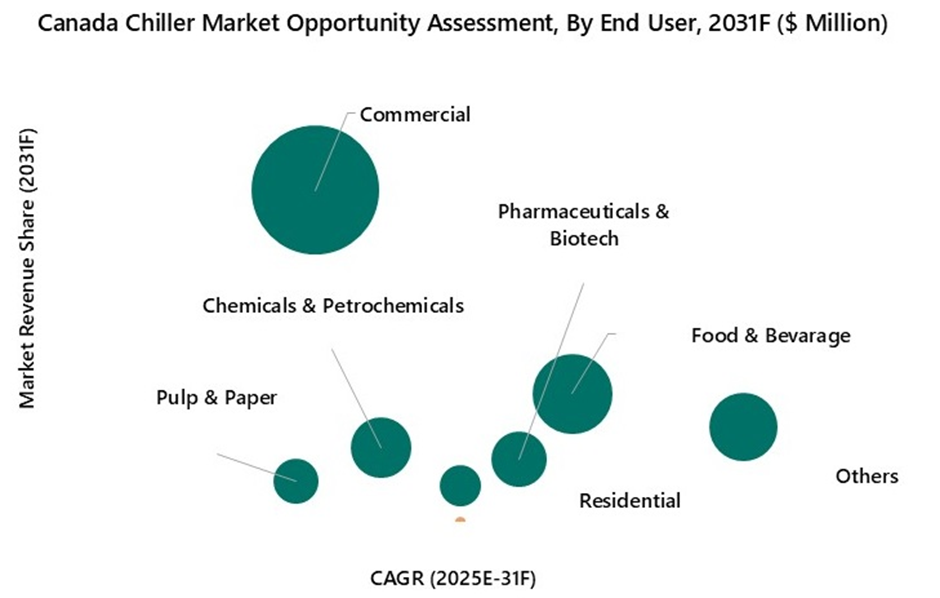
Market Segmentation By End User
Others (Plastics, Data Centers, Metals, Automotive, etc.) hold the largest share because it aggregates multiple high cooling-intensity, capital-heavy industries. Rapid data center expansion, plastics and metal processing requiring continuous process cooling, automotive manufacturing upgrades, and electrification-linked thermal loads collectively drive higher chiller capacity deployment. Unlike single-industry segments, this category benefits from diversified demand drivers, higher uptime requirements, and sustained capex across multiple industrial verticals.
Key Attractiveness of the Report
- 10 Years Market Numbers.
- Historical Data Starting from 2021 to 2024
- Base Year: 2024
- Forecast Data until 2031
- Key Performance Indicators Impacting the Market.
- Major Upcoming Developments and Projects.
Key Highlights of the Report:
- North America Chiller Market Overview
- North America Chiller Market Outlook
- North America Chiller Market Forecast
- Historical Data and Forecast of Global Chiller Market Revenues for the Period 2021-2031F
- Historical Data and Forecast of North America Chiller Market Revenues for the Period 2021-2031F
- Historical Data and Forecast of North America Chiller Market Revenues, By Countries for the Period 2021-2031F
- Historical Data and Forecast of North America Chiller Market Revenues, By Heat Rejection Method/Type of Cooling for the Period 2021-2031F
- Historical Data and Forecast of North America Chiller Market Revenues, By Compressor Type for the Period 2021-2031F
- Historical Data and Forecast of North America Chiller Market Revenues, By End User for the Period 2021-2031F
- Porter’s Five Force Analysis
- North America Chiller Market Drivers and Restraints
- North America Chiller Market Trends
- North America Chiller Market Opportunity Assessment, Countries
- North America Chiller Market Opportunity Assessment, By Heat Rejection Method/Type of Cooling
- North America Chiller Market Opportunity Assessment, By Compressor Type
- North America Chiller Market Opportunity Assessment, By End User
- North America Chiller Market Revenue Ranking, By Top 3 Companies
- Market Competitive Benchmarking
- Company Profiles
- Key Strategic Recommendations
Market Scope and Segmentation
The report provides a detailed analysis of the following market segments:
By Countries
- United States
- Canada
- Rest of North America
By Heat Rejection Method/Type of Cooling
- Water Cooled
- Air Cooled
By Compressor Type
- Screw Chillers
- Scroll Chillers
- Reciprocating Chillers
- Centrifugal Chillers
- Absorption Chillers
By End User
- Residential
- Commercial
- Industrial
- Chemicals & Petrochemicals
- Food & Beverage
- Medical
- Plastics
- Others
North America Chiller Market (2025-2031): FAQs
North America Chiller Market is projected to grow at a CAGR of 5.1% from 2025-2031F.
Growth in Infrastructure and Energy Efficiency Regulations & Decarbonization of Buildings are driving the growth of market.
The market faces restraints due to Execution and Capital Frictions Slow Conversion of Chiller Demand.
North America Chiller Market Report thoroughly covers the market by countries, heat rejection method/type of cooling, compressor type, and End User.
6Wresearch actively monitors the North America Chiller Market and publishes its comprehensive annual report, highlighting emerging trends, growth drivers, revenue analysis, and forecast outlook. Our insights help businesses to make data-backed strategic decisions with ongoing market dynamics. Our analysts track relevent industries related to the North America Chiller Market, allowing our clients with actionable intelligence and reliable forecasts tailored to emerging regional needs.
Yes, we provide customisation as per your requirements. To learn more, feel free to contact us on sales@6wresearch.com
| 1. Executive Summary |
| 2. Introduction |
| 2.1. Report Description |
| 2.2. Key Highlights of the Report |
| 2.3. Market Scope & Segmentation |
| 2.4. Research Methodology |
| 2.5. Assumptions |
| 3. Global Chiller Market Overview |
| 4. North America Chiller Market Overview |
| 4.1. North America Macro Economic Indicators |
| 4.2. North America Chiller Market Revenues, 2021-2031F |
| 4.3. North America Chiller Market – Industry Life Cycle |
| 4.4. North America Chiller Market – Porter’s Five Forces |
| 5. North America Chiller Market Dynamics |
| 5.1. Impact Analysis |
| 5.2. Market Drivers |
| 5.3. Market Restraints |
| 6. North America Chiller Market Trends |
| 7. North America Chiller Market Overview, By Countries |
| 7.1. North America Chiller Market Revenue Share, By Countries, 2024 & 2031F |
| 7.1.1 North America Chiller Market Revenues, By United States, 2021- 2031F |
| 7.1.2 North America Chiller Market Revenues, By Canada, 2021- 2031F |
| 7.1.3 North America Chiller Market Revenues, By Rest of North America, 2021- 2031F |
| 8. USA Chiller Market Overview |
| 8.1. USA Chiller Market Revenue Share, By Heat Rejection Method/Type of Cooling, 2024 & 2031F |
| 8.1.1. USA Chiller Market Revenues, By Water Cooled, 2021- 2031F |
| 8.1.2. USA Chiller Market Revenues, By Air Cooled, 2021- 2031F |
| 8.2. USA Chiller Market Revenue Share, By Compressor Type, 2024 & 2031F |
| 8.2.1. USA Chiller Market Revenues, By Screw Chillers, 2021- 2031F |
| 8.2.2. USA Chiller Market Revenues, By Scroll Chillers, 2021- 2031F |
| 8.2.3. USA Chiller Market Revenues, By Reciprocating Chillers, 2021- 2031F |
| 8.2.4. USA Chiller Market Revenues, By Centrifugal Chillers, 2021- 2031F |
| 8.2.5. USA Chiller Market Revenues, By Absorption Chillers, 2021- 2031F |
| 8.3. USA Chiller Market Revenue Share, By End User Industry, 2024 & 2031F |
| 8.3.1. USA Chiller Market Revenues, By Residential, 2021- 2031F |
| 8.3.2. USA Chiller Market Revenues, By Commercial, 2021- 2031F |
| 8.3.3. USA Chiller Market Revenues, By Food & Bevarage, 2021- 2031F |
| 8.3.4. USA Chiller Market Revenues, By Pharmaceuticals & Biotech, 2021- 2031F |
| 8.3.5. USA Chiller Market Revenues, By Chemicals & Petrochemicals, 2021- 2031F |
| 8.3.6. USA Chiller Market Revenues, By Others, 2021- 2031F |
| 9. Canada Chiller Market Overview |
| 9.1. Canada Chiller Market Revenue Share, By Heat Rejection Method/Type of Cooling, 2024 & 2031F |
| 9.1.1. Canada Chiller Market Revenues, By Water Cooled, 2021- 2031F |
| 9.1.2. Canada Chiller Market Revenues, By Air Cooled, 2021- 2031F |
| 9.2. Canada Chiller Market Revenue Share, By Compressor Type, 2024 & 2031F |
| 9.2.1. Canada Chiller Market Revenues, By Screw Chillers, 2021- 2031F |
| 9.2.2. Canada Chiller Market Revenues, By Scroll Chillers, 2021- 2031F |
| 9.2.3. Canada Chiller Market Revenues, By Reciprocating Chillers, 2021- 2031F |
| 9.2.4. Canada Chiller Market Revenues, By Centrifugal Chillers, 2021- 2031F |
| 9.2.5. Canada Chiller Market Revenues, By Absorption Chillers, 2021- 2031F |
| 9.3. Canada Chiller Market Revenue Share, By End User Industry, 2024 & 2031F |
| 9.3.1. Canada Chiller Market Revenues, By Residential, 2021- 2031F |
| 9.3.2. Canada Chiller Market Revenues, By Commercial, 2021- 2031F |
| 9.3.3. Canada Chiller Market Revenues, By Food & Bevarage, 2021- 2031F |
| 9.3.4. Canada Chiller Market Revenues, By Pharmaceuticals & Biotech, 2021- 2031F |
| 9.3.5. Canada Chiller Market Revenues, By Chemicals & Petrochemicals, 2021- 2031F |
| 9.3.6. Canada Chiller Market Revenues, By Pulp & Paper, 2021- 2031F |
| 9.3.7. Canada Chiller Market Revenues, By Others, 2021- 2031F |
| 10. Rest of North America Chiller Market Overview |
| 10.1. Rest of North America Chiller Market Revenue Share, By Heat Rejection Method/Type of Cooling, 2024 & 2031F |
| 10.1.1. Rest of North America Chiller Market Revenues, By Water Cooled, 2021- 2031F |
| 10.1.2. Rest of North America Chiller Market Revenues, By Air Cooled, 2021- 2031F |
| 10.2. Rest of North America Chiller Market Revenue Share, By Compressor Type, 2024 & 2031F |
| 10.2.1. Rest of North America Chiller Market Revenues, By Screw Chillers, 2021- 2031F |
| 10.2.2. Rest of North America Chiller Market Revenues, By Scroll Chillers, 2021- 2031F |
| 10.2.3. Rest of North America Chiller Market Revenues, By Reciprocating Chillers, 2021- 2031F |
| 10.2.4. Rest of North America Chiller Market Revenues, By Centrifugal Chillers, 2021- 2031F |
| 10.2.5. Rest of North America Chiller Market Revenues, By Absorption Chillers, 2021- 2031F |
| 10.3. Rest of North America Chiller Market Revenue Share, By End User Industry, 2024 & 2031F |
| 10.3.1. Rest of North America Chiller Market Revenues, By Residential, 2021- 2031F |
| 10.3.2. Rest of North America Chiller Market Revenues, By Commercial, 2021- 2031F |
| 10.3.3. Rest of North America Chiller Market Revenues, By Food & Bevarage, 2021- 2031F |
| 10.3.4. Rest of North America Chiller Market Revenues, By Automotive, 2021- 2031F |
| 10.3.5. Rest of North America Chiller Market Revenues, By Chemical Plastics, 2021- 2031F |
| 10.3.6. Rest of North America Chiller Market Revenues, By Others, 2021- 2031F |
| 11. North America Chiller Market Key Performance Indicators |
| 12. North America Chiller Market Opportunity Assessment |
| 12.1. North America Chiller Market Opportunity Assessment, By Countries, 2031F |
| 12.2. North America Chiller Market Opportunity Assessment, By Heat Rejection Method/Type Of Cooling, 2031F |
| 12.3. North America Chiller Market Opportunity Assessment, By Compressor Type, 2031F |
| 12.4. North America Chiller Market Opportunity Assessment, By End User Industry, 2031F |
| 13. North America Chiller Market Import-Export Trade Statistics |
| 14. North America Chiller Market Competitive Landscape |
| 14.1. North America Chiller Market Revenue Share/Ranking, By Top 3 Companies, CY 2024 |
| 14.2. North America Chiller Market Competitive Benchmarking, By Technical Parameters |
| 14.3. North America Chiller Market Competitive Benchmarking, By Operating Parameters |
| 15. Company Profiles |
| 15.1 Trane Technologies Company, LLC |
| 15.2 Daikin Industries, Ltd. |
| 15.3 Carrier Global Corporation |
| 15.4 Johnson Controls |
| 15.5 LG Electronics |
| 15.6 General Air Products, Inc. |
| 15.7 Mitsubishi Electric Group |
| 15.8 ClimaCool Corp. |
| 15.9 Thermal Care, Inc. |
| 15.10 Fluid Chillers, Inc. |
| 16. Key Strategic Recommendations |
| 17. Disclaimer |
| List of Figures |
| 1. Global Chiller Market Revenues, 2021-2031F ($ Billion) |
| 2. USA General government gross debt, 2021-2026F, (% of GDP) |
| 3. USA Real GDP Growth, YOY Change, 2021-2026F & 2030F, (in %) |
| 4. Canada General government gross debt, 2021-2026F, (% of GDP) |
| 5. Canada Real GDP Growth, YOY Change, 2021-2026F & 2030F, (in %) |
| 6. Mexico General government gross debt, 2021-2026F, (% of GDP) |
| 7. Mexico Real GDP Growth, YOY Change, 2021-2026F & 2030F, (in %) |
| 8. North America Chiller Market Revenues, 2021-2031F ($ Million) |
| 9. North America Total Lodging Construction Spending, 2025-2028F (In $ Millions) |
| 10. YoY % Change in Construction Output (in real terms), 2023-2027F |
| 11. North America Total Office Construction Spending, 2025-2028F (In $ Millions) |
| 12. North America Total Commercial Construction Spending, 2025-2028F (In $ Millions) |
| 13. North America Total Education Construction Spending, 2025-2028F (In $ Millions) |
| 14. North America Total Healthcare Construction Spending, 2025-2028F (In $ Millions) |
| 15. North America Chiller Market Revenue Share, By Countries, 2024 & 2031F |
| 16. USA Chiller Market Revenue Share, By Heat Rejection Method/Type of Cooling, 2024 & 2031F |
| 17. USA Chiller Market Revenue Share, By Compressor Type, 2024 & 2031F |
| 18. USA Chiller Market Revenue Share, By End User Industry, 2024 & 2031F |
| 19. Canada Chiller Market Revenue Share, By Heat Rejection Method/Type of Cooling, 2024 & 2031F |
| 20. Canada Chiller Market Revenue Share, By Compressor Type, 2024 & 2031F |
| 21. Canada Chiller Market Revenue Share, By End User Industry, 2024 & 2031F |
| 22. Rest of North America Chiller Market Revenue Share, By Heat Rejection Method/Type of Cooling, 2024 & 2031F |
| 23. Rest of North America Chiller Market Revenue Share, By Compressor Type, 2024 & 2031F |
| 24. Rest of America Chiller Market Revenue Share, By End User Industry, 2024 & 2031F |
| 25. USA Data Center Electricity Consumption (TWh) |
| 26. North America Chiller Market Opportunity Assessment, By Countries, 2031F ($ Million) |
| 27. USA Chiller Market Opportunity Assessment, By Heat Rejection Method/Type of Cooling, 2031F ($ Million) |
| 28. Canada Chiller Market Opportunity Assessment, By Heat Rejection Method/Type of Cooling, 2031F ($ Million) |
| 29. USA Chiller Market Opportunity Assessment, By Compressor Type, 2031F ($ Million) |
| 30. Canada Chiller Market Opportunity Assessment, By Compressor Type, 2031F ($ Million) |
| 31. USA Chiller Market Opportunity Assessment, By End User, 2031F ($ Million) |
| 32. Canada Chiller Market Opportunity Assessment, By End User, 2031F ($ Million) |
| 33. USA Chiller Import By Value, 2022 to 2024 ($ Thousand) |
| 34. USA Chiller Exports By Value, 2022 to 2024 ($ Thousand) |
| 35. Canada Chiller Import By Value, 2022 to 2024 ($ Thousand) |
| 36. Canada Chiller Exports By Value, 2022 to 2024 ($ Thousand) |
| 37. North America Chiller Market Revenue Ranking, By Top 3 Companies, 2024 |
| List of tables |
| 1. USA Key Figures, 2024-2025E & 2030F |
| 2. Canada Key Figures, 2024-2025E & 2030F |
| 3. Mexico Key Figures, 2024-2025E & 2030F |
| 4. USA Year-to-Date Construction Overview, 2024-2025 (In $ billions) |
| 5. USA Commercial Construction starts of August 2025 |
| 6. North America Regulation Overview, As of 2025 |
| 7. Total U.S. energy-related CO2 emissions by sector, 2020 and 2024 (In million metric tons of carbon dioxide) |
| 8. Top Project Delay Drivers Impacting Chiller Install process |
| 9. North America Chiller Market Revenues, By Countries, 2021-2031F, ($ Millions) |
| 10. USA Chiller Market Revenues, By Heat Rejection Method/Type of Cooling, 2021-2031F, ($ Millions) |
| 11. USA Chiller Market Revenues, By Compressor Type, 2021-2031F, ($ Millions) |
| 12. USA Chiller Market Revenues, By End User Industry, 2021-2031F, ($ Millions) |
| 13. Canada Chiller Market Revenues, By Heat Rejection Method/Type of Cooling, 2021-2031F, ($ Millions) |
| 14. Canada Chiller Market Revenues, By Compressor Type, 2021-2031F, ($ Millions) |
| 15. Canada Chiller Market Revenues, By End User Industry, 2021-2031F, ($ Millions) |
| 16. Rest of North America Chiller Market Revenues, By Heat Rejection Method/Type of Cooling, 2021-2031F, ($ Millions) |
| 17. Rest of North America Chiller Market Revenues, By Compressor Type, 2021-2031F, ($ Millions) |
| 18. Rest of North America Chiller Market Revenues, By End User Industry, 2021-2031F, ($ Millions) |
| 19. North America Data Center Primary Market Supply (MW), 2021-2025 |
| 20. Canada healthcare capital & North America life-sciences capex momentum, 2021–2025 |
| 21. USA Exports By Top 5 Countries, 2024 |
| 22. USA Import By Top 5 Countries, 2024 |
| 23 Canada Exports By Top 5 Countries, 2024 |
| 24. Canada Import By Top 5 Countries, 2024 |
Global Go To Market Strategy - 2030
Export potential enables firms to identify high-growth global markets with greater confidence by combining advanced trade intelligence with a structured quantitative methodology. The framework analyzes emerging demand trends and country-level import patterns while integrating macroeconomic and trade datasets such as GDP and population forecasts, bilateral import–export flows, tariff structures, elasticity differentials between developed and developing economies, geographic distance, and import demand projections. Using weighted trade values from 2020–2024 as the base period to project country-to-country export potential for 2030, these inputs are operationalized through calculated drivers such as gravity model parameters, tariff impact factors, and projected GDP per-capita growth. Through an analysis of hidden potentials, demand hotspots, and market conditions that are most favorable to success, this method enables firms to focus on target countries, maximize returns, and global expansion with data, backed by accuracy.
By factoring in the projected importer demand gap that is currently unmet and could be potential opportunity, it identifies the potential for the Exporter (Country) among 190 countries, against the general trade analysis, which identifies the biggest importer or exporter.
To discover high-growth global markets and optimize your business strategy:
Click Here
Pricing
- Single User License$ 4,560
- Department License$ 5,055
- Site License$ 5,595
- Global License$ 6,000

Leadership Perspectives from Industry Events
Search
Thought Leadership and Analyst Meet


Our Clients
6WResearch In News
- India Air Conditioner Market Set for Strong Rebound in 2026 After Weather-Led Correction and GST-Driven Recovery: 6Wresearch
- ADAS in India: How Automatic Emergency Braking, Blind Spot Detection & Driver Monitoring are Transforming Road Safety
- Doha a strategic location for EV manufacturing hub: IPA Qatar
- Demand for luxury TVs surging in the GCC, says Samsung
- Empowering Growth: The Thriving Journey of Bangladesh’s Cable Industry
- Demand for luxury TVs surging in the GCC, says Samsung
Latest Reports
- Nicaragua RPG Gaming Market (2026-2032)
- New Zealand RPG Gaming Market (2026-2032)
- Netherlands RPG Gaming Market (2026-2032)
- Nauru RPG Gaming Market (2026-2032)
- Namibia RPG Gaming Market (2026-2032)
- Mozambique RPG Gaming Market (2026-2032)
- Montenegro RPG Gaming Market (2026-2032)
- Mongolia RPG Gaming Market (2026-2032)
- Monaco RPG Gaming Market (2026-2032)
- Micronesia RPG Gaming Market (2026-2032)
Industry Events and Analyst Meet

EV India Expo 2026

HIMTEX 2026

India Refining Summit 2026

India EV Show 2026

EV tech India Expo 2026
Whitepaper
- Middle East & Africa Commercial Security Market Click here to view more.
- Middle East & Africa Fire Safety Systems & Equipment Market Click here to view more.
- GCC Drone Market Click here to view more.
- Middle East Lighting Fixture Market Click here to view more.
- GCC Physical & Perimeter Security Market Click here to view more.