Norway Boat & Ship MRO Market (2026-2032) | Trends, Outlook, Value, Competitive Landscape, Share, Analysis, Industry, Growth, Size & Revenue, Forecast, Companies, Segmentation
Market Forecast By Vessel Type (Boat, Yacht, Vessels, Other Vessel Types), By Vessel Application (Private, Commercial, Defense), By MRO Type (Engine MRO, Component MRO, Dry Dock MRO, Modifications, Other MRO Types) And Competitive Landscape
| Product Code: ETC8663280 | Publication Date: Sep 2024 | Updated Date: Apr 2026 | Product Type: Market Research Report | |
| Publisher: 6Wresearch | Author: Summon Dutta | No. of Pages: 75 | No. of Figures: 35 | No. of Tables: 20 |
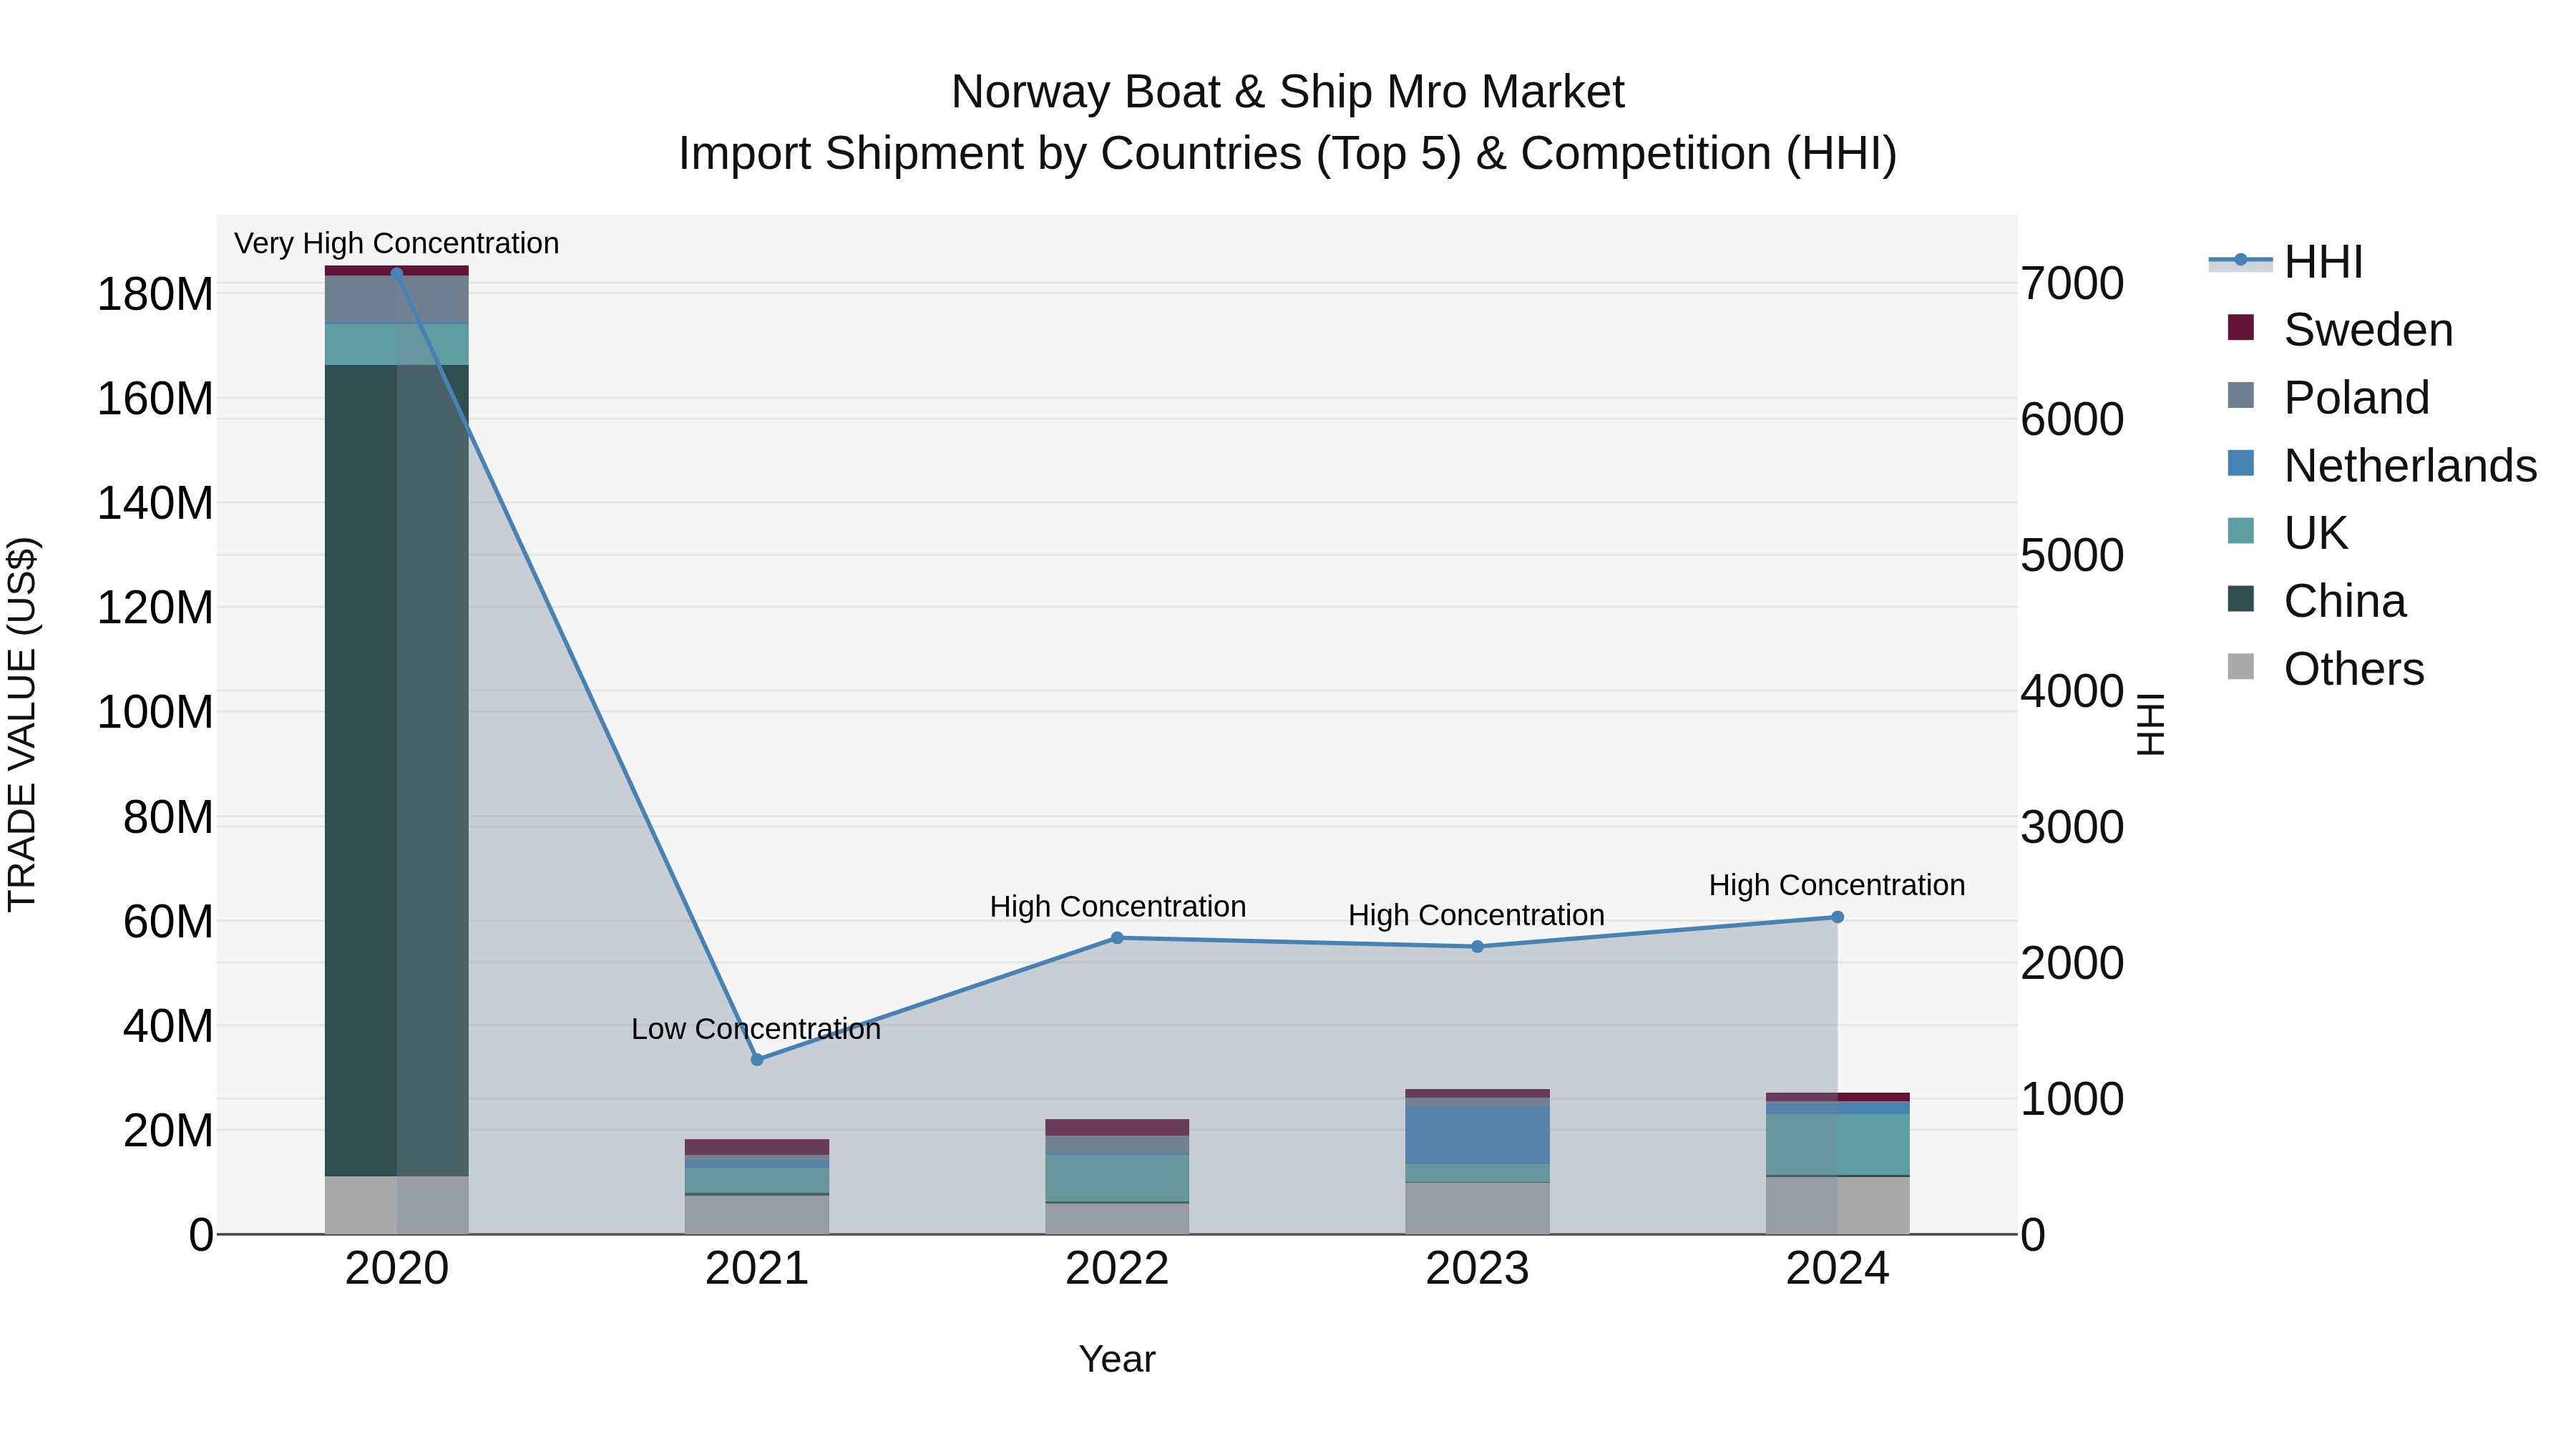
Norway Boat & Ship Mro Market Top 5 Importing Countries and Market Competition (HHI) Analysis
Norway`s boat and ship MRO import shipments in 2024 saw continued high concentration, with the top exporting countries being the UK, Estonia, USA, Netherlands, and Sweden. Despite a challenging CAGR of -38.16% from 2020 to 2024, there was a slight improvement in the growth rate from 2023 to 2024, showing signs of stabilization in the market. The data indicates the importance of monitoring trends and potential shifts in the industry to adapt to changing dynamics and remain competitive in the global market.
Key Highlights of the Report:
- Norway Boat & Ship MRO Market Outlook
- Market Size of Norway Boat & Ship MRO Market, 2025
- Forecast of Norway Boat & Ship MRO Market, 2032
- Historical Data and Forecast of Norway Boat & Ship MRO Revenues & Volume for the Period 2022 - 2032
- Norway Boat & Ship MRO Market Trend Evolution
- Norway Boat & Ship MRO Market Drivers and Challenges
- Norway Boat & Ship MRO Price Trends
- Norway Boat & Ship MRO Porter's Five Forces
- Norway Boat & Ship MRO Industry Life Cycle
- Historical Data and Forecast of Norway Boat & Ship MRO Market Revenues & Volume By Vessel Type for the Period 2022 - 2032
- Historical Data and Forecast of Norway Boat & Ship MRO Market Revenues & Volume By Boat for the Period 2022 - 2032
- Historical Data and Forecast of Norway Boat & Ship MRO Market Revenues & Volume By Yacht for the Period 2022 - 2032
- Historical Data and Forecast of Norway Boat & Ship MRO Market Revenues & Volume By Vessels for the Period 2022 - 2032
- Historical Data and Forecast of Norway Boat & Ship MRO Market Revenues & Volume By Other Vessel Types for the Period 2022 - 2032
- Historical Data and Forecast of Norway Boat & Ship MRO Market Revenues & Volume By Vessel Application for the Period 2022 - 2032
- Historical Data and Forecast of Norway Boat & Ship MRO Market Revenues & Volume By Private for the Period 2022 - 2032
- Historical Data and Forecast of Norway Boat & Ship MRO Market Revenues & Volume By Commercial for the Period 2022 - 2032
- Historical Data and Forecast of Norway Boat & Ship MRO Market Revenues & Volume By Defense for the Period 2022 - 2032
- Historical Data and Forecast of Norway Boat & Ship MRO Market Revenues & Volume By MRO Type for the Period 2022 - 2032
- Historical Data and Forecast of Norway Boat & Ship MRO Market Revenues & Volume By Engine MRO for the Period 2022 - 2032
- Historical Data and Forecast of Norway Boat & Ship MRO Market Revenues & Volume By Component MRO for the Period 2022 - 2032
- Historical Data and Forecast of Norway Boat & Ship MRO Market Revenues & Volume By Dry Dock MRO for the Period 2022 - 2032
- Historical Data and Forecast of Norway Boat & Ship MRO Market Revenues & Volume By Modifications for the Period 2022 - 2032
- Historical Data and Forecast of Norway Boat & Ship MRO Market Revenues & Volume By Other MRO Types for the Period 2022 - 2032
- Norway Boat & Ship MRO Import Export Trade Statistics
- Market Opportunity Assessment By Vessel Type
- Market Opportunity Assessment By Vessel Application
- Market Opportunity Assessment By MRO Type
- Norway Boat & Ship MRO Top Companies Market Share
- Norway Boat & Ship MRO Competitive Benchmarking By Technical and Operational Parameters
- Norway Boat & Ship MRO Company Profiles
- Norway Boat & Ship MRO Key Strategic Recommendations
Frequently Asked Questions About the Market Study (FAQs):
6Wresearch actively monitors the Norway Boat & Ship MRO Market and publishes its comprehensive annual report, highlighting emerging trends, growth drivers, revenue analysis, and forecast outlook. Our insights help businesses to make data-backed strategic decisions with ongoing market dynamics. Our analysts track relevent industries related to the Norway Boat & Ship MRO Market, allowing our clients with actionable intelligence and reliable forecasts tailored to emerging regional needs.
Yes, we provide customisation as per your requirements. To learn more, feel free to contact us on sales@6wresearch.com
1 Executive Summary |
2 Introduction |
2.1 Key Highlights of the Report |
2.2 Report Description |
2.3 Market Scope & Segmentation |
2.4 Research Methodology |
2.5 Assumptions |
3 Norway Boat & Ship MRO Market Overview |
3.1 Norway Country Macro Economic Indicators |
3.2 Norway Boat & Ship MRO Market Revenues & Volume, 2022 & 2032F |
3.3 Norway Boat & Ship MRO Market - Industry Life Cycle |
3.4 Norway Boat & Ship MRO Market - Porter's Five Forces |
3.5 Norway Boat & Ship MRO Market Revenues & Volume Share, By Vessel Type, 2022 & 2032F |
3.6 Norway Boat & Ship MRO Market Revenues & Volume Share, By Vessel Application, 2022 & 2032F |
3.7 Norway Boat & Ship MRO Market Revenues & Volume Share, By MRO Type, 2022 & 2032F |
4 Norway Boat & Ship MRO Market Dynamics |
4.1 Impact Analysis |
4.2 Market Drivers |
4.2.1 Growing demand for maintenance, repair, and overhaul (MRO) services in the maritime industry due to increasing maritime activities in Norway. |
4.2.2 Technological advancements in MRO services leading to more efficient and cost-effective solutions. |
4.2.3 Government initiatives and regulations promoting sustainable practices in the maritime sector, driving the need for regular MRO activities. |
4.2.4 Increasing focus on safety and compliance standards, necessitating regular maintenance and inspection of boats and ships in Norway. |
4.3 Market Restraints |
4.3.1 High initial capital investment required for setting up MRO facilities and acquiring advanced technology. |
4.3.2 Fluctuating raw material prices impacting the overall cost of MRO services. |
4.3.3 Intense competition among MRO service providers leading to pricing pressures and margin erosion. |
4.3.4 Dependency on seasonal demand patterns, affecting the stability of revenues for boat and ship MRO companies. |
5 Norway Boat & Ship MRO Market Trends |
6 Norway Boat & Ship MRO Market, By Types |
6.1 Norway Boat & Ship MRO Market, By Vessel Type |
6.1.1 Overview and Analysis |
6.1.2 Norway Boat & Ship MRO Market Revenues & Volume, By Vessel Type, 2022 - 2032F |
6.1.3 Norway Boat & Ship MRO Market Revenues & Volume, By Boat, 2022 - 2032F |
6.1.4 Norway Boat & Ship MRO Market Revenues & Volume, By Yacht, 2022 - 2032F |
6.1.5 Norway Boat & Ship MRO Market Revenues & Volume, By Vessels, 2022 - 2032F |
6.1.6 Norway Boat & Ship MRO Market Revenues & Volume, By Other Vessel Types, 2022 - 2032F |
6.2 Norway Boat & Ship MRO Market, By Vessel Application |
6.2.1 Overview and Analysis |
6.2.2 Norway Boat & Ship MRO Market Revenues & Volume, By Private, 2022 - 2032F |
6.2.3 Norway Boat & Ship MRO Market Revenues & Volume, By Commercial, 2022 - 2032F |
6.2.4 Norway Boat & Ship MRO Market Revenues & Volume, By Defense, 2022 - 2032F |
6.3 Norway Boat & Ship MRO Market, By MRO Type |
6.3.1 Overview and Analysis |
6.3.2 Norway Boat & Ship MRO Market Revenues & Volume, By Engine MRO, 2022 - 2032F |
6.3.3 Norway Boat & Ship MRO Market Revenues & Volume, By Component MRO, 2022 - 2032F |
6.3.4 Norway Boat & Ship MRO Market Revenues & Volume, By Dry Dock MRO, 2022 - 2032F |
6.3.5 Norway Boat & Ship MRO Market Revenues & Volume, By Modifications, 2022 - 2032F |
6.3.6 Norway Boat & Ship MRO Market Revenues & Volume, By Other MRO Types, 2022 - 2032F |
7 Norway Boat & Ship MRO Market Import-Export Trade Statistics |
7.1 Norway Boat & Ship MRO Market Export to Major Countries |
7.2 Norway Boat & Ship MRO Market Imports from Major Countries |
8 Norway Boat & Ship MRO Market Key Performance Indicators |
8.1 Average turnaround time for MRO services, indicating operational efficiency and customer satisfaction. |
8.2 Percentage of repeat customers, reflecting the quality and reliability of MRO services provided. |
8.3 Employee training hours invested in new technologies and industry best practices, showcasing the commitment to innovation and skill development. |
8.4 Maintenance cost per vessel, helping in monitoring cost-effectiveness and profitability of MRO operations. |
8.5 Percentage of on-time deliveries, measuring the reliability and effectiveness of MRO service providers in meeting customer deadlines. |
9 Norway Boat & Ship MRO Market - Opportunity Assessment |
9.1 Norway Boat & Ship MRO Market Opportunity Assessment, By Vessel Type, 2022 & 2032F |
9.2 Norway Boat & Ship MRO Market Opportunity Assessment, By Vessel Application, 2022 & 2032F |
9.3 Norway Boat & Ship MRO Market Opportunity Assessment, By MRO Type, 2022 & 2032F |
10 Norway Boat & Ship MRO Market - Competitive Landscape |
10.1 Norway Boat & Ship MRO Market Revenue Share, By Companies, 2025 |
10.2 Norway Boat & Ship MRO Market Competitive Benchmarking, By Operating and Technical Parameters |
11 Company Profiles |
12 Recommendations |
13 Disclaimer |
Export potential assessment - trade Analytics for 2030
Export potential enables firms to identify high-growth global markets with greater confidence by combining advanced trade intelligence with a structured quantitative methodology. The framework analyzes emerging demand trends and country-level import patterns while integrating macroeconomic and trade datasets such as GDP and population forecasts, bilateral import–export flows, tariff structures, elasticity differentials between developed and developing economies, geographic distance, and import demand projections. Using weighted trade values from 2020–2024 as the base period to project country-to-country export potential for 2030, these inputs are operationalized through calculated drivers such as gravity model parameters, tariff impact factors, and projected GDP per-capita growth. Through an analysis of hidden potentials, demand hotspots, and market conditions that are most favorable to success, this method enables firms to focus on target countries, maximize returns, and global expansion with data, backed by accuracy.
By factoring in the projected importer demand gap that is currently unmet and could be potential opportunity, it identifies the potential for the Exporter (Country) among 190 countries, against the general trade analysis, which identifies the biggest importer or exporter.
To discover high-growth global markets and optimize your business strategy:
Click Here
Pricing
- Single User License$ 1,995
- Department License$ 2,400
- Site License$ 3,120
- Global License$ 3,795

Search
Thought Leadership and Analyst Meet


Our Clients
Latest Reports
- France Thermally Conductive Filler Dispersants Market (2026-2032) | Challenges, Restraints, Value, Share, Size, segmentation, Analysis, Trends, Investment Opportunities, Outlook, Pricing, Demand, Forecast, Revenue, Companies, Growth, Drivers, Strategy, Insights, Competition
- Egypt Thermally Conductive Filler Dispersants Market (2026-2032) | Competition, Forecast, Strategy, Value, Insights, Outlook, Investment Opportunities, Pricing, Demand, Share, segmentation, Drivers, Size, Companies, Restraints, Growth, Trends, Revenue, Challenges, Analysis
- Czech Republic Thermally Conductive Filler Dispersants Market (2026-2032) | Forecast, Pricing, Analysis, Drivers, Insights, Size, Demand, Growth, Challenges, segmentation, Competition, Outlook, Trends, Investment Opportunities, Companies, Strategy, Revenue, Share, Value, Restraints
- Colombia Thermally Conductive Filler Dispersants Market (2026-2032) | segmentation, Trends, Share, Drivers, Strategy, Companies, Demand, Insights, Size, Challenges, Value, Competition, Analysis, Growth, Revenue, Restraints, Forecast, Pricing, Outlook, Investment Opportunities
- China Thermally Conductive Filler Dispersants Market (2026-2032) | Restraints, Investment Opportunities, Pricing, Companies, Share, Size, Challenges, Trends, Outlook, Value, Analysis, Competition, Revenue, Drivers, Forecast, Demand, Insights, Growth, Strategy, segmentation
- Chile Thermally Conductive Filler Dispersants Market (2026-2032) | Investment Opportunities, Trends, Value, Restraints, Share, Companies, Forecast, segmentation, Pricing, Challenges, Demand, Size, Analysis, Drivers, Outlook, Growth, Competition, Strategy, Revenue, Insights
- Cambodia Thermally Conductive Filler Dispersants Market (2026-2032) | Analysis, Share, Outlook, Strategy, Pricing, Demand, Size, Growth, segmentation, Insights, Revenue, Forecast, Challenges, Competition, Companies, Investment Opportunities, Trends, Restraints, Value, Drivers
- Brazil Thermally Conductive Filler Dispersants Market (2026-2032) | Restraints, Forecast, Competition, Size, Revenue, Value, Investment Opportunities, Trends, Insights, Outlook, Growth, Analysis, Drivers, segmentation, Pricing, Challenges, Strategy, Share, Companies, Demand
- Bangladesh Thermally Conductive Filler Dispersants Market (2026-2032) | Restraints, Trends, Analysis, Competition, Insights, Forecast, Value, Investment Opportunities, Pricing, Share, Demand, Outlook, Revenue, segmentation, Companies, Drivers, Growth, Size, Challenges, Strategy
- Bahrain Thermally Conductive Filler Dispersants Market (2026-2032) | Trends, Outlook, Pricing, Demand, Value, Competition, Forecast, Growth, segmentation, Revenue, Companies, Analysis, Insights, Size, Drivers, Challenges, Strategy, Investment Opportunities, Share, Restraints
Industry Events and Analyst Meet

HIMTEX 2026

India Refining Summit 2026

India EV Show 2026

EV tech India Expo 2026

Auto Tech Asia 2026
Whitepaper
- Middle East & Africa Commercial Security Market Click here to view more.
- Middle East & Africa Fire Safety Systems & Equipment Market Click here to view more.
- GCC Drone Market Click here to view more.
- Middle East Lighting Fixture Market Click here to view more.
- GCC Physical & Perimeter Security Market Click here to view more.
6WResearch In News
- Doha a strategic location for EV manufacturing hub: IPA Qatar
- Demand for luxury TVs surging in the GCC, says Samsung
- Empowering Growth: The Thriving Journey of Bangladesh’s Cable Industry
- Demand for luxury TVs surging in the GCC, says Samsung
- Video call with a traditional healer? Once unthinkable, it’s now common in South Africa
- Intelligent Buildings To Smooth GCC’s Path To Net Zero