Norway Glutathione Market (2026-2032) | Value, Trends, Industry, Forecast, Size & Revenue, Competitive Landscape, Outlook, Analysis, Growth, Segmentation, Companies, Share
Market Forecast By Product Type (Reduced Glutathione (GSH), Oxidized Glutathione (GSSG), Liposomal Glutathione, N-acetylcysteine (NAC), S-Acetyl Glutathione), By Product Form (Oral Capsules or Tablets, Lozenges, Liquids, Intravenous (IV) Glutathione, Topical Creams, Inhalation), By End-use Application (Nutritional Supplements/ Nutraceutical Supplements, Skin Care, Respiratory Health, Intravenous (IV) Therapy, Sports Nutrition, Chronic Illness Management, Cosmetics, Food Preservation) And Competitive Landscape
| Product Code: ETC8669228 | Publication Date: Sep 2024 | Updated Date: Apr 2026 | Product Type: Market Research Report | |
| Publisher: 6Wresearch | Author: Dhaval Chaurasia | No. of Pages: 75 | No. of Figures: 35 | No. of Tables: 20 |
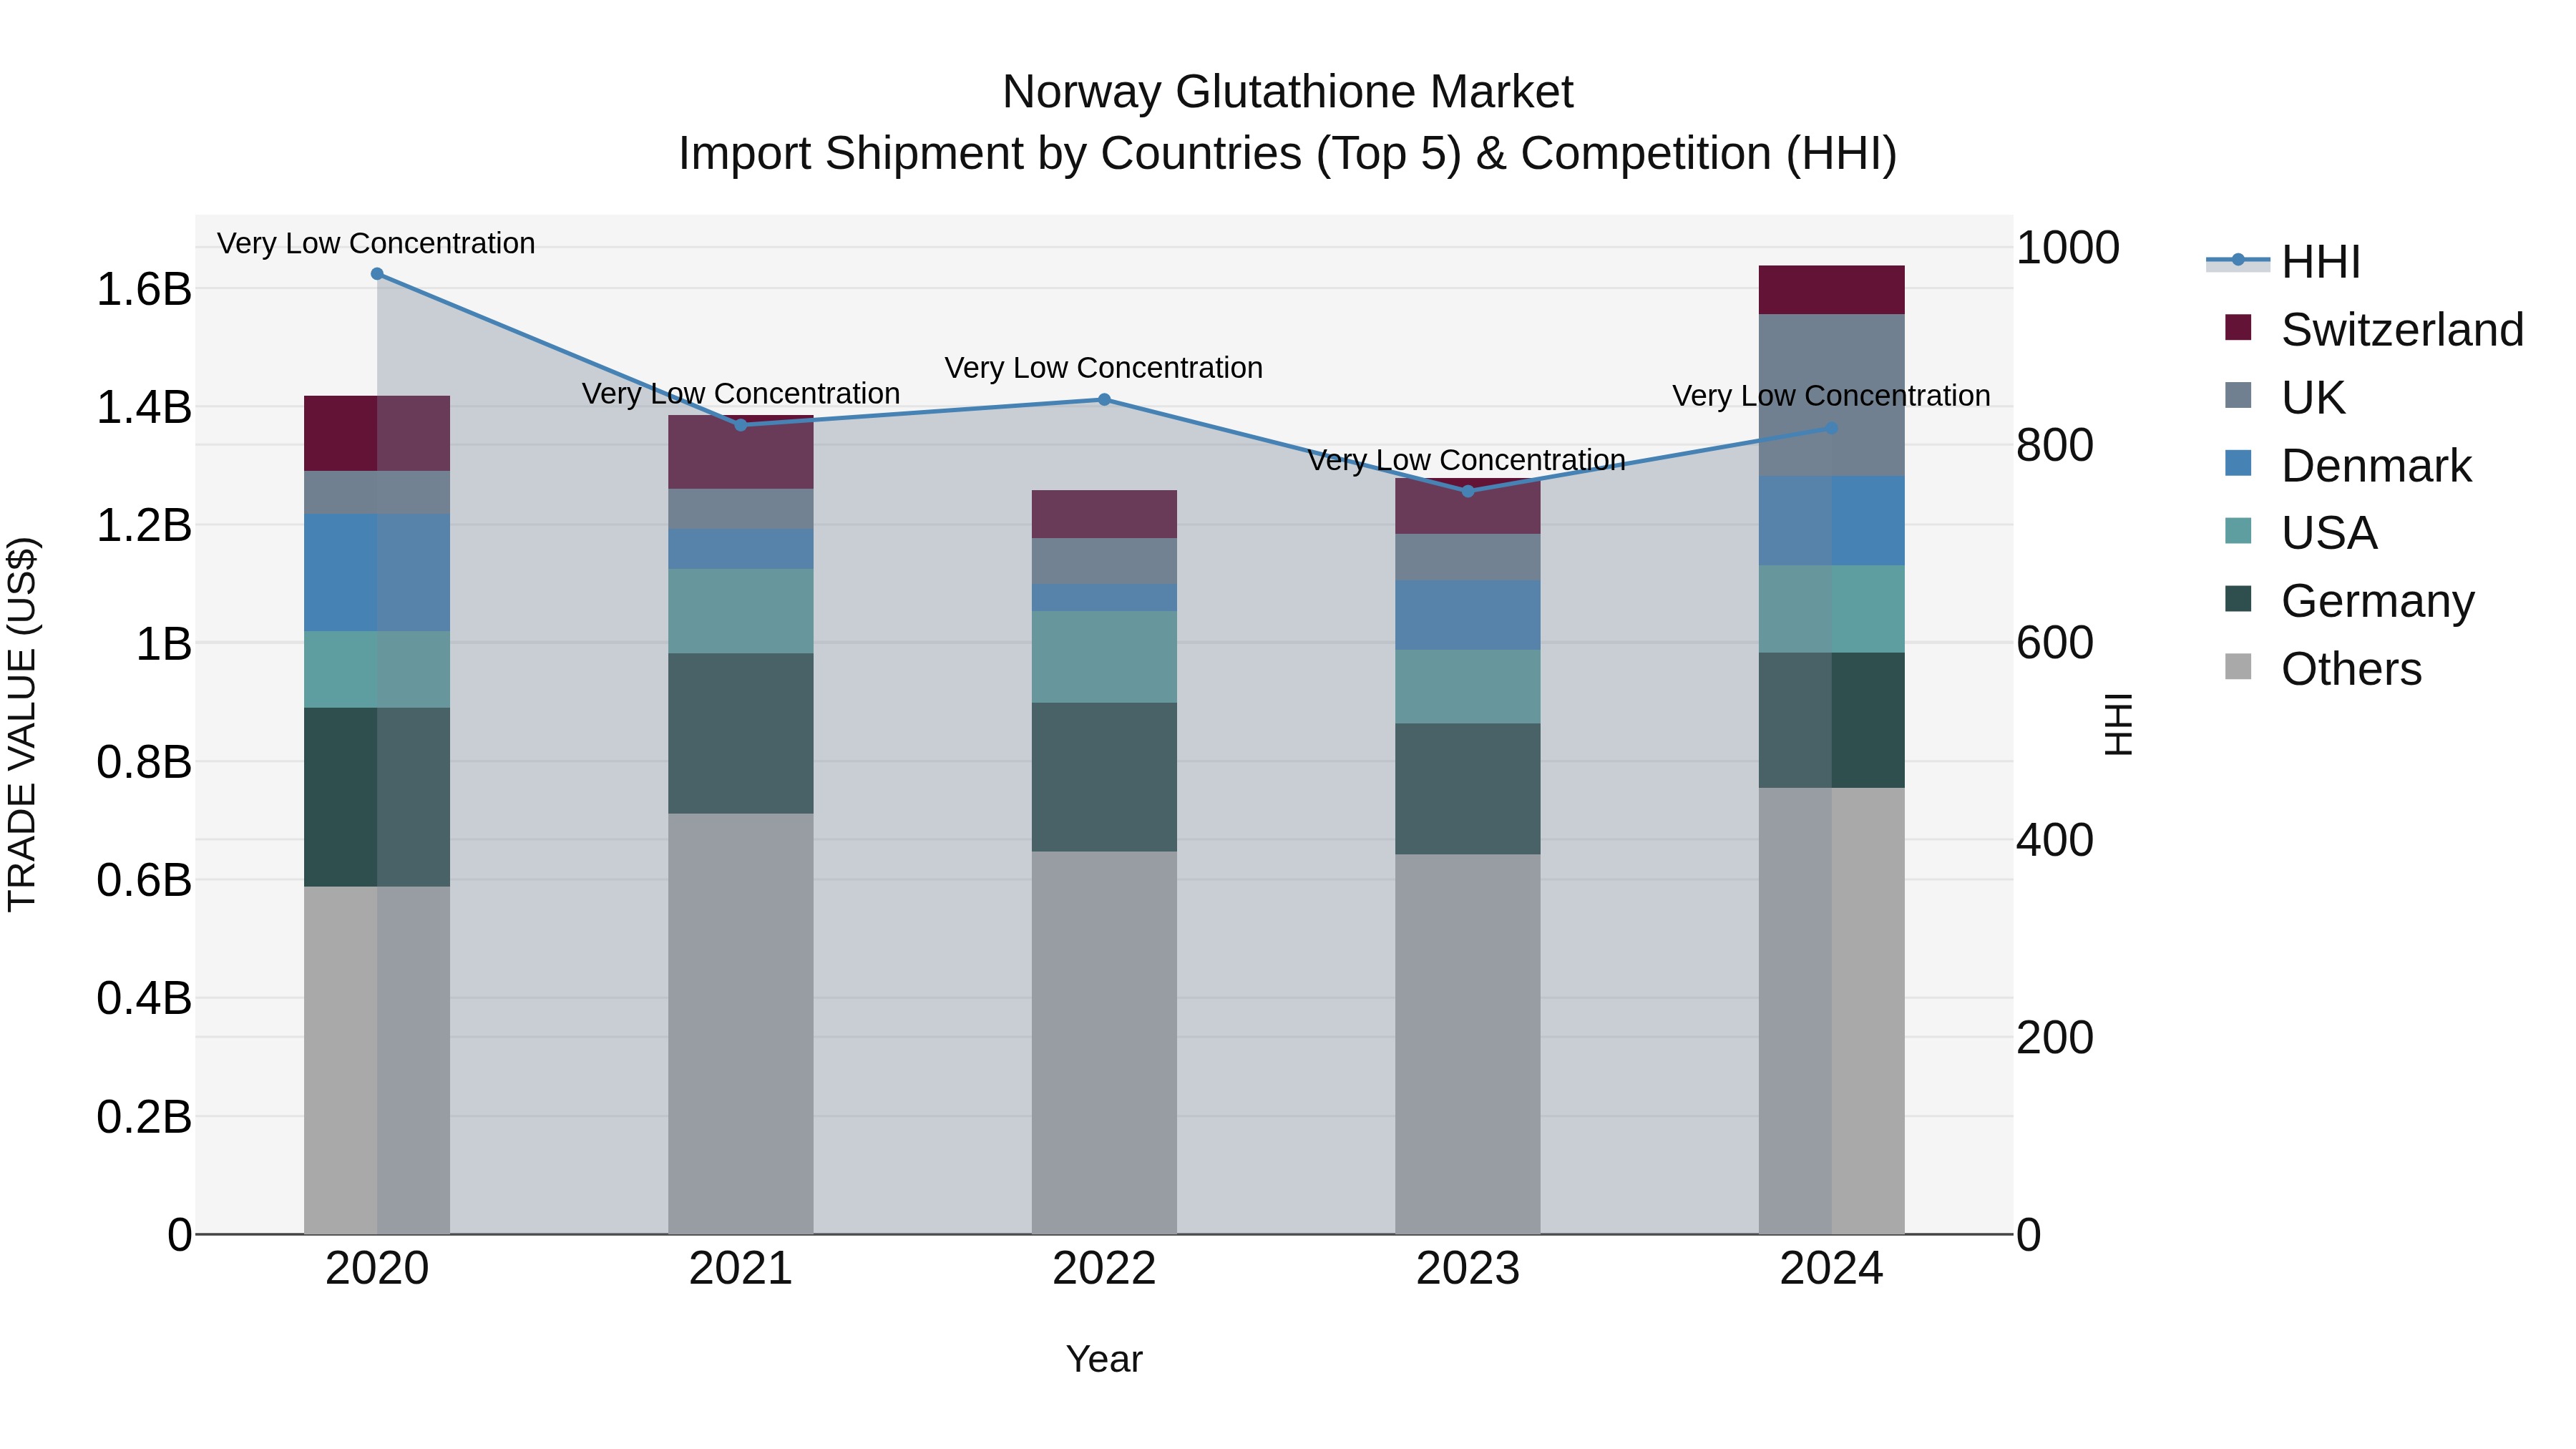
Norway Glutathione Market Top 5 Importing Countries and Market Competition (HHI) Analysis
In 2024, Norway`s glutathione import market continues to show steady growth with a diverse range of top exporting countries including the UK, Germany, Denmark, USA, and Metropolitan France. The market remains competitive with a low Herfindahl-Hirschman Index (HHI) concentration, indicating a balanced import distribution. The compound annual growth rate (CAGR) from 2020 to 2024 is a healthy 3.68%, with a notable growth spurt of 28.06% from 2023 to 2024. This data suggests a positive outlook for the Norwegian market for glutathione imports, showcasing opportunities for further expansion and development.
Key Highlights of the Report:
- Norway Glutathione Market Outlook
- Market Size of Norway Glutathione Market, 2025
- Forecast of Norway Glutathione Market, 2032
- Historical Data and Forecast of Norway Glutathione Revenues & Volume for the Period 2022 - 2032
- Norway Glutathione Market Trend Evolution
- Norway Glutathione Market Drivers and Challenges
- Norway Glutathione Price Trends
- Norway Glutathione Porter's Five Forces
- Norway Glutathione Industry Life Cycle
- Historical Data and Forecast of Norway Glutathione Market Revenues & Volume By Product Type for the Period 2022 - 2032
- Historical Data and Forecast of Norway Glutathione Market Revenues & Volume By Reduced Glutathione (GSH) for the Period 2022 - 2032
- Historical Data and Forecast of Norway Glutathione Market Revenues & Volume By Oxidized Glutathione (GSSG) for the Period 2022 - 2032
- Historical Data and Forecast of Norway Glutathione Market Revenues & Volume By Liposomal Glutathione for the Period 2022 - 2032
- Historical Data and Forecast of Norway Glutathione Market Revenues & Volume By N-acetylcysteine (NAC) for the Period 2022 - 2032
- Historical Data and Forecast of Norway Glutathione Market Revenues & Volume By S-Acetyl Glutathione for the Period 2022 - 2032
- Historical Data and Forecast of Norway Glutathione Market Revenues & Volume By Product Form for the Period 2022 - 2032
- Historical Data and Forecast of Norway Glutathione Market Revenues & Volume By Oral Capsules or Tablets for the Period 2022 - 2032
- Historical Data and Forecast of Norway Glutathione Market Revenues & Volume By Lozenges for the Period 2022 - 2032
- Historical Data and Forecast of Norway Glutathione Market Revenues & Volume By Liquids for the Period 2022 - 2032
- Historical Data and Forecast of Norway Glutathione Market Revenues & Volume By Intravenous (IV) Glutathione for the Period 2022 - 2032
- Historical Data and Forecast of Norway Glutathione Market Revenues & Volume By Topical Creams for the Period 2022 - 2032
- Historical Data and Forecast of Norway Glutathione Market Revenues & Volume By Inhalation for the Period 2022 - 2032
- Historical Data and Forecast of Norway Glutathione Market Revenues & Volume By End-use Application for the Period 2022 - 2032
- Historical Data and Forecast of Norway Glutathione Market Revenues & Volume By Nutritional Supplements/ Nutraceutical Supplements for the Period 2022 - 2032
- Historical Data and Forecast of Norway Glutathione Market Revenues & Volume By Skin Care for the Period 2022 - 2032
- Historical Data and Forecast of Norway Glutathione Market Revenues & Volume By Respiratory Health for the Period 2022 - 2032
- Historical Data and Forecast of Norway Glutathione Market Revenues & Volume By Intravenous (IV) Therapy for the Period 2022 - 2032
- Historical Data and Forecast of Norway Glutathione Market Revenues & Volume By Sports Nutrition for the Period 2022 - 2032
- Historical Data and Forecast of Norway Glutathione Market Revenues & Volume By Chronic Illness Management for the Period 2022 - 2032
- Historical Data and Forecast of Norway Glutathione Market Revenues & Volume By Cosmetics for the Period 2022 - 2032
- Historical Data and Forecast of Norway Glutathione Market Revenues & Volume By Food Preservation for the Period 2022 - 2032
- Norway Glutathione Import Export Trade Statistics
- Market Opportunity Assessment By Product Type
- Market Opportunity Assessment By Product Form
- Market Opportunity Assessment By End-use Application
- Norway Glutathione Top Companies Market Share
- Norway Glutathione Competitive Benchmarking By Technical and Operational Parameters
- Norway Glutathione Company Profiles
- Norway Glutathione Key Strategic Recommendations
Frequently Asked Questions About the Market Study (FAQs):
6Wresearch actively monitors the Norway Glutathione Market and publishes its comprehensive annual report, highlighting emerging trends, growth drivers, revenue analysis, and forecast outlook. Our insights help businesses to make data-backed strategic decisions with ongoing market dynamics. Our analysts track relevent industries related to the Norway Glutathione Market, allowing our clients with actionable intelligence and reliable forecasts tailored to emerging regional needs.
Yes, we provide customisation as per your requirements. To learn more, feel free to contact us on sales@6wresearch.com
1 Executive Summary |
2 Introduction |
2.1 Key Highlights of the Report |
2.2 Report Description |
2.3 Market Scope & Segmentation |
2.4 Research Methodology |
2.5 Assumptions |
3 Norway Glutathione Market Overview |
3.1 Norway Country Macro Economic Indicators |
3.2 Norway Glutathione Market Revenues & Volume, 2022 & 2032F |
3.3 Norway Glutathione Market - Industry Life Cycle |
3.4 Norway Glutathione Market - Porter's Five Forces |
3.5 Norway Glutathione Market Revenues & Volume Share, By Product Type, 2022 & 2032F |
3.6 Norway Glutathione Market Revenues & Volume Share, By Product Form, 2022 & 2032F |
3.7 Norway Glutathione Market Revenues & Volume Share, By End-use Application, 2022 & 2032F |
4 Norway Glutathione Market Dynamics |
4.1 Impact Analysis |
4.2 Market Drivers |
4.2.1 Increasing awareness about the health benefits of glutathione |
4.2.2 Growing demand for skincare and beauty products containing glutathione |
4.2.3 Rising prevalence of chronic diseases driving the use of glutathione supplements |
4.3 Market Restraints |
4.3.1 High cost of glutathione products limiting affordability for some consumers |
4.3.2 Limited availability of authentic and high-quality glutathione products in the market |
5 Norway Glutathione Market Trends |
6 Norway Glutathione Market, By Types |
6.1 Norway Glutathione Market, By Product Type |
6.1.1 Overview and Analysis |
6.1.2 Norway Glutathione Market Revenues & Volume, By Product Type, 2022 - 2032F |
6.1.3 Norway Glutathione Market Revenues & Volume, By Reduced Glutathione (GSH), 2022 - 2032F |
6.1.4 Norway Glutathione Market Revenues & Volume, By Oxidized Glutathione (GSSG), 2022 - 2032F |
6.1.5 Norway Glutathione Market Revenues & Volume, By Liposomal Glutathione, 2022 - 2032F |
6.1.6 Norway Glutathione Market Revenues & Volume, By N-acetylcysteine (NAC), 2022 - 2032F |
6.1.7 Norway Glutathione Market Revenues & Volume, By S-Acetyl Glutathione, 2022 - 2032F |
6.2 Norway Glutathione Market, By Product Form |
6.2.1 Overview and Analysis |
6.2.2 Norway Glutathione Market Revenues & Volume, By Oral Capsules or Tablets, 2022 - 2032F |
6.2.3 Norway Glutathione Market Revenues & Volume, By Lozenges, 2022 - 2032F |
6.2.4 Norway Glutathione Market Revenues & Volume, By Liquids, 2022 - 2032F |
6.2.5 Norway Glutathione Market Revenues & Volume, By Intravenous (IV) Glutathione, 2022 - 2032F |
6.2.6 Norway Glutathione Market Revenues & Volume, By Topical Creams, 2022 - 2032F |
6.2.7 Norway Glutathione Market Revenues & Volume, By Inhalation, 2022 - 2032F |
6.3 Norway Glutathione Market, By End-use Application |
6.3.1 Overview and Analysis |
6.3.2 Norway Glutathione Market Revenues & Volume, By Nutritional Supplements/ Nutraceutical Supplements, 2022 - 2032F |
6.3.3 Norway Glutathione Market Revenues & Volume, By Skin Care, 2022 - 2032F |
6.3.4 Norway Glutathione Market Revenues & Volume, By Respiratory Health, 2022 - 2032F |
6.3.5 Norway Glutathione Market Revenues & Volume, By Intravenous (IV) Therapy, 2022 - 2032F |
6.3.6 Norway Glutathione Market Revenues & Volume, By Sports Nutrition, 2022 - 2032F |
6.3.7 Norway Glutathione Market Revenues & Volume, By Chronic Illness Management, 2022 - 2032F |
6.3.8 Norway Glutathione Market Revenues & Volume, By Food Preservation, 2022 - 2032F |
6.3.9 Norway Glutathione Market Revenues & Volume, By Food Preservation, 2022 - 2032F |
6.3.10 Norway Glutathione Market Revenues & Volume, By Pharmaceuticals, 2022 - 2032F |
7 Norway Glutathione Market Import-Export Trade Statistics |
7.1 Norway Glutathione Market Export to Major Countries |
7.2 Norway Glutathione Market Imports from Major Countries |
8 Norway Glutathione Market Key Performance Indicators |
8.1 Number of health and wellness publications featuring glutathione benefits |
8.2 Growth in the sales of skincare and beauty products containing glutathione |
8.3 Increase in the number of clinical studies highlighting the efficacy of glutathione in managing chronic diseases |
9 Norway Glutathione Market - Opportunity Assessment |
9.1 Norway Glutathione Market Opportunity Assessment, By Product Type, 2022 & 2032F |
9.2 Norway Glutathione Market Opportunity Assessment, By Product Form, 2022 & 2032F |
9.3 Norway Glutathione Market Opportunity Assessment, By End-use Application, 2022 & 2032F |
10 Norway Glutathione Market - Competitive Landscape |
10.1 Norway Glutathione Market Revenue Share, By Companies, 2025 |
10.2 Norway Glutathione Market Competitive Benchmarking, By Operating and Technical Parameters |
11 Company Profiles |
12 Recommendations |
13 Disclaimer |
Export potential assessment - trade Analytics for 2030
Export potential enables firms to identify high-growth global markets with greater confidence by combining advanced trade intelligence with a structured quantitative methodology. The framework analyzes emerging demand trends and country-level import patterns while integrating macroeconomic and trade datasets such as GDP and population forecasts, bilateral import–export flows, tariff structures, elasticity differentials between developed and developing economies, geographic distance, and import demand projections. Using weighted trade values from 2020–2024 as the base period to project country-to-country export potential for 2030, these inputs are operationalized through calculated drivers such as gravity model parameters, tariff impact factors, and projected GDP per-capita growth. Through an analysis of hidden potentials, demand hotspots, and market conditions that are most favorable to success, this method enables firms to focus on target countries, maximize returns, and global expansion with data, backed by accuracy.
By factoring in the projected importer demand gap that is currently unmet and could be potential opportunity, it identifies the potential for the Exporter (Country) among 190 countries, against the general trade analysis, which identifies the biggest importer or exporter.
To discover high-growth global markets and optimize your business strategy:
Click Here
Pricing
- Single User License$ 1,995
- Department License$ 2,400
- Site License$ 3,120
- Global License$ 3,795

Search
Thought Leadership and Analyst Meet


Our Clients
Latest Reports
- China Electric Appliance Rental Market (2026-2032) | Trends, Revenue, Growth, Challenges, Size, Value, Outlook, Pricing, Strategy, Insights, Restraints, segmentation, Companies, Investment Opportunities, Analysis, Demand, Drivers, Competition, Forecast, Share
- Chile Electric Appliance Rental Market (2026-2032) | Outlook, Competition, Drivers, Strategy, Revenue, Analysis, Value, Pricing, Restraints, Size, Demand, Share, Growth, Forecast, Challenges, Insights, Investment Opportunities, Companies, Trends, segmentation
- Cambodia Electric Appliance Rental Market (2026-2032) | Companies, Analysis, Restraints, Pricing, Insights, Challenges, Outlook, Strategy, Forecast, Trends, Competition, Value, Revenue, Investment Opportunities, segmentation, Drivers, Size, Demand, Growth, Share
- Brazil Electric Appliance Rental Market (2026-2032) | Revenue, Strategy, Forecast, Companies, segmentation, Competition, Size, Investment Opportunities, Pricing, Restraints, Outlook, Challenges, Analysis, Drivers, Value, Demand, Insights, Trends, Growth, Share
- Bangladesh Electric Appliance Rental Market (2026-2032) | Drivers, Forecast, Investment Opportunities, Strategy, Insights, Demand, Challenges, Outlook, Trends, Competition, Value, Revenue, Size, Pricing, Analysis, Companies, Restraints, segmentation, Share, Growth
- Bahrain Electric Appliance Rental Market (2026-2032) | Outlook, Size, Competition, Restraints, Drivers, Value, Trends, Investment Opportunities, Insights, Forecast, Revenue, Strategy, Growth, Share, Demand, Analysis, Challenges, Companies, segmentation, Pricing
- Azerbaijan Electric Appliance Rental Market (2026-2032) | Trends, Investment Opportunities, Restraints, Insights, Strategy, Competition, Value, Growth, Demand, Drivers, Analysis, Forecast, Size, Share, Outlook, segmentation, Pricing, Challenges, Revenue, Companies
- Australia Electric Appliance Rental Market (2026-2032) | Challenges, Restraints, Forecast, Demand, Size, Competition, Pricing, Investment Opportunities, Revenue, Trends, Drivers, Growth, Outlook, Analysis, Strategy, Value, segmentation, Insights, Companies, Share
- Argentina Electric Appliance Rental Market (2026-2032) | Growth, Trends, Insights, Outlook, Forecast, Size, Drivers, Analysis, Restraints, Challenges, Share, Revenue, Investment Opportunities, Strategy, Demand, Value, Companies, segmentation, Competition, Pricing
- Algeria Electric Appliance Rental Market (2026-2032) | Share, Size, Value, Strategy, Competition, Outlook, Challenges, Companies, Trends, Pricing, Insights, Forecast, Investment Opportunities, Revenue, Growth, Restraints, segmentation, Analysis, Demand, Drivers
Industry Events and Analyst Meet

HIMTEX 2026

India Refining Summit 2026

India EV Show 2026

EV tech India Expo 2026

Auto Tech Asia 2026
Whitepaper
- Middle East & Africa Commercial Security Market Click here to view more.
- Middle East & Africa Fire Safety Systems & Equipment Market Click here to view more.
- GCC Drone Market Click here to view more.
- Middle East Lighting Fixture Market Click here to view more.
- GCC Physical & Perimeter Security Market Click here to view more.
6WResearch In News
- Doha a strategic location for EV manufacturing hub: IPA Qatar
- Demand for luxury TVs surging in the GCC, says Samsung
- Empowering Growth: The Thriving Journey of Bangladesh’s Cable Industry
- Demand for luxury TVs surging in the GCC, says Samsung
- Video call with a traditional healer? Once unthinkable, it’s now common in South Africa
- Intelligent Buildings To Smooth GCC’s Path To Net Zero