Norway Ink Market (2025-2031) | Trends, Forecast, Segmentation, Industry, Size, Outlook, Companies, Growth, Value, Share, Analysis & Revenue
Market Forecast By Technology (Lithographic , Flexographic , Gravure, Digital, Letterpress, Others), By Ink Type (Oil Based, Solvent Based, Water Based), By Applications (Label And Packaging, Commercial Printing, Publications, Others) And Competitive Landscape
| Product Code: ETC5099036 | Publication Date: Nov 2023 | Updated Date: Sep 2025 | Product Type: Market Research Report | |
| Publisher: 6Wresearch | Author: Sachin Kumar Rai | No. of Pages: 60 | No. of Figures: 30 | No. of Tables: 5 |
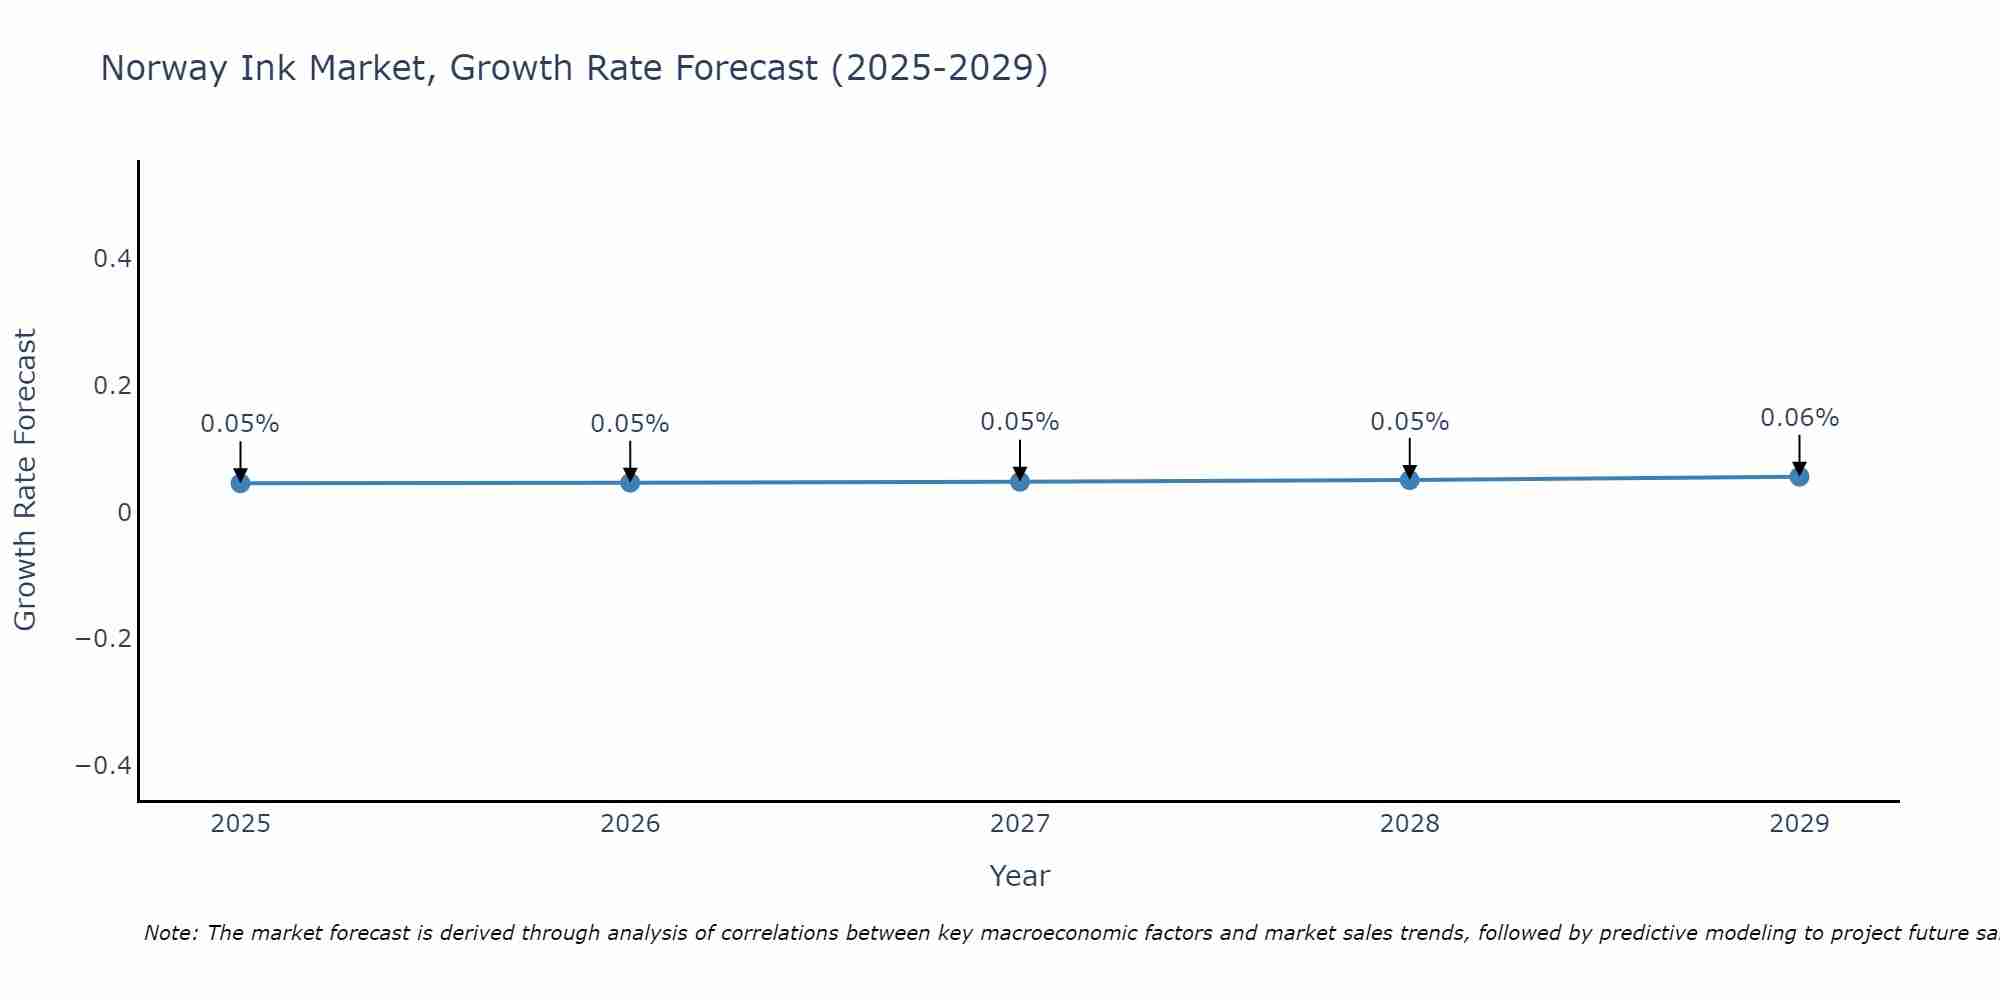
Norway Ink Market Size Growth Rate
The Norway Ink Market is poised for steady growth rate improvements from 2025 to 2029. From 0.05% in 2025, the growth rate steadily ascends to 0.06% in 2029.
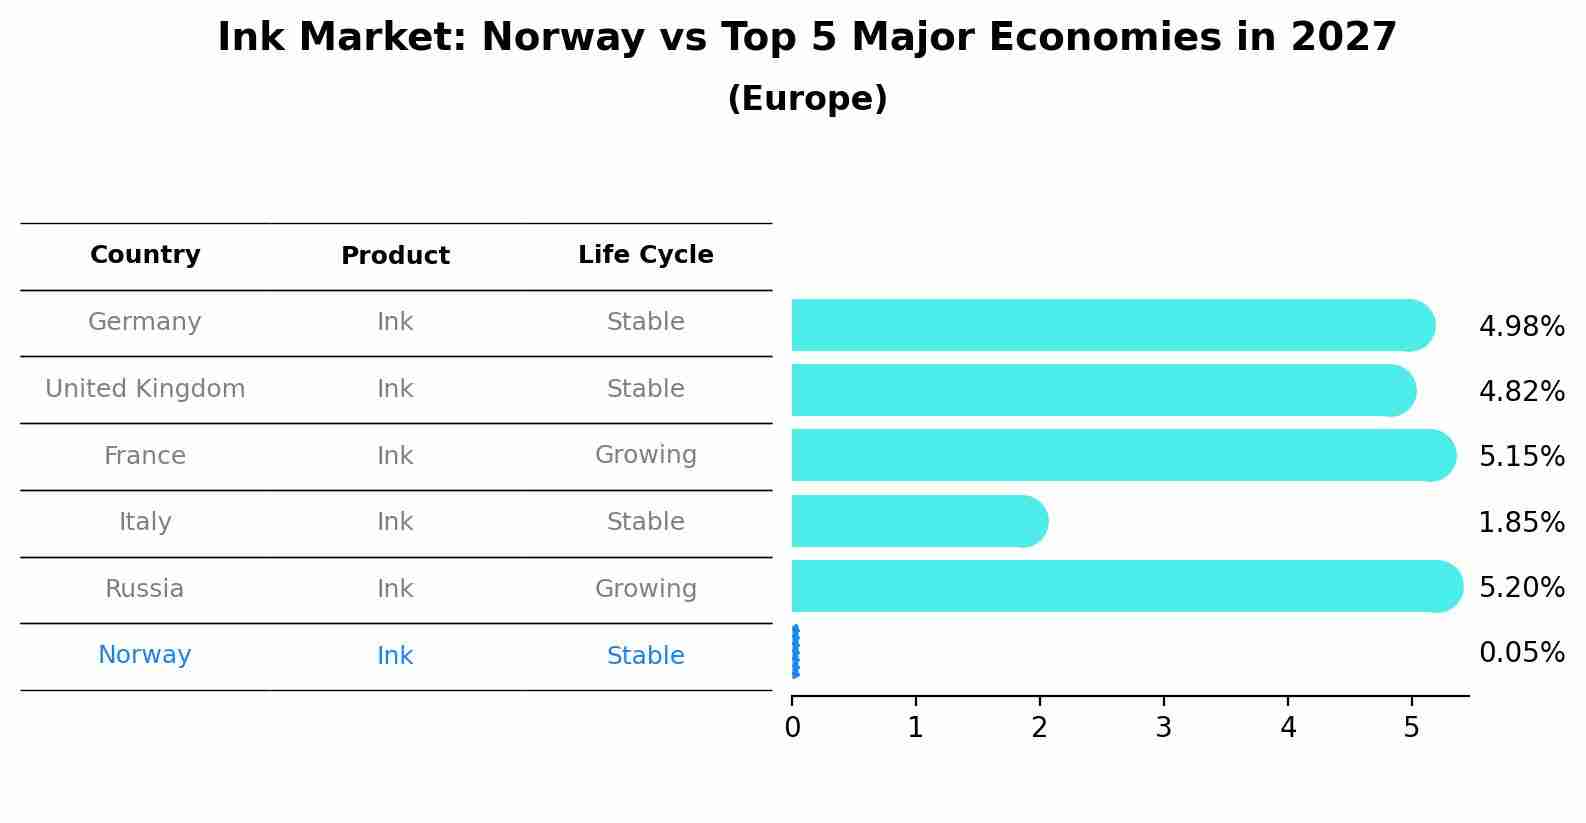
Ink Market: Norway vs Top 5 Major Economies in 2027 (Europe)
By 2027, the Ink market in Norway is anticipated to reach a growth rate of 0.05%, as part of an increasingly competitive Europe region, where Germany remains at the forefront, supported by United Kingdom, France, Italy and Russia, driving innovations and market adoption across sectors.
Norway Ink Market Overview
The ink market in Norway is influenced by the demand for inks used in printing, packaging, and industrial applications. Inks are essential for producing high-quality prints and coatings on various substrates. The market is supported by advancements in ink formulations, increasing demand for eco-friendly and sustainable inks, and the need for vibrant and durable printing solutions.
Drivers of the market
The ink market in Norway is driven by the demand for inks used in various applications, including printing, packaging, and coatings. Inks provide benefits such as color quality and durability. The market benefits from advancements in ink formulation technologies, increasing demand for printing and packaging solutions, and growing focus on improving ink performance and environmental sustainability.
Challenges of the market
The ink market in Norway faces challenges related to fluctuating raw material costs and the need for continuous innovation to meet changing industry requirements. Additionally, competition from alternative printing technologies and regulatory compliance issues impact market stability.
Government Policy of the market
Government policies in Norways ink market focus on safety, quality, and environmental impact. Regulations ensure that inks meet standards for effectiveness and safety in various applications. The government supports advancements in ink technologies that enhance performance while minimizing environmental impact.
Key Highlights of the Report:
- Norway Ink Market Outlook
- Market Size of Norway Ink Market, 2024
- Forecast of Norway Ink Market, 2031
- Historical Data and Forecast of Norway Ink Revenues & Volume for the Period 2021-2031
- Norway Ink Market Trend Evolution
- Norway Ink Market Drivers and Challenges
- Norway Ink Price Trends
- Norway Ink Porter`s Five Forces
- Norway Ink Industry Life Cycle
- Historical Data and Forecast of Norway Ink Market Revenues & Volume By Technology for the Period 2021-2031
- Historical Data and Forecast of Norway Ink Market Revenues & Volume By Lithographic for the Period 2021-2031
- Historical Data and Forecast of Norway Ink Market Revenues & Volume By Flexographic for the Period 2021-2031
- Historical Data and Forecast of Norway Ink Market Revenues & Volume By Gravure for the Period 2021-2031
- Historical Data and Forecast of Norway Ink Market Revenues & Volume By Digital for the Period 2021-2031
- Historical Data and Forecast of Norway Ink Market Revenues & Volume By Letterpress for the Period 2021-2031
- Historical Data and Forecast of Norway Ink Market Revenues & Volume By Others for the Period 2021-2031
- Historical Data and Forecast of Norway Ink Market Revenues & Volume By Ink Type for the Period 2021-2031
- Historical Data and Forecast of Norway Ink Market Revenues & Volume By Oil Based for the Period 2021-2031
- Historical Data and Forecast of Norway Ink Market Revenues & Volume By Solvent Based for the Period 2021-2031
- Historical Data and Forecast of Norway Ink Market Revenues & Volume By Water Based for the Period 2021-2031
- Historical Data and Forecast of Norway Ink Market Revenues & Volume By Applications for the Period 2021-2031
- Historical Data and Forecast of Norway Ink Market Revenues & Volume By Label And Packaging for the Period 2021-2031
- Historical Data and Forecast of Norway Ink Market Revenues & Volume By Commercial Printing for the Period 2021-2031
- Historical Data and Forecast of Norway Ink Market Revenues & Volume By Publications for the Period 2021-2031
- Historical Data and Forecast of Norway Ink Market Revenues & Volume By Others for the Period 2021-2031
- Norway Ink Import Export Trade Statistics
- Market Opportunity Assessment By Technology
- Market Opportunity Assessment By Ink Type
- Market Opportunity Assessment By Applications
- Norway Ink Top Companies Market Share
- Norway Ink Competitive Benchmarking By Technical and Operational Parameters
- Norway Ink Company Profiles
- Norway Ink Key Strategic Recommendations
Frequently Asked Questions About the Market Study (FAQs):
6Wresearch actively monitors the Norway Ink Market and publishes its comprehensive annual report, highlighting emerging trends, growth drivers, revenue analysis, and forecast outlook. Our insights help businesses to make data-backed strategic decisions with ongoing market dynamics. Our analysts track relevent industries related to the Norway Ink Market, allowing our clients with actionable intelligence and reliable forecasts tailored to emerging regional needs.
Yes, we provide customisation as per your requirements. To learn more, feel free to contact us on sales@6wresearch.com
1 Executive Summary |
2 Introduction |
2.1 Key Highlights of the Report |
2.2 Report Description |
2.3 Market Scope & Segmentation |
2.4 Research Methodology |
2.5 Assumptions |
3 Norway Ink Market Overview |
3.1 Norway Country Macro Economic Indicators |
3.2 Norway Ink Market Revenues & Volume, 2021 & 2031F |
3.3 Norway Ink Market - Industry Life Cycle |
3.4 Norway Ink Market - Porter's Five Forces |
3.5 Norway Ink Market Revenues & Volume Share, By Technology, 2021 & 2031F |
3.6 Norway Ink Market Revenues & Volume Share, By Ink Type, 2021 & 2031F |
3.7 Norway Ink Market Revenues & Volume Share, By Applications, 2021 & 2031F |
4 Norway Ink Market Dynamics |
4.1 Impact Analysis |
4.2 Market Drivers |
4.2.1 Increasing demand for eco-friendly and sustainable ink products |
4.2.2 Growth in packaging and labeling industries in Norway |
4.2.3 Technological advancements leading to the development of innovative ink formulations |
4.3 Market Restraints |
4.3.1 Volatility in raw material prices impacting production costs |
4.3.2 Strict environmental regulations and compliance requirements |
4.3.3 Competition from digital alternatives impacting traditional ink usage |
5 Norway Ink Market Trends |
6 Norway Ink Market Segmentations |
6.1 Norway Ink Market, By Technology |
6.1.1 Overview and Analysis |
6.1.2 Norway Ink Market Revenues & Volume, By Lithographic , 2021-2031F |
6.1.3 Norway Ink Market Revenues & Volume, By Flexographic , 2021-2031F |
6.1.4 Norway Ink Market Revenues & Volume, By Gravure, 2021-2031F |
6.1.5 Norway Ink Market Revenues & Volume, By Digital, 2021-2031F |
6.1.6 Norway Ink Market Revenues & Volume, By Letterpress, 2021-2031F |
6.1.7 Norway Ink Market Revenues & Volume, By Others, 2021-2031F |
6.2 Norway Ink Market, By Ink Type |
6.2.1 Overview and Analysis |
6.2.2 Norway Ink Market Revenues & Volume, By Oil Based, 2021-2031F |
6.2.3 Norway Ink Market Revenues & Volume, By Solvent Based, 2021-2031F |
6.2.4 Norway Ink Market Revenues & Volume, By Water Based, 2021-2031F |
6.3 Norway Ink Market, By Applications |
6.3.1 Overview and Analysis |
6.3.2 Norway Ink Market Revenues & Volume, By Label And Packaging, 2021-2031F |
6.3.3 Norway Ink Market Revenues & Volume, By Commercial Printing, 2021-2031F |
6.3.4 Norway Ink Market Revenues & Volume, By Publications, 2021-2031F |
6.3.5 Norway Ink Market Revenues & Volume, By Others, 2021-2031F |
7 Norway Ink Market Import-Export Trade Statistics |
7.1 Norway Ink Market Export to Major Countries |
7.2 Norway Ink Market Imports from Major Countries |
8 Norway Ink Market Key Performance Indicators |
8.1 Average revenue per user (ARPU) for ink products |
8.2 Percentage of revenue generated from new product developments |
8.3 Rate of adoption of eco-friendly ink solutions |
8.4 Customer satisfaction scores for ink quality and performance |
8.5 Research and development investment as a percentage of total revenue |
9 Norway Ink Market - Opportunity Assessment |
9.1 Norway Ink Market Opportunity Assessment, By Technology, 2021 & 2031F |
9.2 Norway Ink Market Opportunity Assessment, By Ink Type, 2021 & 2031F |
9.3 Norway Ink Market Opportunity Assessment, By Applications, 2021 & 2031F |
10 Norway Ink Market - Competitive Landscape |
10.1 Norway Ink Market Revenue Share, By Companies, 2024 |
10.2 Norway Ink Market Competitive Benchmarking, By Operating and Technical Parameters |
11 Company Profiles |
12 Recommendations | 13 Disclaimer |
Global Go To Market Strategy - 2030
Export potential enables firms to identify high-growth global markets with greater confidence by combining advanced trade intelligence with a structured quantitative methodology. The framework analyzes emerging demand trends and country-level import patterns while integrating macroeconomic and trade datasets such as GDP and population forecasts, bilateral import–export flows, tariff structures, elasticity differentials between developed and developing economies, geographic distance, and import demand projections. Using weighted trade values from 2020–2024 as the base period to project country-to-country export potential for 2030, these inputs are operationalized through calculated drivers such as gravity model parameters, tariff impact factors, and projected GDP per-capita growth. Through an analysis of hidden potentials, demand hotspots, and market conditions that are most favorable to success, this method enables firms to focus on target countries, maximize returns, and global expansion with data, backed by accuracy.
By factoring in the projected importer demand gap that is currently unmet and could be potential opportunity, it identifies the potential for the Exporter (Country) among 190 countries, against the general trade analysis, which identifies the biggest importer or exporter.
To discover high-growth global markets and optimize your business strategy:
Click Here
Pricing
- Single User License$ 1,995
- Department License$ 2,400
- Site License$ 3,120
- Global License$ 3,795

Leadership Perspectives from Industry Events
Search
Thought Leadership and Analyst Meet


Our Clients
6WResearch In News
- Doha a strategic location for EV manufacturing hub: IPA Qatar
- Demand for luxury TVs surging in the GCC, says Samsung
- Empowering Growth: The Thriving Journey of Bangladesh’s Cable Industry
- Demand for luxury TVs surging in the GCC, says Samsung
- Video call with a traditional healer? Once unthinkable, it’s now common in South Africa
- Intelligent Buildings To Smooth GCC’s Path To Net Zero
Latest Reports
- New Zealand Aseptic Manufacturing Market (2026-2032)
- Netherlands Aseptic Manufacturing Market (2026-2032)
- Nauru Aseptic Manufacturing Market (2026-2032)
- Namibia Aseptic Manufacturing Market (2026-2032)
- Mozambique Aseptic Manufacturing Market (2026-2032)
- Montenegro Aseptic Manufacturing Market (2026-2032)
- Mongolia Aseptic Manufacturing Market (2026-2032)
- Monaco Aseptic Manufacturing Market (2026-2032)
- Micronesia Aseptic Manufacturing Market (2026-2032)
- Mauritius Aseptic Manufacturing Market (2026-2032)
Industry Events and Analyst Meet

HIMTEX 2026

India Refining Summit 2026

India EV Show 2026

EV tech India Expo 2026

Auto Tech Asia 2026
Whitepaper
- Middle East & Africa Commercial Security Market Click here to view more.
- Middle East & Africa Fire Safety Systems & Equipment Market Click here to view more.
- GCC Drone Market Click here to view more.
- Middle East Lighting Fixture Market Click here to view more.
- GCC Physical & Perimeter Security Market Click here to view more.