Norway Kitchen Tableware Market (2026-2032) | Segmentation, Supply, Competitive, Opportunities, Pricing Analysis, Consumer Insights, Trends, Share, Size, Challenges, Analysis, Strategic Insights, Outlook, Growth, Revenue, Investment Trends, Demand, Restraints, Drivers, Value, Forecast, Industry, Strategy, Segments, Companies, Competition
Market Forecast By Type (Plates, Bowls, Cups, Cutlery, Serving Trays), By Material (Ceramic, Glass, Stainless Steel, Wood, Copper), By Shape (Round, Square, Oval, Rectangular, Irregular), By Application (Residential, Commercial, Hospitality, Institutional, Industrial), By Finish (Glossy, Matte, Brushed, Polished, Textured) And Competitive Landscape
| Product Code: ETC12608273 | Publication Date: Apr 2025 | Updated Date: Apr 2026 | Product Type: Market Research Report | |
| Publisher: 6Wresearch | No. of Pages: 65 | No. of Figures: 34 | No. of Tables: 19 | |
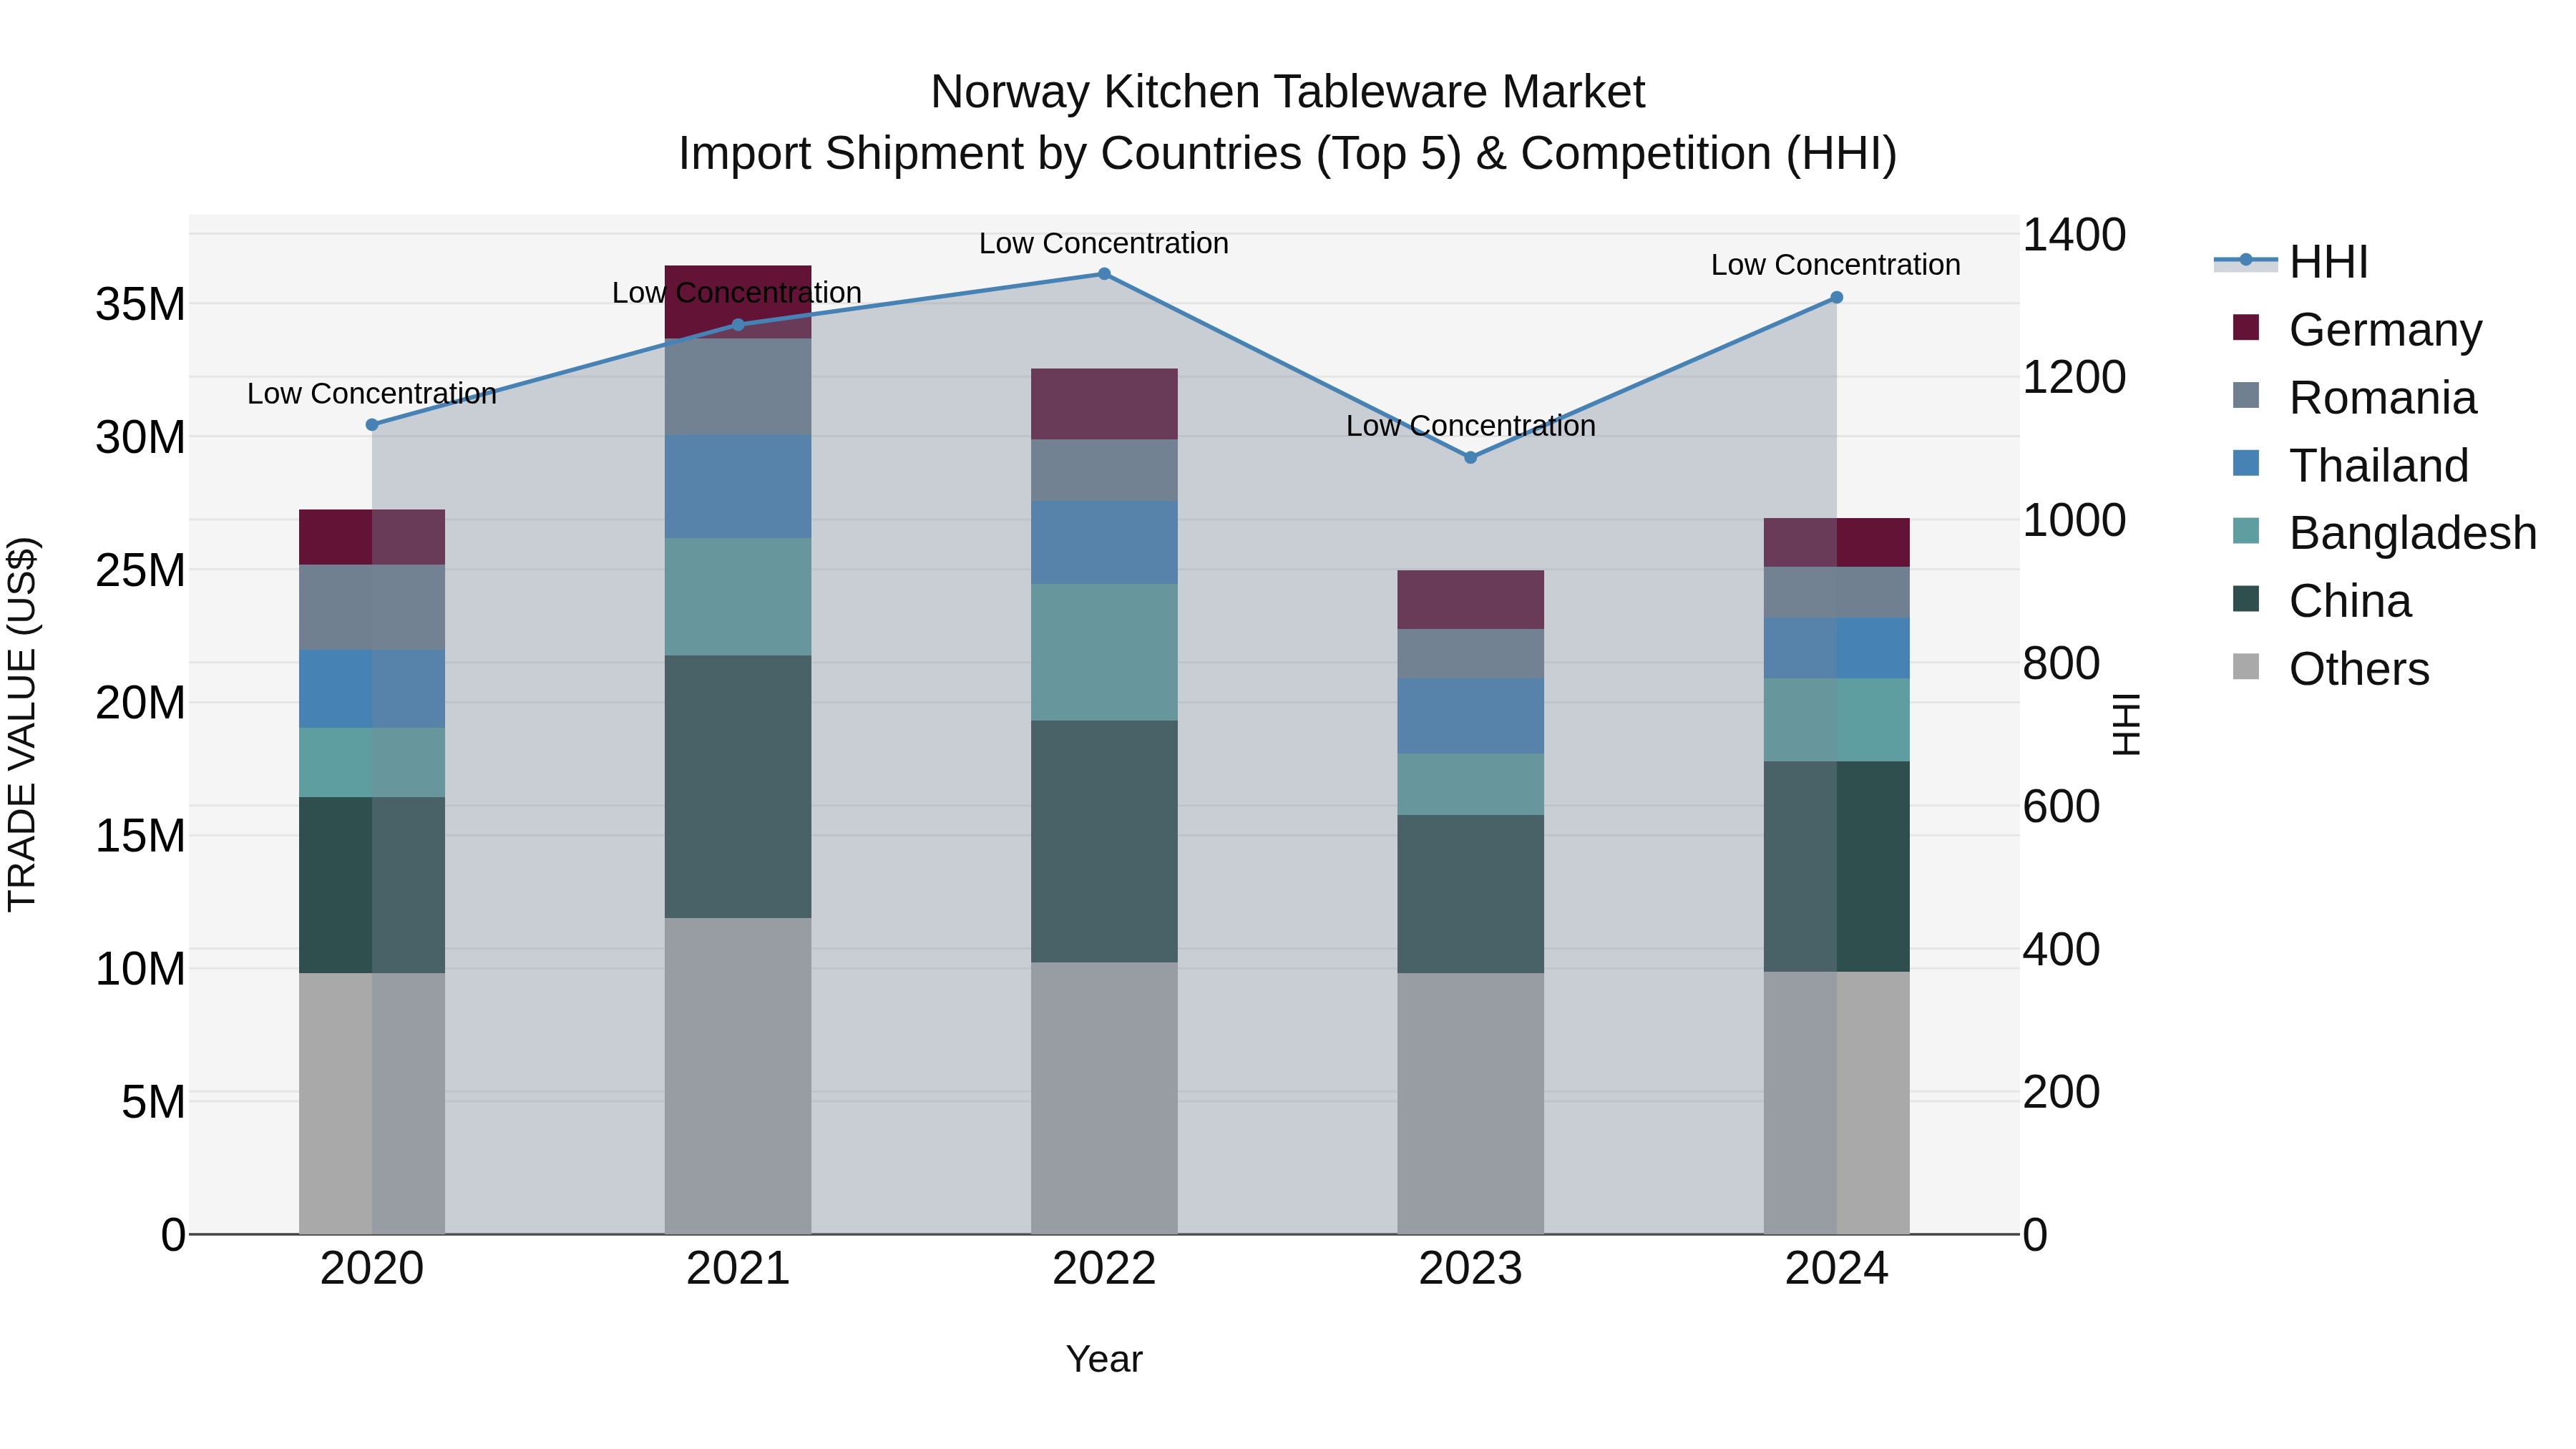
Norway Kitchen Tableware Market Top 5 Importing Countries and Market Competition (HHI) Analysis
Norway`s kitchen tableware import market in 2024 saw significant contributions from China, Bangladesh, Thailand, Indonesia, and Romania. Despite the diverse sources, market concentration, as measured by the Herfindahl-Hirschman Index (HHI), remained low. The compound annual growth rate (CAGR) from 2020 to 2024 was slightly negative at -0.3%, but there was a notable uptick with a growth rate of 7.81% from 2023 to 2024. This indicates a potential rebound in demand for kitchen tableware imports in Norway, with a broad range of countries supplying to meet consumer needs.
Key Highlights of the Report:
- Norway Kitchen Tableware Market Outlook
- Market Size of Norway Kitchen Tableware Market, 2025
- Forecast of Norway Kitchen Tableware Market, 2032
- Historical Data and Forecast of Norway Kitchen Tableware Revenues & Volume for the Period 2022 - 2032F
- Norway Kitchen Tableware Market Trend Evolution
- Norway Kitchen Tableware Market Drivers and Challenges
- Norway Kitchen Tableware Price Trends
- Norway Kitchen Tableware Porter's Five Forces
- Norway Kitchen Tableware Industry Life Cycle
- Historical Data and Forecast of Norway Kitchen Tableware Market Revenues & Volume By Type for the Period 2022 - 2032F
- Historical Data and Forecast of Norway Kitchen Tableware Market Revenues & Volume By Plates for the Period 2022 - 2032F
- Historical Data and Forecast of Norway Kitchen Tableware Market Revenues & Volume By Bowls for the Period 2022 - 2032F
- Historical Data and Forecast of Norway Kitchen Tableware Market Revenues & Volume By Cups for the Period 2022 - 2032F
- Historical Data and Forecast of Norway Kitchen Tableware Market Revenues & Volume By Cutlery for the Period 2022 - 2032F
- Historical Data and Forecast of Norway Kitchen Tableware Market Revenues & Volume By Serving Trays for the Period 2022 - 2032F
- Historical Data and Forecast of Norway Kitchen Tableware Market Revenues & Volume By Material for the Period 2022 - 2032F
- Historical Data and Forecast of Norway Kitchen Tableware Market Revenues & Volume By Ceramic for the Period 2022 - 2032F
- Historical Data and Forecast of Norway Kitchen Tableware Market Revenues & Volume By Glass for the Period 2022 - 2032F
- Historical Data and Forecast of Norway Kitchen Tableware Market Revenues & Volume By Stainless Steel for the Period 2022 - 2032F
- Historical Data and Forecast of Norway Kitchen Tableware Market Revenues & Volume By Wood for the Period 2022 - 2032F
- Historical Data and Forecast of Norway Kitchen Tableware Market Revenues & Volume By Copper for the Period 2022 - 2032F
- Historical Data and Forecast of Norway Kitchen Tableware Market Revenues & Volume By Shape for the Period 2022 - 2032F
- Historical Data and Forecast of Norway Kitchen Tableware Market Revenues & Volume By Round for the Period 2022 - 2032F
- Historical Data and Forecast of Norway Kitchen Tableware Market Revenues & Volume By Square for the Period 2022 - 2032F
- Historical Data and Forecast of Norway Kitchen Tableware Market Revenues & Volume By Oval for the Period 2022 - 2032F
- Historical Data and Forecast of Norway Kitchen Tableware Market Revenues & Volume By Rectangular for the Period 2022 - 2032F
- Historical Data and Forecast of Norway Kitchen Tableware Market Revenues & Volume By Irregular for the Period 2022 - 2032F
- Historical Data and Forecast of Norway Kitchen Tableware Market Revenues & Volume By Application for the Period 2022 - 2032F
- Historical Data and Forecast of Norway Kitchen Tableware Market Revenues & Volume By Residential for the Period 2022 - 2032F
- Historical Data and Forecast of Norway Kitchen Tableware Market Revenues & Volume By Commercial for the Period 2022 - 2032F
- Historical Data and Forecast of Norway Kitchen Tableware Market Revenues & Volume By Hospitality for the Period 2022 - 2032F
- Historical Data and Forecast of Norway Kitchen Tableware Market Revenues & Volume By Institutional for the Period 2022 - 2032F
- Historical Data and Forecast of Norway Kitchen Tableware Market Revenues & Volume By Industrial for the Period 2022 - 2032F
- Historical Data and Forecast of Norway Kitchen Tableware Market Revenues & Volume By Finish for the Period 2022 - 2032F
- Historical Data and Forecast of Norway Kitchen Tableware Market Revenues & Volume By Glossy for the Period 2022 - 2032F
- Historical Data and Forecast of Norway Kitchen Tableware Market Revenues & Volume By Matte for the Period 2022 - 2032F
- Historical Data and Forecast of Norway Kitchen Tableware Market Revenues & Volume By Brushed for the Period 2022 - 2032F
- Historical Data and Forecast of Norway Kitchen Tableware Market Revenues & Volume By Polished for the Period 2022 - 2032F
- Historical Data and Forecast of Norway Kitchen Tableware Market Revenues & Volume By Textured for the Period 2022 - 2032F
- Norway Kitchen Tableware Import Export Trade Statistics
- Market Opportunity Assessment By Type
- Market Opportunity Assessment By Material
- Market Opportunity Assessment By Shape
- Market Opportunity Assessment By Application
- Market Opportunity Assessment By Finish
- Norway Kitchen Tableware Top Companies Market Share
- Norway Kitchen Tableware Competitive Benchmarking By Technical and Operational Parameters
- Norway Kitchen Tableware Company Profiles
- Norway Kitchen Tableware Key Strategic Recommendations
Frequently Asked Questions About the Market Study (FAQs):
6Wresearch actively monitors the Norway Kitchen Tableware Market and publishes its comprehensive annual report, highlighting emerging trends, growth drivers, revenue analysis, and forecast outlook. Our insights help businesses to make data-backed strategic decisions with ongoing market dynamics. Our analysts track relevent industries related to the Norway Kitchen Tableware Market, allowing our clients with actionable intelligence and reliable forecasts tailored to emerging regional needs.
Yes, we provide customisation as per your requirements. To learn more, feel free to contact us on sales@6wresearch.com
1 Executive Summary |
2 Introduction |
2.1 Key Highlights of the Report |
2.2 Report Description |
2.3 Market Scope & Segmentation |
2.4 Research Methodology |
2.5 Assumptions |
3 Norway Kitchen Tableware Market Overview |
3.1 Norway Country Macro Economic Indicators |
3.2 Norway Kitchen Tableware Market Revenues & Volume, 2022 & 2032F |
3.3 Norway Kitchen Tableware Market - Industry Life Cycle |
3.4 Norway Kitchen Tableware Market - Porter's Five Forces |
3.5 Norway Kitchen Tableware Market Revenues & Volume Share, By Type, 2022 & 2032F |
3.6 Norway Kitchen Tableware Market Revenues & Volume Share, By Material, 2022 & 2032F |
3.7 Norway Kitchen Tableware Market Revenues & Volume Share, By Shape, 2022 & 2032F |
3.8 Norway Kitchen Tableware Market Revenues & Volume Share, By Application, 2022 & 2032F |
3.9 Norway Kitchen Tableware Market Revenues & Volume Share, By Finish, 2022 & 2032F |
4 Norway Kitchen Tableware Market Dynamics |
4.1 Impact Analysis |
4.2 Market Drivers |
4.2.1 Growing trend of home cooking and dining, leading to increased demand for kitchen tableware products. |
4.2.2 Rising disposable income levels in Norway, allowing consumers to spend more on premium and designer tableware. |
4.2.3 Focus on sustainability and eco-friendly products driving the demand for environmentally conscious tableware options. |
4.3 Market Restraints |
4.3.1 Economic uncertainty impacting consumer spending behavior and willingness to invest in non-essential items like kitchen tableware. |
4.3.2 Competition from alternative dining options such as takeout and food delivery services affecting the demand for traditional tableware products. |
4.3.3 Fluctuating raw material prices and supply chain disruptions leading to challenges in production and pricing stability. |
5 Norway Kitchen Tableware Market Trends |
6 Norway Kitchen Tableware Market, By Types |
6.1 Norway Kitchen Tableware Market, By Type |
6.1.1 Overview and Analysis |
6.1.2 Norway Kitchen Tableware Market Revenues & Volume, By Type, 2022 - 2032F |
6.1.3 Norway Kitchen Tableware Market Revenues & Volume, By Plates, 2022 - 2032F |
6.1.4 Norway Kitchen Tableware Market Revenues & Volume, By Bowls, 2022 - 2032F |
6.1.5 Norway Kitchen Tableware Market Revenues & Volume, By Cups, 2022 - 2032F |
6.1.6 Norway Kitchen Tableware Market Revenues & Volume, By Cutlery, 2022 - 2032F |
6.1.7 Norway Kitchen Tableware Market Revenues & Volume, By Serving Trays, 2022 - 2032F |
6.2 Norway Kitchen Tableware Market, By Material |
6.2.1 Overview and Analysis |
6.2.2 Norway Kitchen Tableware Market Revenues & Volume, By Ceramic, 2022 - 2032F |
6.2.3 Norway Kitchen Tableware Market Revenues & Volume, By Glass, 2022 - 2032F |
6.2.4 Norway Kitchen Tableware Market Revenues & Volume, By Stainless Steel, 2022 - 2032F |
6.2.5 Norway Kitchen Tableware Market Revenues & Volume, By Wood, 2022 - 2032F |
6.2.6 Norway Kitchen Tableware Market Revenues & Volume, By Copper, 2022 - 2032F |
6.3 Norway Kitchen Tableware Market, By Shape |
6.3.1 Overview and Analysis |
6.3.2 Norway Kitchen Tableware Market Revenues & Volume, By Round, 2022 - 2032F |
6.3.3 Norway Kitchen Tableware Market Revenues & Volume, By Square, 2022 - 2032F |
6.3.4 Norway Kitchen Tableware Market Revenues & Volume, By Oval, 2022 - 2032F |
6.3.5 Norway Kitchen Tableware Market Revenues & Volume, By Rectangular, 2022 - 2032F |
6.3.6 Norway Kitchen Tableware Market Revenues & Volume, By Irregular, 2022 - 2032F |
6.4 Norway Kitchen Tableware Market, By Application |
6.4.1 Overview and Analysis |
6.4.2 Norway Kitchen Tableware Market Revenues & Volume, By Residential, 2022 - 2032F |
6.4.3 Norway Kitchen Tableware Market Revenues & Volume, By Commercial, 2022 - 2032F |
6.4.4 Norway Kitchen Tableware Market Revenues & Volume, By Hospitality, 2022 - 2032F |
6.4.5 Norway Kitchen Tableware Market Revenues & Volume, By Institutional, 2022 - 2032F |
6.4.6 Norway Kitchen Tableware Market Revenues & Volume, By Industrial, 2022 - 2032F |
6.5 Norway Kitchen Tableware Market, By Finish |
6.5.1 Overview and Analysis |
6.5.2 Norway Kitchen Tableware Market Revenues & Volume, By Glossy, 2022 - 2032F |
6.5.3 Norway Kitchen Tableware Market Revenues & Volume, By Matte, 2022 - 2032F |
6.5.4 Norway Kitchen Tableware Market Revenues & Volume, By Brushed, 2022 - 2032F |
6.5.5 Norway Kitchen Tableware Market Revenues & Volume, By Polished, 2022 - 2032F |
6.5.6 Norway Kitchen Tableware Market Revenues & Volume, By Textured, 2022 - 2032F |
7 Norway Kitchen Tableware Market Import-Export Trade Statistics |
7.1 Norway Kitchen Tableware Market Export to Major Countries |
7.2 Norway Kitchen Tableware Market Imports from Major Countries |
8 Norway Kitchen Tableware Market Key Performance Indicators |
8.1 Average order value per customer, indicating the level of consumer spending on kitchen tableware products. |
8.2 Customer satisfaction scores, reflecting the quality and appeal of the tableware products in the market. |
8.3 Number of new product launches focused on sustainability and innovation, showing the market response to changing consumer preferences. |
8.4 Market penetration rate of premium kitchen tableware brands, indicating the acceptance and adoption of higher-priced products in the market. |
8.5 Percentage of repeat purchases or customer retention rates, demonstrating the loyalty and satisfaction levels among consumers towards kitchen tableware brands. |
9 Norway Kitchen Tableware Market - Opportunity Assessment |
9.1 Norway Kitchen Tableware Market Opportunity Assessment, By Type, 2022 & 2032F |
9.2 Norway Kitchen Tableware Market Opportunity Assessment, By Material, 2022 & 2032F |
9.3 Norway Kitchen Tableware Market Opportunity Assessment, By Shape, 2022 & 2032F |
9.4 Norway Kitchen Tableware Market Opportunity Assessment, By Application, 2022 & 2032F |
9.5 Norway Kitchen Tableware Market Opportunity Assessment, By Finish, 2022 & 2032F |
10 Norway Kitchen Tableware Market - Competitive Landscape |
10.1 Norway Kitchen Tableware Market Revenue Share, By Companies, 2025 |
10.2 Norway Kitchen Tableware Market Competitive Benchmarking, By Operating and Technical Parameters |
11 Company Profiles |
12 Recommendations |
13 Disclaimer |
Global Go To Market Strategy - 2030
Export potential enables firms to identify high-growth global markets with greater confidence by combining advanced trade intelligence with a structured quantitative methodology. The framework analyzes emerging demand trends and country-level import patterns while integrating macroeconomic and trade datasets such as GDP and population forecasts, bilateral import–export flows, tariff structures, elasticity differentials between developed and developing economies, geographic distance, and import demand projections. Using weighted trade values from 2020–2024 as the base period to project country-to-country export potential for 2030, these inputs are operationalized through calculated drivers such as gravity model parameters, tariff impact factors, and projected GDP per-capita growth. Through an analysis of hidden potentials, demand hotspots, and market conditions that are most favorable to success, this method enables firms to focus on target countries, maximize returns, and global expansion with data, backed by accuracy.
By factoring in the projected importer demand gap that is currently unmet and could be potential opportunity, it identifies the potential for the Exporter (Country) among 190 countries, against the general trade analysis, which identifies the biggest importer or exporter.
To discover high-growth global markets and optimize your business strategy:
Click Here
Pricing
- Single User License$ 1,995
- Department License$ 2,400
- Site License$ 3,120
- Global License$ 3,795

Leadership Perspectives from Industry Events
Search
Thought Leadership and Analyst Meet


Our Clients
6WResearch In News
- Doha a strategic location for EV manufacturing hub: IPA Qatar
- Demand for luxury TVs surging in the GCC, says Samsung
- Empowering Growth: The Thriving Journey of Bangladesh’s Cable Industry
- Demand for luxury TVs surging in the GCC, says Samsung
- Video call with a traditional healer? Once unthinkable, it’s now common in South Africa
- Intelligent Buildings To Smooth GCC’s Path To Net Zero
Latest Reports
- Taiwan Airport Wireless Infrastructure Market (2026-2032)
- Vietnam Airport Wireless Infrastructure Market (2026-2032)
- Thailand Airport Wireless Infrastructure Market (2026-2032)
- South Korea Airport Wireless Infrastructure Market (2026-2032)
- Romania Airport Wireless Infrastructure Market (2026-2032)
- Qatar Airport Wireless Infrastructure Market (2026-2032)
- Philippines Airport Wireless Infrastructure Market (2026-2032)
- Japan Airport Wireless Infrastructure Market (2026-2032)
- Taiwan Airport Winter Services Market (2026-2032)
- Vietnam Airport Winter Services Market (2026-2032)
Industry Events and Analyst Meet

HIMTEX 2026

India Refining Summit 2026

India EV Show 2026

EV tech India Expo 2026

Auto Tech Asia 2026
Whitepaper
- Middle East & Africa Commercial Security Market Click here to view more.
- Middle East & Africa Fire Safety Systems & Equipment Market Click here to view more.
- GCC Drone Market Click here to view more.
- Middle East Lighting Fixture Market Click here to view more.
- GCC Physical & Perimeter Security Market Click here to view more.