Norway Lab Titration Market (2026-2032) | Investment Trends, Consumer Insights, Opportunities, Competitive, Restraints, Challenges, Share, Strategy, Segments, Segmentation, Industry, Growth, Size, Competition, Analysis, Revenue, Strategic Insights, Demand, Value, Drivers, Supply, Outlook, Forecast, Pricing Analysis, Companies, Trends
Market Forecast By Type (Acid-Base Titration, Redox Titration, Complexometric Titration, Precipitation Titration, Potentiometric Titration), By Application (Chemical Analysis, Food Testing, Pharmaceutical Quality Control, Environmental Testing, Water Quality Analysis), By Equipment (Burettes, Pipettes, Titration Stands, Magnetic Stirrers, Electrodes), By End User (Hospitals, Diagnostic Labs, Research Institutes, Pharmaceutical Companies, Biotechnology Firms), By Process (Manual Titration, Automated Titration, Semi-Automated Titration, Real-Time Monitoring, Batch Processing) And Competitive Landscape
| Product Code: ETC12614033 | Publication Date: Apr 2025 | Updated Date: Apr 2026 | Product Type: Market Research Report | |
| Publisher: 6Wresearch | No. of Pages: 65 | No. of Figures: 34 | No. of Tables: 19 | |
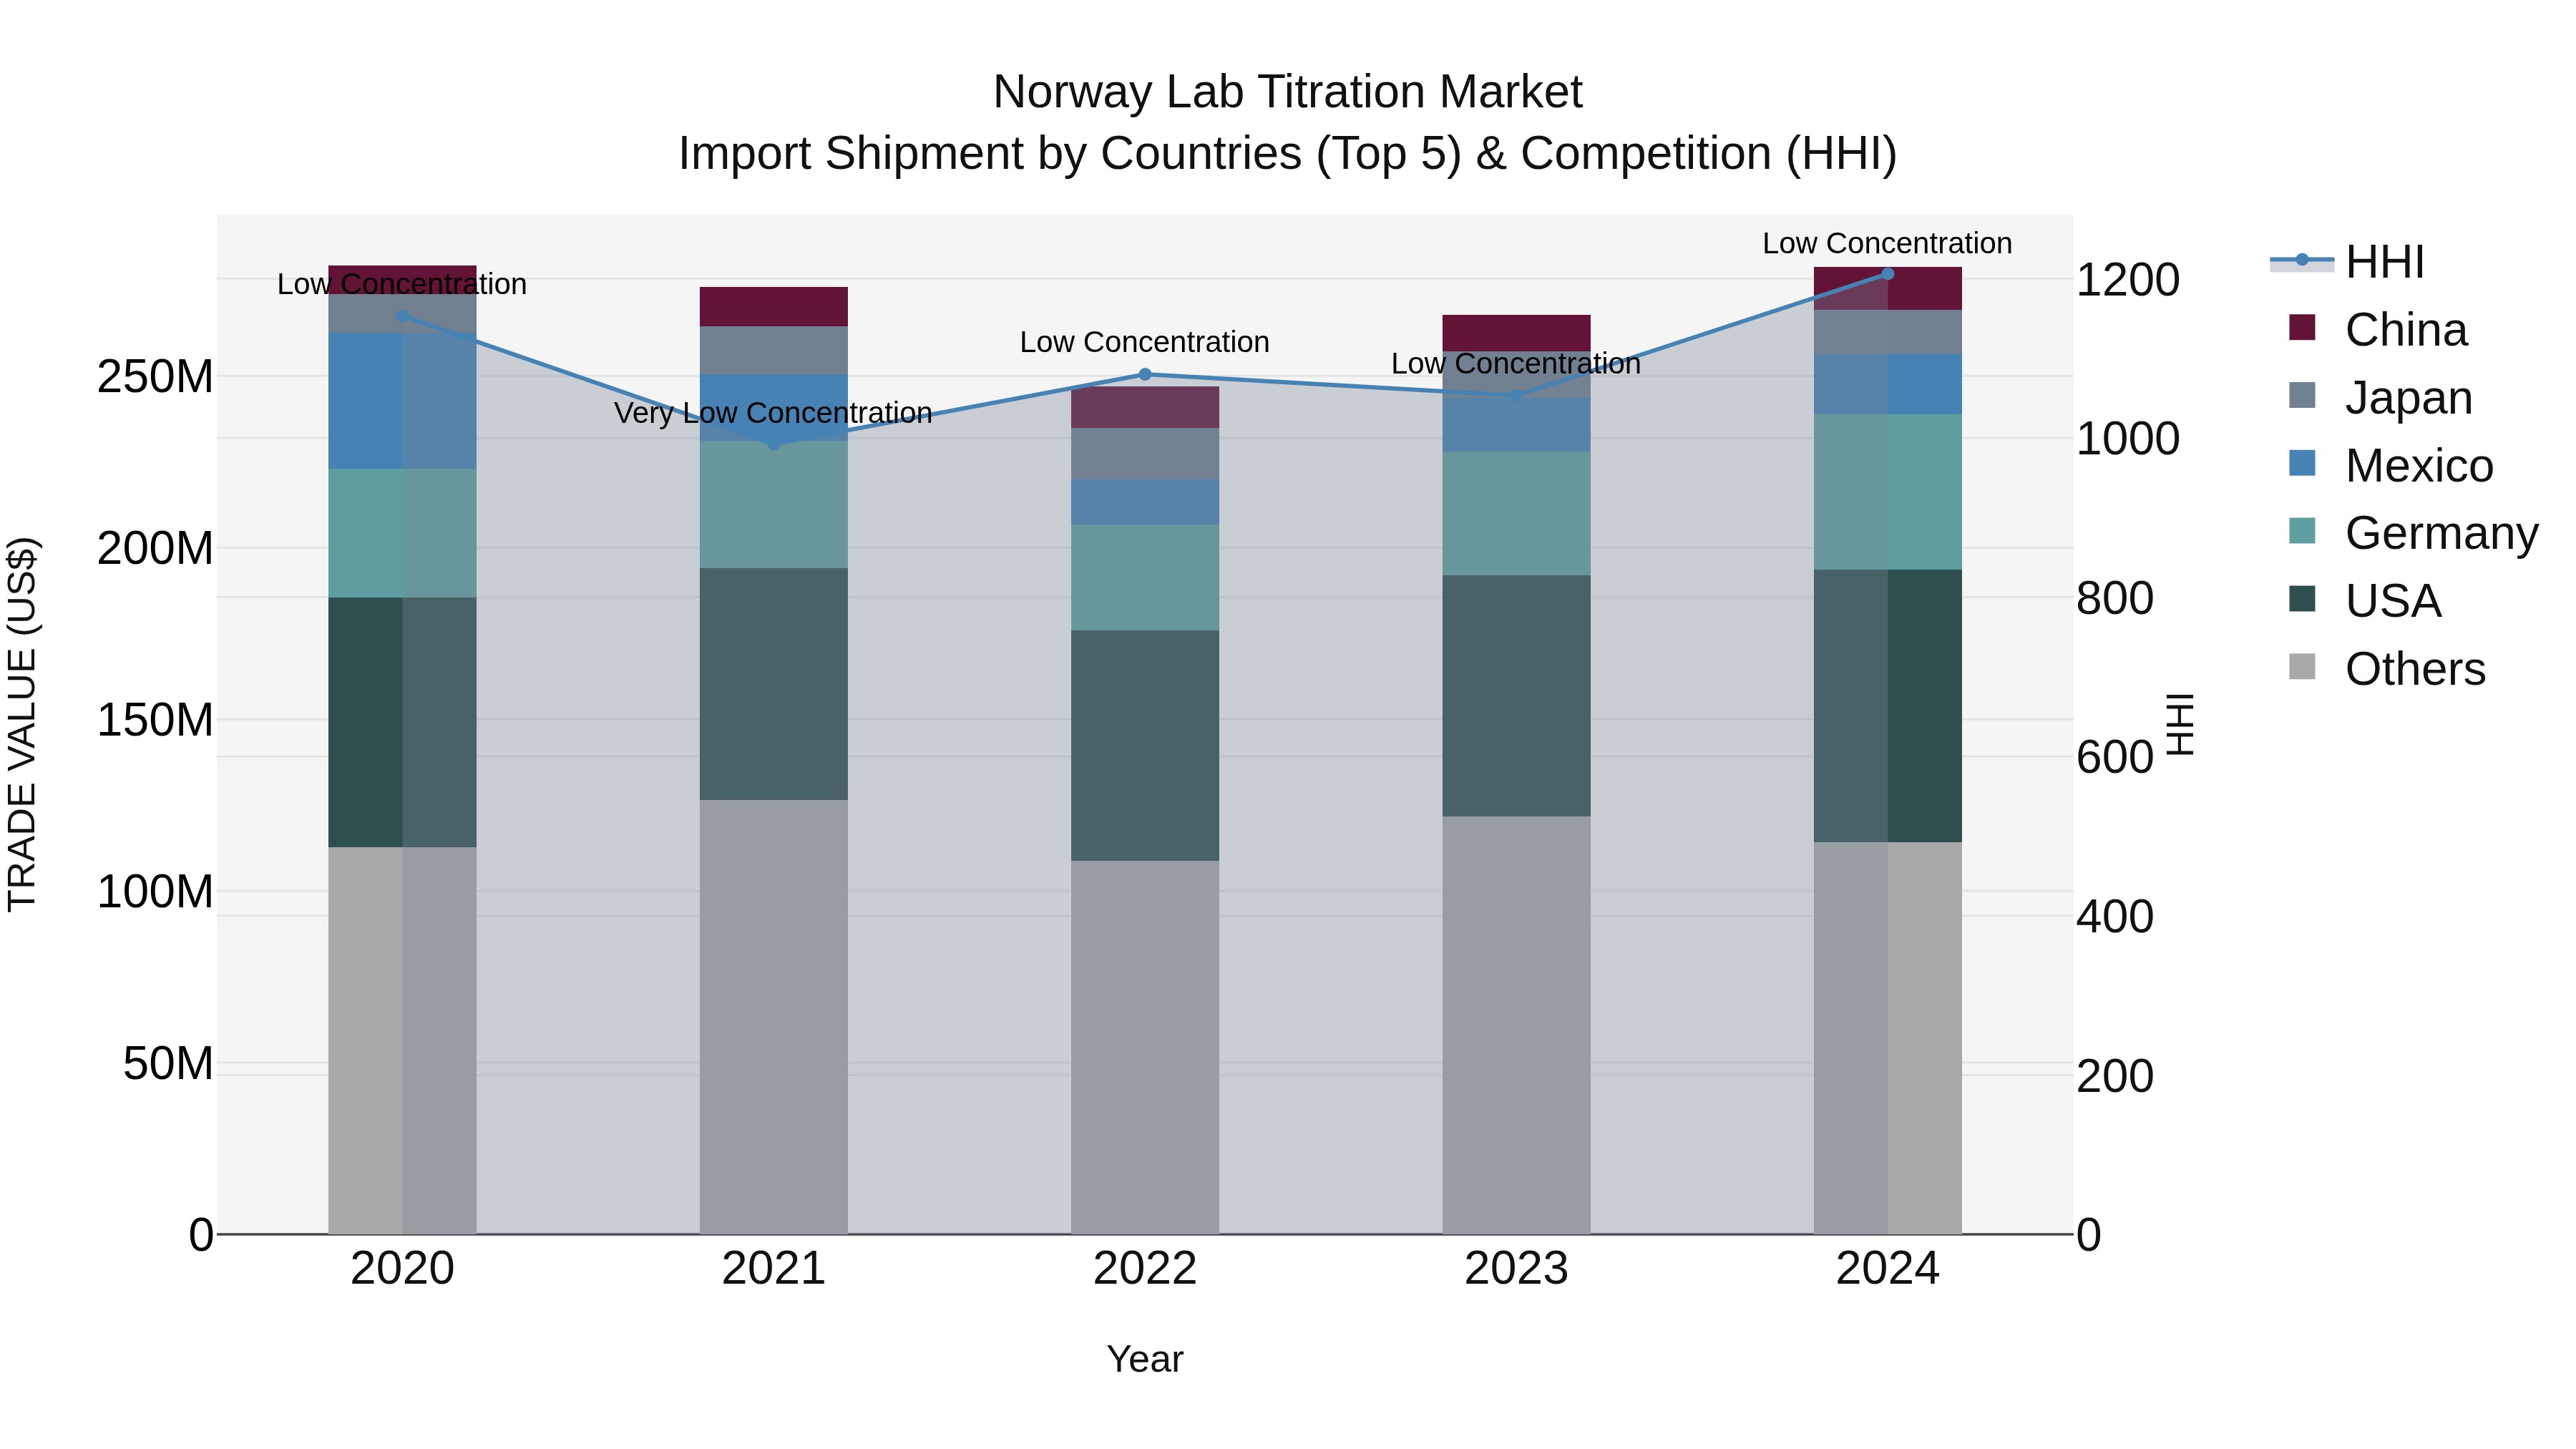
Norway Lab Titration Market Top 5 Importing Countries and Market Competition (HHI) Analysis
Norway`s lab titration import market in 2024 saw a diverse range of top exporting countries, including the USA, Germany, Mexico, Japan, and China. Despite this variety, the market exhibited low concentration levels with a Herfindahl-Hirschman Index (HHI) remaining low. The compound annual growth rate (CAGR) from 2020 to 2024 was slightly negative at -0.03, but there was a notable growth spurt in 2024 with a 5.24% increase from the previous year. This suggests a dynamic and evolving market landscape with potential opportunities for further expansion and diversification in the coming years.
Key Highlights of the Report:
- Norway Lab Titration Market Outlook
- Market Size of Norway Lab Titration Market, 2025
- Forecast of Norway Lab Titration Market, 2032
- Historical Data and Forecast of Norway Lab Titration Revenues & Volume for the Period 2022 - 2032F
- Norway Lab Titration Market Trend Evolution
- Norway Lab Titration Market Drivers and Challenges
- Norway Lab Titration Price Trends
- Norway Lab Titration Porter's Five Forces
- Norway Lab Titration Industry Life Cycle
- Historical Data and Forecast of Norway Lab Titration Market Revenues & Volume By Type for the Period 2022 - 2032F
- Historical Data and Forecast of Norway Lab Titration Market Revenues & Volume By Acid-Base Titration for the Period 2022 - 2032F
- Historical Data and Forecast of Norway Lab Titration Market Revenues & Volume By Redox Titration for the Period 2022 - 2032F
- Historical Data and Forecast of Norway Lab Titration Market Revenues & Volume By Complexometric Titration for the Period 2022 - 2032F
- Historical Data and Forecast of Norway Lab Titration Market Revenues & Volume By Precipitation Titration for the Period 2022 - 2032F
- Historical Data and Forecast of Norway Lab Titration Market Revenues & Volume By Potentiometric Titration for the Period 2022 - 2032F
- Historical Data and Forecast of Norway Lab Titration Market Revenues & Volume By Application for the Period 2022 - 2032F
- Historical Data and Forecast of Norway Lab Titration Market Revenues & Volume By Chemical Analysis for the Period 2022 - 2032F
- Historical Data and Forecast of Norway Lab Titration Market Revenues & Volume By Food Testing for the Period 2022 - 2032F
- Historical Data and Forecast of Norway Lab Titration Market Revenues & Volume By Pharmaceutical Quality Control for the Period 2022 - 2032F
- Historical Data and Forecast of Norway Lab Titration Market Revenues & Volume By Environmental Testing for the Period 2022 - 2032F
- Historical Data and Forecast of Norway Lab Titration Market Revenues & Volume By Water Quality Analysis for the Period 2022 - 2032F
- Historical Data and Forecast of Norway Lab Titration Market Revenues & Volume By Equipment for the Period 2022 - 2032F
- Historical Data and Forecast of Norway Lab Titration Market Revenues & Volume By Burettes for the Period 2022 - 2032F
- Historical Data and Forecast of Norway Lab Titration Market Revenues & Volume By Pipettes for the Period 2022 - 2032F
- Historical Data and Forecast of Norway Lab Titration Market Revenues & Volume By Titration Stands for the Period 2022 - 2032F
- Historical Data and Forecast of Norway Lab Titration Market Revenues & Volume By Magnetic Stirrers for the Period 2022 - 2032F
- Historical Data and Forecast of Norway Lab Titration Market Revenues & Volume By Electrodes for the Period 2022 - 2032F
- Historical Data and Forecast of Norway Lab Titration Market Revenues & Volume By End User for the Period 2022 - 2032F
- Historical Data and Forecast of Norway Lab Titration Market Revenues & Volume By Hospitals for the Period 2022 - 2032F
- Historical Data and Forecast of Norway Lab Titration Market Revenues & Volume By Diagnostic Labs for the Period 2022 - 2032F
- Historical Data and Forecast of Norway Lab Titration Market Revenues & Volume By Research Institutes for the Period 2022 - 2032F
- Historical Data and Forecast of Norway Lab Titration Market Revenues & Volume By Pharmaceutical Companies for the Period 2022 - 2032F
- Historical Data and Forecast of Norway Lab Titration Market Revenues & Volume By Biotechnology Firms for the Period 2022 - 2032F
- Historical Data and Forecast of Norway Lab Titration Market Revenues & Volume By Process for the Period 2022 - 2032F
- Historical Data and Forecast of Norway Lab Titration Market Revenues & Volume By Manual Titration for the Period 2022 - 2032F
- Historical Data and Forecast of Norway Lab Titration Market Revenues & Volume By Automated Titration for the Period 2022 - 2032F
- Historical Data and Forecast of Norway Lab Titration Market Revenues & Volume By Semi-Automated Titration for the Period 2022 - 2032F
- Historical Data and Forecast of Norway Lab Titration Market Revenues & Volume By Real-Time Monitoring for the Period 2022 - 2032F
- Historical Data and Forecast of Norway Lab Titration Market Revenues & Volume By Batch Processing for the Period 2022 - 2032F
- Norway Lab Titration Import Export Trade Statistics
- Market Opportunity Assessment By Type
- Market Opportunity Assessment By Application
- Market Opportunity Assessment By Equipment
- Market Opportunity Assessment By End User
- Market Opportunity Assessment By Process
- Norway Lab Titration Top Companies Market Share
- Norway Lab Titration Competitive Benchmarking By Technical and Operational Parameters
- Norway Lab Titration Company Profiles
- Norway Lab Titration Key Strategic Recommendations
Frequently Asked Questions About the Market Study (FAQs):
6Wresearch actively monitors the Norway Lab Titration Market and publishes its comprehensive annual report, highlighting emerging trends, growth drivers, revenue analysis, and forecast outlook. Our insights help businesses to make data-backed strategic decisions with ongoing market dynamics. Our analysts track relevent industries related to the Norway Lab Titration Market, allowing our clients with actionable intelligence and reliable forecasts tailored to emerging regional needs.
Yes, we provide customisation as per your requirements. To learn more, feel free to contact us on sales@6wresearch.com
1 Executive Summary |
2 Introduction |
2.1 Key Highlights of the Report |
2.2 Report Description |
2.3 Market Scope & Segmentation |
2.4 Research Methodology |
2.5 Assumptions |
3 Norway Lab Titration Market Overview |
3.1 Norway Country Macro Economic Indicators |
3.2 Norway Lab Titration Market Revenues & Volume, 2022 & 2032F |
3.3 Norway Lab Titration Market - Industry Life Cycle |
3.4 Norway Lab Titration Market - Porter's Five Forces |
3.5 Norway Lab Titration Market Revenues & Volume Share, By Type, 2022 & 2032F |
3.6 Norway Lab Titration Market Revenues & Volume Share, By Application, 2022 & 2032F |
3.7 Norway Lab Titration Market Revenues & Volume Share, By Equipment, 2022 & 2032F |
3.8 Norway Lab Titration Market Revenues & Volume Share, By End User, 2022 & 2032F |
3.9 Norway Lab Titration Market Revenues & Volume Share, By Process, 2022 & 2032F |
4 Norway Lab Titration Market Dynamics |
4.1 Impact Analysis |
4.2 Market Drivers |
4.2.1 Increasing demand for accurate and precise analytical testing in various industries such as pharmaceuticals, food beverages, and environmental testing |
4.2.2 Technological advancements in lab titration equipment leading to improved efficiency and accuracy in test results |
4.2.3 Growing focus on quality control and compliance with regulatory standards driving the adoption of lab titration solutions |
4.3 Market Restraints |
4.3.1 High initial investment costs associated with purchasing and maintaining lab titration equipment |
4.3.2 Limited availability of skilled professionals proficient in operating and interpreting results from lab titration instruments |
4.3.3 Challenges related to standardization and calibration of lab titration equipment affecting the reliability of test results |
5 Norway Lab Titration Market Trends |
6 Norway Lab Titration Market, By Types |
6.1 Norway Lab Titration Market, By Type |
6.1.1 Overview and Analysis |
6.1.2 Norway Lab Titration Market Revenues & Volume, By Type, 2022 - 2032F |
6.1.3 Norway Lab Titration Market Revenues & Volume, By Acid-Base Titration, 2022 - 2032F |
6.1.4 Norway Lab Titration Market Revenues & Volume, By Redox Titration, 2022 - 2032F |
6.1.5 Norway Lab Titration Market Revenues & Volume, By Complexometric Titration, 2022 - 2032F |
6.1.6 Norway Lab Titration Market Revenues & Volume, By Precipitation Titration, 2022 - 2032F |
6.1.7 Norway Lab Titration Market Revenues & Volume, By Potentiometric Titration, 2022 - 2032F |
6.2 Norway Lab Titration Market, By Application |
6.2.1 Overview and Analysis |
6.2.2 Norway Lab Titration Market Revenues & Volume, By Chemical Analysis, 2022 - 2032F |
6.2.3 Norway Lab Titration Market Revenues & Volume, By Food Testing, 2022 - 2032F |
6.2.4 Norway Lab Titration Market Revenues & Volume, By Pharmaceutical Quality Control, 2022 - 2032F |
6.2.5 Norway Lab Titration Market Revenues & Volume, By Environmental Testing, 2022 - 2032F |
6.2.6 Norway Lab Titration Market Revenues & Volume, By Water Quality Analysis, 2022 - 2032F |
6.3 Norway Lab Titration Market, By Equipment |
6.3.1 Overview and Analysis |
6.3.2 Norway Lab Titration Market Revenues & Volume, By Burettes, 2022 - 2032F |
6.3.3 Norway Lab Titration Market Revenues & Volume, By Pipettes, 2022 - 2032F |
6.3.4 Norway Lab Titration Market Revenues & Volume, By Titration Stands, 2022 - 2032F |
6.3.5 Norway Lab Titration Market Revenues & Volume, By Magnetic Stirrers, 2022 - 2032F |
6.3.6 Norway Lab Titration Market Revenues & Volume, By Electrodes, 2022 - 2032F |
6.4 Norway Lab Titration Market, By End User |
6.4.1 Overview and Analysis |
6.4.2 Norway Lab Titration Market Revenues & Volume, By Hospitals, 2022 - 2032F |
6.4.3 Norway Lab Titration Market Revenues & Volume, By Diagnostic Labs, 2022 - 2032F |
6.4.4 Norway Lab Titration Market Revenues & Volume, By Research Institutes, 2022 - 2032F |
6.4.5 Norway Lab Titration Market Revenues & Volume, By Pharmaceutical Companies, 2022 - 2032F |
6.4.6 Norway Lab Titration Market Revenues & Volume, By Biotechnology Firms, 2022 - 2032F |
6.5 Norway Lab Titration Market, By Process |
6.5.1 Overview and Analysis |
6.5.2 Norway Lab Titration Market Revenues & Volume, By Manual Titration, 2022 - 2032F |
6.5.3 Norway Lab Titration Market Revenues & Volume, By Automated Titration, 2022 - 2032F |
6.5.4 Norway Lab Titration Market Revenues & Volume, By Semi-Automated Titration, 2022 - 2032F |
6.5.5 Norway Lab Titration Market Revenues & Volume, By Real-Time Monitoring, 2022 - 2032F |
6.5.6 Norway Lab Titration Market Revenues & Volume, By Batch Processing, 2022 - 2032F |
7 Norway Lab Titration Market Import-Export Trade Statistics |
7.1 Norway Lab Titration Market Export to Major Countries |
7.2 Norway Lab Titration Market Imports from Major Countries |
8 Norway Lab Titration Market Key Performance Indicators |
8.1 Equipment uptime percentage, indicating the efficiency and reliability of lab titration instruments |
8.2 Rate of adoption of automated titration systems, reflecting the industry's shift towards more advanced technologies |
8.3 Number of regulatory compliance certifications obtained by lab titration equipment manufacturers, demonstrating adherence to quality and safety standards |
9 Norway Lab Titration Market - Opportunity Assessment |
9.1 Norway Lab Titration Market Opportunity Assessment, By Type, 2022 & 2032F |
9.2 Norway Lab Titration Market Opportunity Assessment, By Application, 2022 & 2032F |
9.3 Norway Lab Titration Market Opportunity Assessment, By Equipment, 2022 & 2032F |
9.4 Norway Lab Titration Market Opportunity Assessment, By End User, 2022 & 2032F |
9.5 Norway Lab Titration Market Opportunity Assessment, By Process, 2022 & 2032F |
10 Norway Lab Titration Market - Competitive Landscape |
10.1 Norway Lab Titration Market Revenue Share, By Companies, 2025 |
10.2 Norway Lab Titration Market Competitive Benchmarking, By Operating and Technical Parameters |
11 Company Profiles |
12 Recommendations |
13 Disclaimer |
Global Go To Market Strategy - 2030
Export potential enables firms to identify high-growth global markets with greater confidence by combining advanced trade intelligence with a structured quantitative methodology. The framework analyzes emerging demand trends and country-level import patterns while integrating macroeconomic and trade datasets such as GDP and population forecasts, bilateral import–export flows, tariff structures, elasticity differentials between developed and developing economies, geographic distance, and import demand projections. Using weighted trade values from 2020–2024 as the base period to project country-to-country export potential for 2030, these inputs are operationalized through calculated drivers such as gravity model parameters, tariff impact factors, and projected GDP per-capita growth. Through an analysis of hidden potentials, demand hotspots, and market conditions that are most favorable to success, this method enables firms to focus on target countries, maximize returns, and global expansion with data, backed by accuracy.
By factoring in the projected importer demand gap that is currently unmet and could be potential opportunity, it identifies the potential for the Exporter (Country) among 190 countries, against the general trade analysis, which identifies the biggest importer or exporter.
To discover high-growth global markets and optimize your business strategy:
Click Here
Pricing
- Single User License$ 1,995
- Department License$ 2,400
- Site License$ 3,120
- Global License$ 3,795

Leadership Perspectives from Industry Events
Search
Thought Leadership and Analyst Meet


Our Clients
6WResearch In News
- Doha a strategic location for EV manufacturing hub: IPA Qatar
- Demand for luxury TVs surging in the GCC, says Samsung
- Empowering Growth: The Thriving Journey of Bangladesh’s Cable Industry
- Demand for luxury TVs surging in the GCC, says Samsung
- Video call with a traditional healer? Once unthinkable, it’s now common in South Africa
- Intelligent Buildings To Smooth GCC’s Path To Net Zero
Latest Reports
- Cape Verde Portable Hand-Thrown Extinguisher Market (2026-2032)
- Canada Portable Hand-Thrown Extinguisher Market (2026-2032)
- Cameroon Portable Hand-Thrown Extinguisher Market (2026-2032)
- Burundi Portable Hand-Thrown Extinguisher Market (2026-2032)
- Burkina Faso Portable Hand-Thrown Extinguisher Market (2026-2032)
- Bulgaria Portable Hand-Thrown Extinguisher Market (2026-2032)
- Brunei Portable Hand-Thrown Extinguisher Market (2026-2032)
- Botswana Portable Hand-Thrown Extinguisher Market (2026-2032)
- Bosnia and Herzegovina Portable Hand-Thrown Extinguisher Market (2026-2032)
- Bolivia Portable Hand-Thrown Extinguisher Market (2026-2032)
Industry Events and Analyst Meet

HIMTEX 2026

India Refining Summit 2026

India EV Show 2026

EV tech India Expo 2026

Auto Tech Asia 2026
Whitepaper
- Middle East & Africa Commercial Security Market Click here to view more.
- Middle East & Africa Fire Safety Systems & Equipment Market Click here to view more.
- GCC Drone Market Click here to view more.
- Middle East Lighting Fixture Market Click here to view more.
- GCC Physical & Perimeter Security Market Click here to view more.