Norway Soups Market (2025-2031) | Size, Trends, Forecast, Growth, Revenue, Companies, Analysis, Industry, Value, Segmentation, Share & Outlook
Market Forecast By Type (Dry, Wet, Others), By Distribution Channel (Supermarkets & Hypermarkets, Convenience Stores, Others) And Competitive Landscape
| Product Code: ETC5008995 | Publication Date: Nov 2023 | Updated Date: Nov 2025 | Product Type: Market Research Report | |
| Publisher: 6Wresearch | Author: Sachin Kumar Rai | No. of Pages: 60 | No. of Figures: 30 | No. of Tables: 5 |
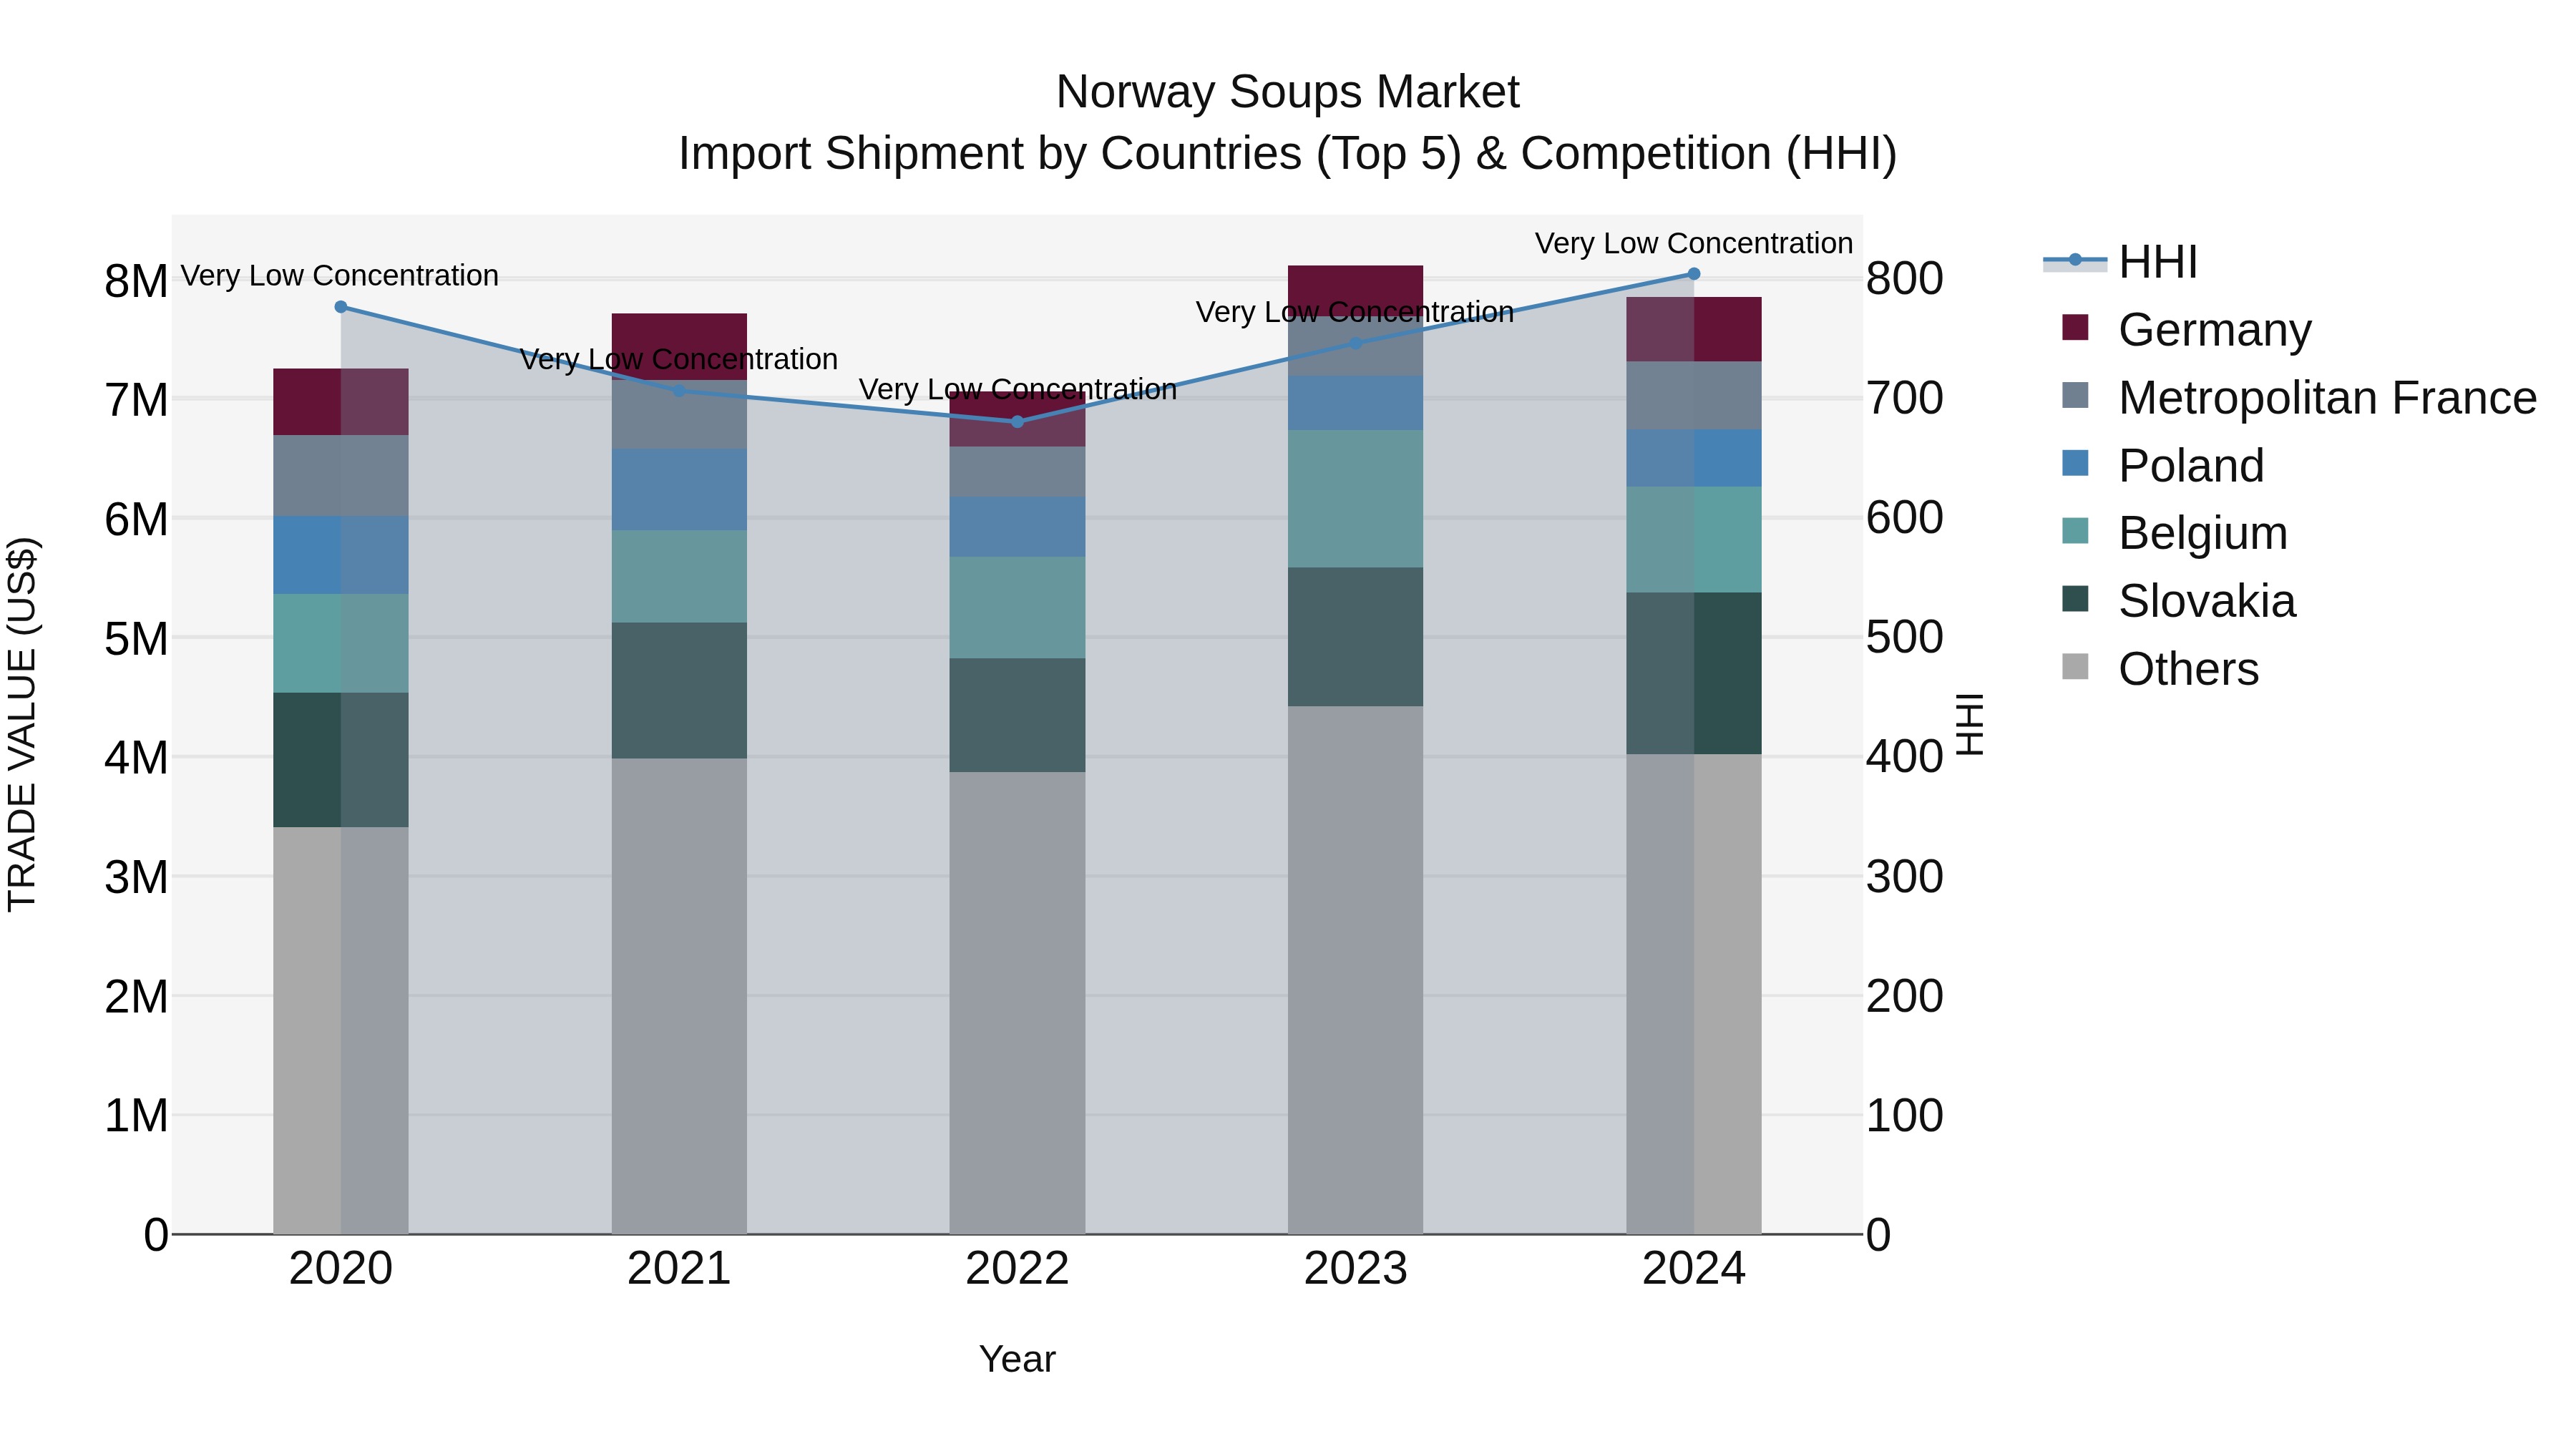
Norway Soups Market Top 5 Importing Countries and Market Competition (HHI) Analysis
Norway`s import market for soups in 2024 saw a diverse range of countries contributing to its supply, with Slovakia, Belgium, Finland, Metropolitan France, and Germany leading the pack. The low concentration level indicated by the Herfindahl-Hirschman Index (HHI) suggests a competitive landscape. Despite a modest compound annual growth rate (CAGR) of 2.01% from 2020 to 2024, there was a slight downturn in growth from 2023 to 2024, with a -3.23% growth rate. This data highlights the importance of monitoring market dynamics and adapting strategies to navigate fluctuations in the industry.
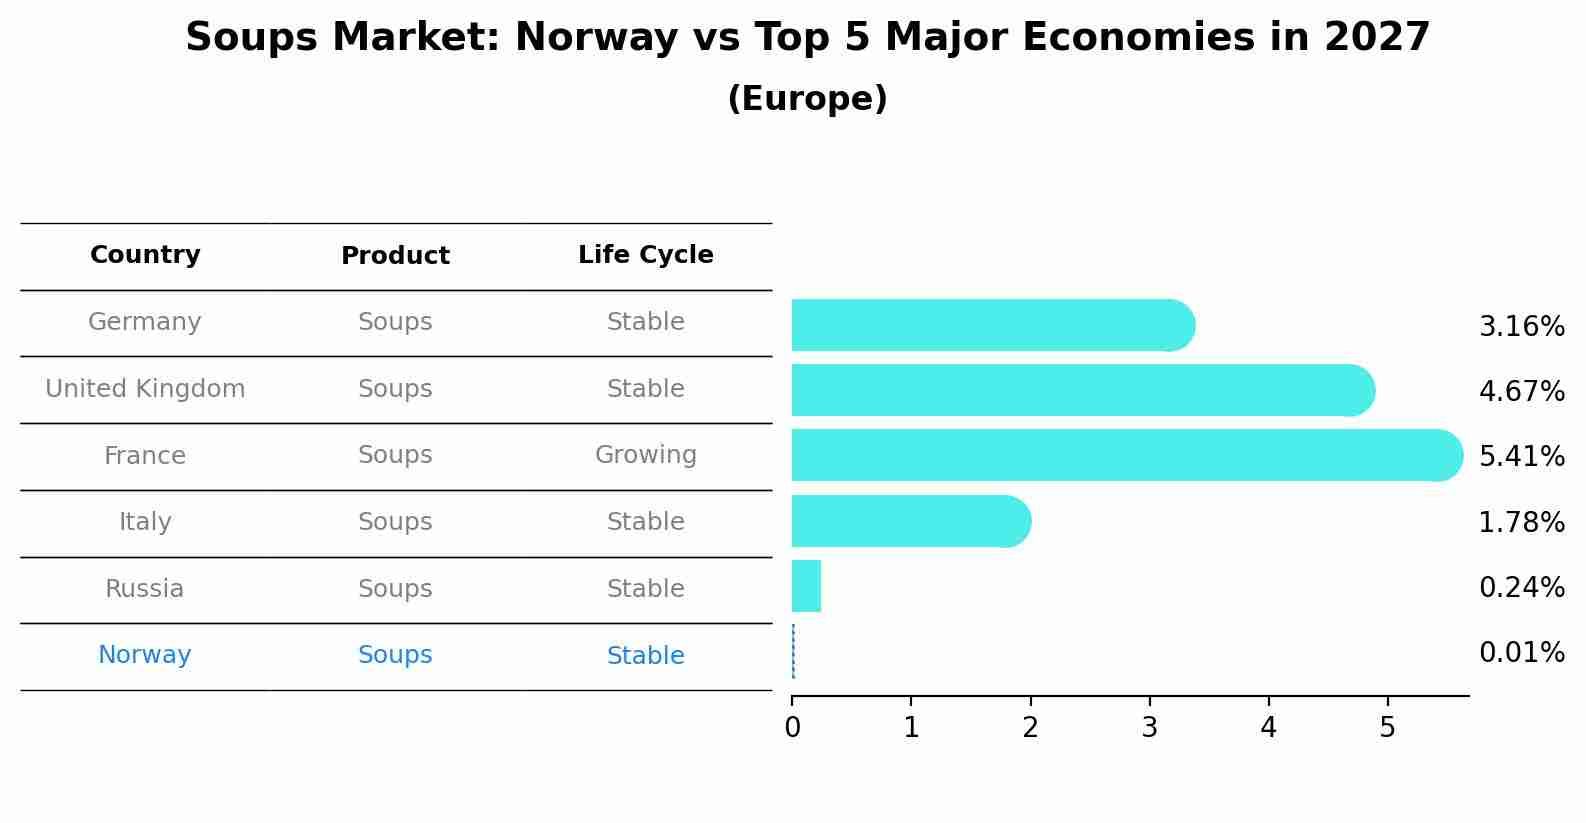
Soups Market: Norway vs Top 5 Major Economies in 2027 (Europe)
The Soups market in Norway is projected to grow at a stable growth rate of 0.01% by 2027, highlighting the country's increasing focus on advanced technologies within the Europe region, where Germany holds the dominant position, followed closely by United Kingdom, France, Italy and Russia, shaping overall regional demand.
Norway Soups Market Overview
The soups market in Norway is experiencing steady growth, driven by consumer preferences for convenience, healthy meals, and a rising demand for ready-to-eat products. With a strong focus on organic and locally sourced ingredients, Norwegian soup manufacturers are catering to the health-conscious population. The market includes a variety of offerings, such as canned, dehydrated, and fresh soups.
Drivers of the market
The soups market in Norway is driven by a rising trend towards convenience foods, particularly ready-to-eat and easy-to-prepare meals. Busy lifestyles and the increasing participation of women in the workforce have led to a demand for quick and nutritious meal options like soups. Additionally, growing health consciousness is pushing consumers to opt for soups made with organic ingredients, reduced sodium, and preservatives. The expanding variety of flavors and innovations in packaging also contribute to the market`s growth.
Challenges of the market
The soups market in Norway faces strong competition from homemade and fresh meal options as consumers lean toward healthier, less processed alternatives. Furthermore, there is increasing pressure on manufacturers to reduce salt, sugar, and preservatives while maintaining taste, which poses a formulation challenge. The seasonal nature of soup consumption also creates fluctuations in demand, making inventory management and consistent sales difficult for companies in this space.
Government Policy of the market
Norwegian policies encouraging local food production, health-conscious consumption, and sustainable packaging heavily influence the soups market. Government initiatives to reduce food waste and encourage the use of locally sourced, organic ingredients promote the growth of healthier and eco-friendly soup products. Additionally, Norways strict food safety regulations ensure that manufacturers comply with hygiene and quality standards.
Key Highlights of the Report:
- Norway Soups Market Outlook
- Market Size of Norway Soups Market, 2024
- Forecast of Norway Soups Market, 2031
- Historical Data and Forecast of Norway Soups Revenues & Volume for the Period 2021-2031
- Norway Soups Market Trend Evolution
- Norway Soups Market Drivers and Challenges
- Norway Soups Price Trends
- Norway Soups Porter`s Five Forces
- Norway Soups Industry Life Cycle
- Historical Data and Forecast of Norway Soups Market Revenues & Volume By Type for the Period 2021-2031
- Historical Data and Forecast of Norway Soups Market Revenues & Volume By Dry for the Period 2021-2031
- Historical Data and Forecast of Norway Soups Market Revenues & Volume By Wet for the Period 2021-2031
- Historical Data and Forecast of Norway Soups Market Revenues & Volume By Others for the Period 2021-2031
- Historical Data and Forecast of Norway Soups Market Revenues & Volume By Distribution Channel for the Period 2021-2031
- Historical Data and Forecast of Norway Soups Market Revenues & Volume By Supermarkets & Hypermarkets for the Period 2021-2031
- Historical Data and Forecast of Norway Soups Market Revenues & Volume By Convenience Stores for the Period 2021-2031
- Historical Data and Forecast of Norway Soups Market Revenues & Volume By Others for the Period 2021-2031
- Norway Soups Import Export Trade Statistics
- Market Opportunity Assessment By Type
- Market Opportunity Assessment By Distribution Channel
- Norway Soups Top Companies Market Share
- Norway Soups Competitive Benchmarking By Technical and Operational Parameters
- Norway Soups Company Profiles
- Norway Soups Key Strategic Recommendations
Frequently Asked Questions About the Market Study (FAQs):
6Wresearch actively monitors the Norway Soups Market and publishes its comprehensive annual report, highlighting emerging trends, growth drivers, revenue analysis, and forecast outlook. Our insights help businesses to make data-backed strategic decisions with ongoing market dynamics. Our analysts track relevent industries related to the Norway Soups Market, allowing our clients with actionable intelligence and reliable forecasts tailored to emerging regional needs.
Yes, we provide customisation as per your requirements. To learn more, feel free to contact us on sales@6wresearch.com
1 Executive Summary |
2 Introduction |
2.1 Key Highlights of the Report |
2.2 Report Description |
2.3 Market Scope & Segmentation |
2.4 Research Methodology |
2.5 Assumptions |
3 Norway Soups Market Overview |
3.1 Norway Country Macro Economic Indicators |
3.2 Norway Soups Market Revenues & Volume, 2021 & 2031F |
3.3 Norway Soups Market - Industry Life Cycle |
3.4 Norway Soups Market - Porter's Five Forces |
3.5 Norway Soups Market Revenues & Volume Share, By Type, 2021 & 2031F |
3.6 Norway Soups Market Revenues & Volume Share, By Distribution Channel, 2021 & 2031F |
4 Norway Soups Market Dynamics |
4.1 Impact Analysis |
4.2 Market Drivers |
4.2.1 Increasing health consciousness and demand for nutritious food options |
4.2.2 Growing adoption of convenience foods due to busy lifestyles |
4.2.3 Rising interest in exotic and international flavors |
4.3 Market Restraints |
4.3.1 Seasonality affecting demand for soups |
4.3.2 Competition from other convenience food options like ready meals |
4.3.3 Fluctuating raw material prices impacting production costs |
5 Norway Soups Market Trends |
6 Norway Soups Market Segmentations |
6.1 Norway Soups Market, By Type |
6.1.1 Overview and Analysis |
6.1.2 Norway Soups Market Revenues & Volume, By Dry, 2021-2031F |
6.1.3 Norway Soups Market Revenues & Volume, By Wet, 2021-2031F |
6.1.4 Norway Soups Market Revenues & Volume, By Others, 2021-2031F |
6.2 Norway Soups Market, By Distribution Channel |
6.2.1 Overview and Analysis |
6.2.2 Norway Soups Market Revenues & Volume, By Supermarkets & Hypermarkets, 2021-2031F |
6.2.3 Norway Soups Market Revenues & Volume, By Convenience Stores, 2021-2031F |
6.2.4 Norway Soups Market Revenues & Volume, By Others, 2021-2031F |
7 Norway Soups Market Import-Export Trade Statistics |
7.1 Norway Soups Market Export to Major Countries |
7.2 Norway Soups Market Imports from Major Countries |
8 Norway Soups Market Key Performance Indicators |
8.1 Consumer satisfaction scores for taste and quality of soups |
8.2 Number of new product launches with innovative flavors and packaging |
8.3 Percentage of repeat customers purchasing soups on a regular basis |
9 Norway Soups Market - Opportunity Assessment |
9.1 Norway Soups Market Opportunity Assessment, By Type, 2021 & 2031F |
9.2 Norway Soups Market Opportunity Assessment, By Distribution Channel, 2021 & 2031F |
10 Norway Soups Market - Competitive Landscape |
10.1 Norway Soups Market Revenue Share, By Companies, 2024 |
10.2 Norway Soups Market Competitive Benchmarking, By Operating and Technical Parameters |
11 Company Profiles |
12 Recommendations | 13 Disclaimer |
Global Go To Market Strategy - 2030
Export potential enables firms to identify high-growth global markets with greater confidence by combining advanced trade intelligence with a structured quantitative methodology. The framework analyzes emerging demand trends and country-level import patterns while integrating macroeconomic and trade datasets such as GDP and population forecasts, bilateral import–export flows, tariff structures, elasticity differentials between developed and developing economies, geographic distance, and import demand projections. Using weighted trade values from 2020–2024 as the base period to project country-to-country export potential for 2030, these inputs are operationalized through calculated drivers such as gravity model parameters, tariff impact factors, and projected GDP per-capita growth. Through an analysis of hidden potentials, demand hotspots, and market conditions that are most favorable to success, this method enables firms to focus on target countries, maximize returns, and global expansion with data, backed by accuracy.
By factoring in the projected importer demand gap that is currently unmet and could be potential opportunity, it identifies the potential for the Exporter (Country) among 190 countries, against the general trade analysis, which identifies the biggest importer or exporter.
To discover high-growth global markets and optimize your business strategy:
Click Here
Pricing
- Single User License$ 1,995
- Department License$ 2,400
- Site License$ 3,120
- Global License$ 3,795

Leadership Perspectives from Industry Events
Search
Thought Leadership and Analyst Meet


Our Clients
6WResearch In News
- Doha a strategic location for EV manufacturing hub: IPA Qatar
- Demand for luxury TVs surging in the GCC, says Samsung
- Empowering Growth: The Thriving Journey of Bangladesh’s Cable Industry
- Demand for luxury TVs surging in the GCC, says Samsung
- Video call with a traditional healer? Once unthinkable, it’s now common in South Africa
- Intelligent Buildings To Smooth GCC’s Path To Net Zero
Latest Reports
- New Zealand Aseptic Manufacturing Market (2026-2032)
- Netherlands Aseptic Manufacturing Market (2026-2032)
- Nauru Aseptic Manufacturing Market (2026-2032)
- Namibia Aseptic Manufacturing Market (2026-2032)
- Mozambique Aseptic Manufacturing Market (2026-2032)
- Montenegro Aseptic Manufacturing Market (2026-2032)
- Mongolia Aseptic Manufacturing Market (2026-2032)
- Monaco Aseptic Manufacturing Market (2026-2032)
- Micronesia Aseptic Manufacturing Market (2026-2032)
- Mauritius Aseptic Manufacturing Market (2026-2032)
Industry Events and Analyst Meet

HIMTEX 2026

India Refining Summit 2026

India EV Show 2026

EV tech India Expo 2026

Auto Tech Asia 2026
Whitepaper
- Middle East & Africa Commercial Security Market Click here to view more.
- Middle East & Africa Fire Safety Systems & Equipment Market Click here to view more.
- GCC Drone Market Click here to view more.
- Middle East Lighting Fixture Market Click here to view more.
- GCC Physical & Perimeter Security Market Click here to view more.