Pakistan Interactive Tables Market (2026-2032) Outlook | Companies, Value, Share, Size, Revenue, Forecast, Trends, Growth, Analysis & Industry
Market Forecast By Technology (LCD, LED, Capacitive, Others), By Screen Size (32-65 Inch, 65 Inch & Above), By Application (Exhibition & Trade Shows, Education, Retail, Control Room, Hospitality, Transportation, Others) And Competitive Landscape
| Product Code: ETC275077 | Publication Date: Aug 2022 | Updated Date: Mar 2026 | Product Type: Market Research Report | |
| Publisher: 6Wresearch | Author: Ravi Bhandari | No. of Pages: 75 | No. of Figures: 35 | No. of Tables: 20 |
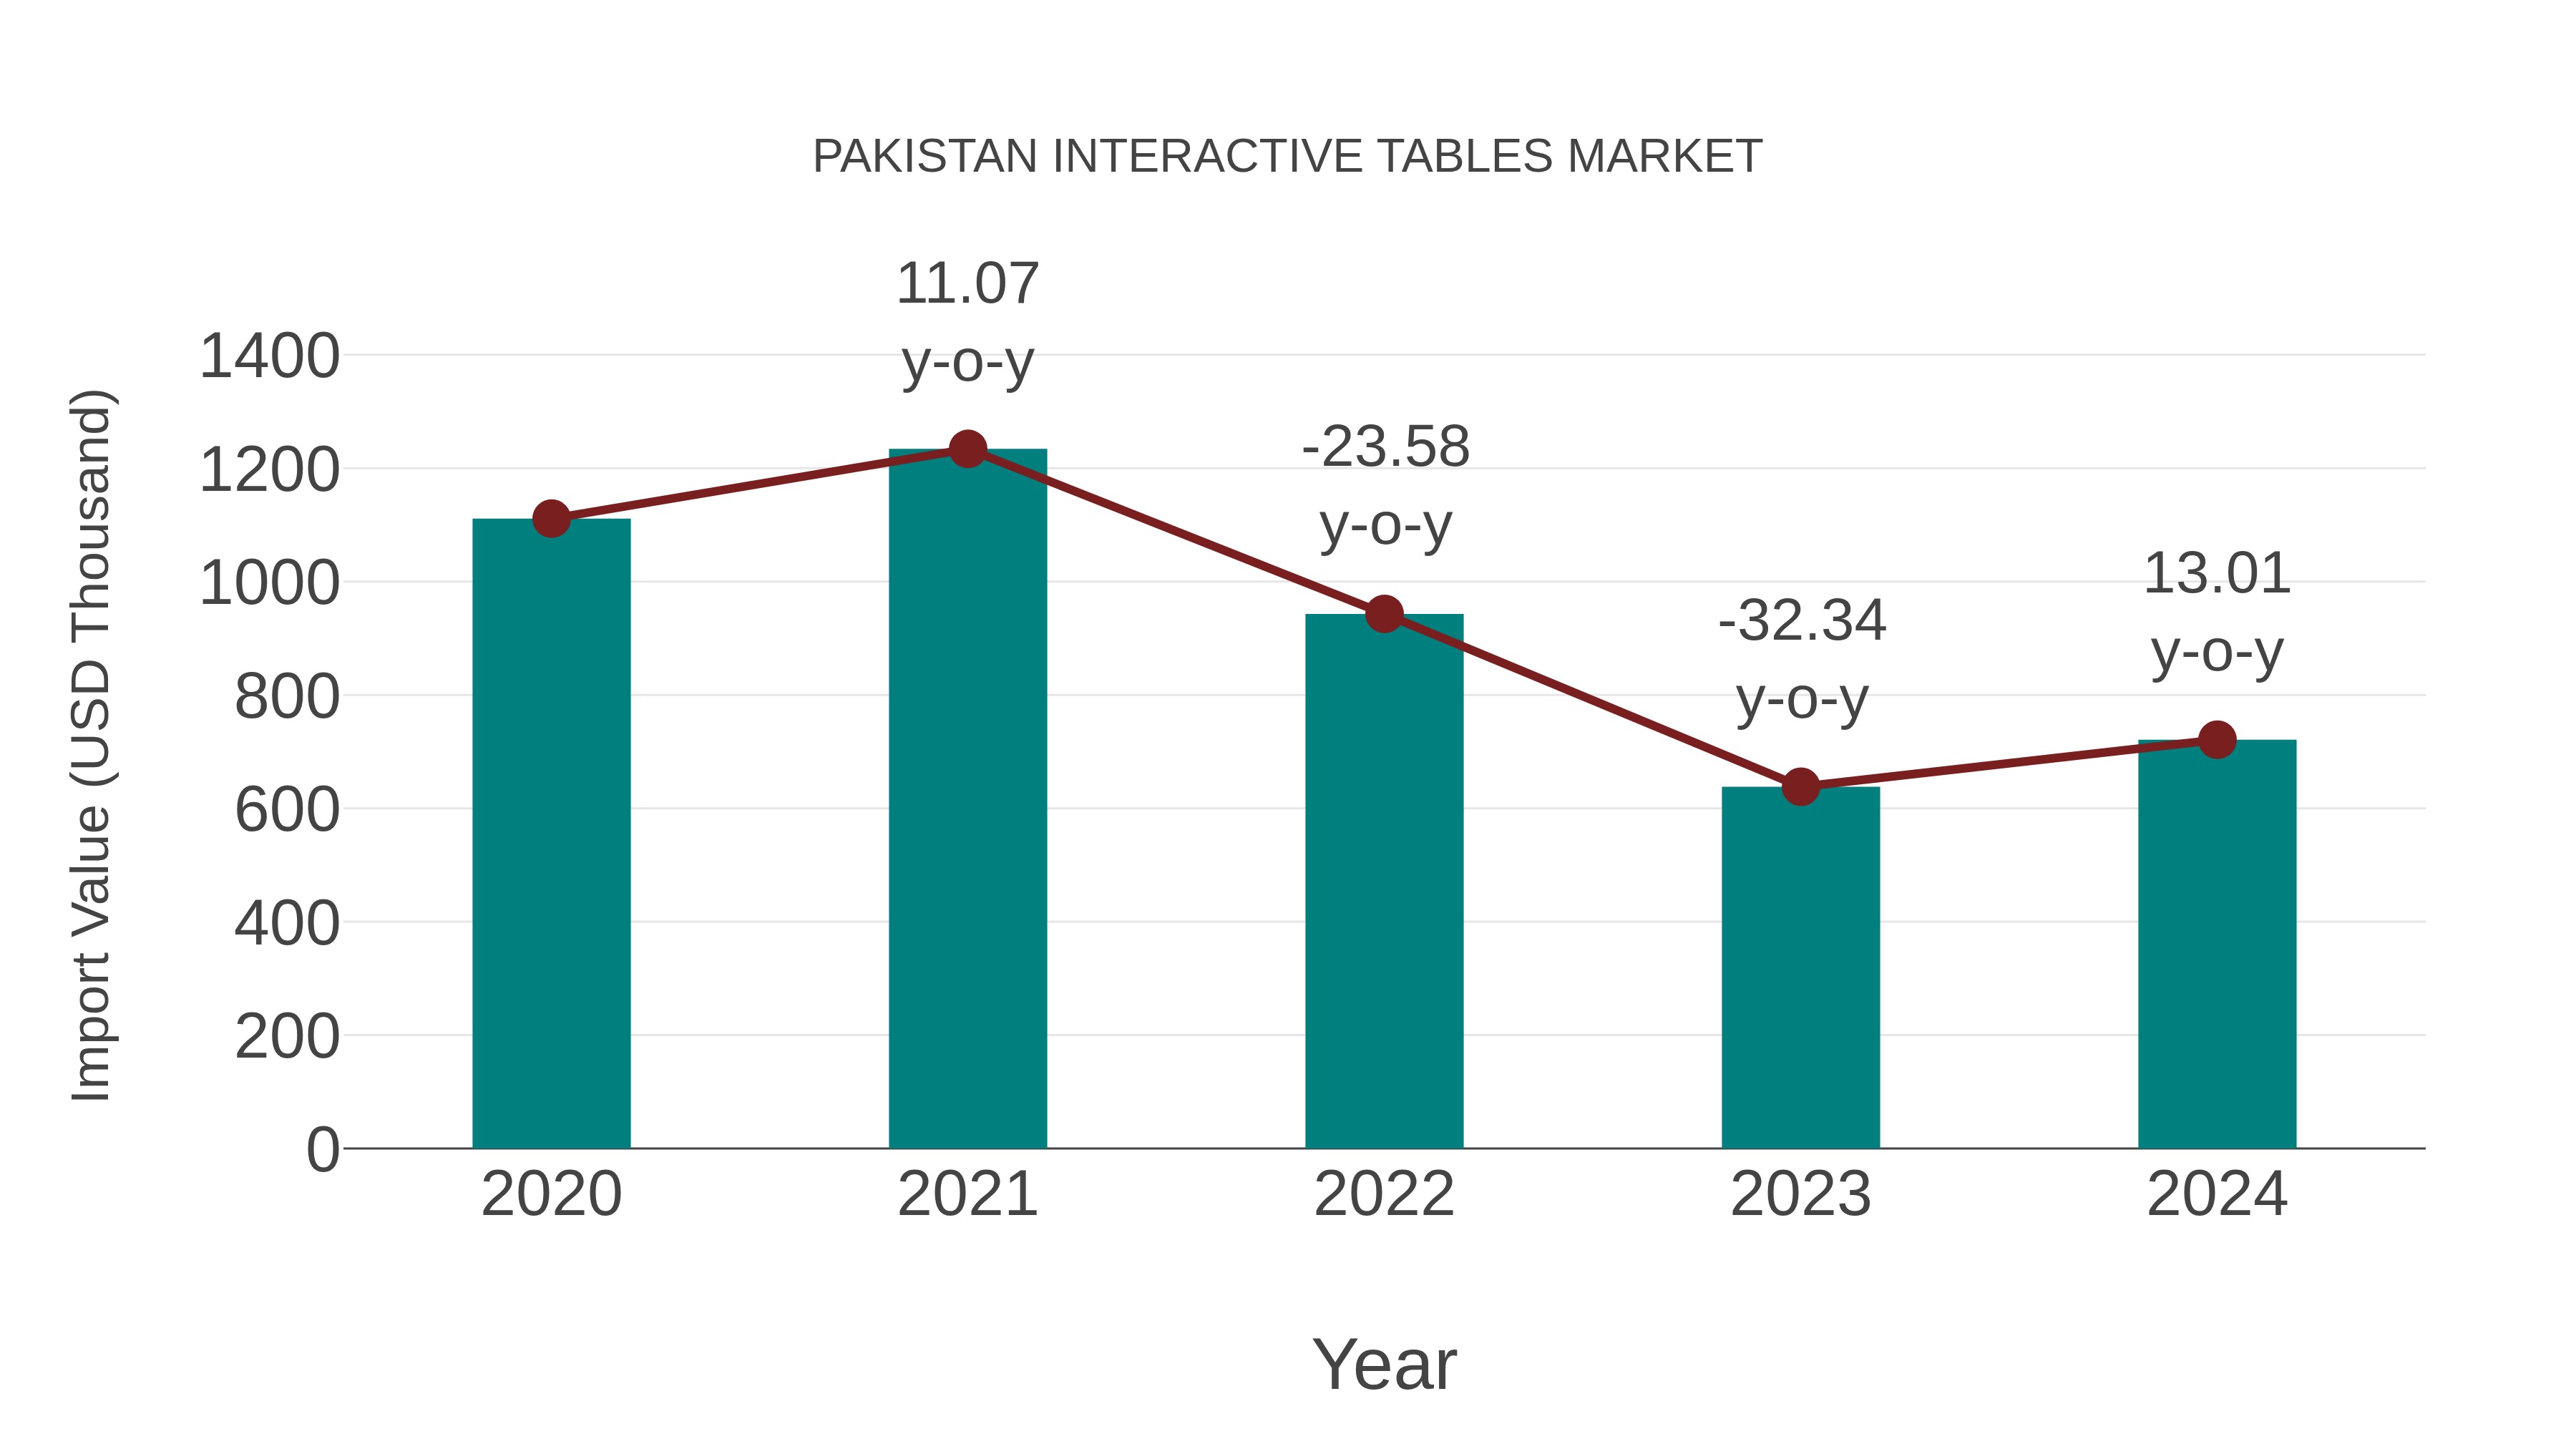
Pakistan Interactive Tables Market: Import Trend Analysis
Pakistan import trend for the interactive tables market showed a growth rate of 13.01% from 2023 to 2024. However, the compound annual growth rate (CAGR) for 2020-2024 was -10.25%. This decline could be attributed to shifts in consumer preferences towards more cost-effective solutions amidst economic challenges.
Pakistan Interactive Tables Market Overview
Interactive tables in Pakistan are being adopted in education, hospitality, and retail sectors. These tables provide an engaging and interactive user experience, facilitating collaboration and information sharing.
Drivers of the market
The interactive tables market is driven by the demand for advanced and engaging solutions in education, retail, and entertainment sectors. The adoption of touch-screen technology and the emphasis on improving user interaction are key drivers.
Challenges of the market
The interactive tables market in Pakistan is challenged by high costs and the need for specialized technical knowledge for installation and use. Limited awareness and understanding of the applications and benefits of interactive tables restrict market growth. The dependency on imported components increases vulnerability to supply chain issues. Additionally, ensuring user engagement and maintaining system functionality are significant concerns.
Government Policy of the market
The Pakistan Interactive Tables Market is witnessing rapid adoption in educational, retail, and hospitality sectors. Government initiatives to promote technology adoption and enhance customer experiences drive market growth. Interactive tables offer engaging and interactive experiences, enabling collaborative learning, interactive product demonstrations, and immersive brand experiences, enhancing customer engagement and loyalty.
Key Highlights of the Report:
- Pakistan Interactive Tables Market Outlook
- Market Size of Pakistan Interactive Tables Market, 2025
- Forecast of Pakistan Interactive Tables Market, 2032
- Historical Data and Forecast of Pakistan Interactive Tables Revenues & Volume for the Period 2022-2032F
- Pakistan Interactive Tables Market Trend Evolution
- Pakistan Interactive Tables Market Drivers and Challenges
- Pakistan Interactive Tables Price Trends
- Pakistan Interactive Tables Porter's Five Forces
- Pakistan Interactive Tables Industry Life Cycle
- Historical Data and Forecast of Pakistan Interactive Tables Market Revenues & Volume By Technology for the Period 2022-2032F
- Historical Data and Forecast of Pakistan Interactive Tables Market Revenues & Volume By LCD for the Period 2022-2032F
- Historical Data and Forecast of Pakistan Interactive Tables Market Revenues & Volume By LED for the Period 2022-2032F
- Historical Data and Forecast of Pakistan Interactive Tables Market Revenues & Volume By Capacitive for the Period 2022-2032F
- Historical Data and Forecast of Pakistan Interactive Tables Market Revenues & Volume By Others for the Period 2022-2032F
- Historical Data and Forecast of Pakistan Interactive Tables Market Revenues & Volume By Screen Size for the Period 2022-2032F
- Historical Data and Forecast of Pakistan Interactive Tables Market Revenues & Volume By 32-65 Inch for the Period 2022-2032F
- Historical Data and Forecast of Pakistan Interactive Tables Market Revenues & Volume By 65 Inch & Above for the Period 2022-2032F
- Historical Data and Forecast of Pakistan Interactive Tables Market Revenues & Volume By Application for the Period 2022-2032F
- Historical Data and Forecast of Pakistan Interactive Tables Market Revenues & Volume By Exhibition & Trade Shows for the Period 2022-2032F
- Historical Data and Forecast of Pakistan Interactive Tables Market Revenues & Volume By Education for the Period 2022-2032F
- Historical Data and Forecast of Pakistan Interactive Tables Market Revenues & Volume By Retail for the Period 2022-2032F
- Historical Data and Forecast of Pakistan Interactive Tables Market Revenues & Volume By Control Room for the Period 2022-2032F
- Historical Data and Forecast of Pakistan Interactive Tables Market Revenues & Volume By Hospitality for the Period 2022-2032F
- Historical Data and Forecast of Pakistan Interactive Tables Market Revenues & Volume By Transportation for the Period 2022-2032F
- Historical Data and Forecast of Pakistan Interactive Tables Market Revenues & Volume By Others for the Period 2022-2032F
- Pakistan Interactive Tables Import Export Trade Statistics
- Market Opportunity Assessment By Technology
- Market Opportunity Assessment By Screen Size
- Market Opportunity Assessment By Application
- Pakistan Interactive Tables Top Companies Market Share
- Pakistan Interactive Tables Competitive Benchmarking By Technical and Operational Parameters
- Pakistan Interactive Tables Company Profiles
- Pakistan Interactive Tables Key Strategic Recommendations
Pakistan Interactive Tables Market (2026-2032): FAQs
6Wresearch actively monitors the Pakistan Interactive Tables Market and publishes its comprehensive annual report, highlighting emerging trends, growth drivers, revenue analysis, and forecast outlook. Our insights help businesses to make data-backed strategic decisions with ongoing market dynamics. Our analysts track relevent industries related to the Pakistan Interactive Tables Market, allowing our clients with actionable intelligence and reliable forecasts tailored to emerging regional needs.
Yes, we provide customisation as per your requirements. To learn more, feel free to contact us on sales@6wresearch.com
1 Executive Summary |
2 Introduction |
2.1 Key Highlights of the Report |
2.2 Report Description |
2.3 Market Scope & Segmentation |
2.4 Research Methodology |
2.5 Assumptions |
3 Pakistan Interactive Tables Market Overview |
3.1 Pakistan Country Macro Economic Indicators |
3.2 Pakistan Interactive Tables Market Revenues & Volume, 2022 & 2032F |
3.3 Pakistan Interactive Tables Market - Industry Life Cycle |
3.4 Pakistan Interactive Tables Market - Porter's Five Forces |
3.5 Pakistan Interactive Tables Market Revenues & Volume Share, By Technology, 2022 & 2032F |
3.6 Pakistan Interactive Tables Market Revenues & Volume Share, By Screen Size, 2022 & 2032F |
3.7 Pakistan Interactive Tables Market Revenues & Volume Share, By Application, 2022 & 2032F |
4 Pakistan Interactive Tables Market Dynamics |
4.1 Impact Analysis |
4.2 Market Drivers |
4.2.1 Increasing demand for interactive and engaging technology solutions in educational institutions and corporate settings. |
4.2.2 Growing focus on technology integration in various industries to enhance customer experience and operational efficiency. |
4.2.3 Rising disposable income and urbanization leading to higher adoption of interactive tables in public spaces and entertainment venues. |
4.3 Market Restraints |
4.3.1 High initial investment costs associated with implementing interactive table solutions may hinder widespread adoption. |
4.3.2 Limited awareness and understanding of interactive table technology among potential end-users. |
4.3.3 Lack of standardized regulations and guidelines for interactive table usage in public spaces may pose challenges for market growth. |
5 Pakistan Interactive Tables Market Trends |
6 Pakistan Interactive Tables Market, By Types |
6.1 Pakistan Interactive Tables Market, By Technology |
6.1.1 Overview and Analysis |
6.1.2 Pakistan Interactive Tables Market Revenues & Volume, By Technology, 2022-2032F |
6.1.3 Pakistan Interactive Tables Market Revenues & Volume, By LCD, 2022-2032F |
6.1.4 Pakistan Interactive Tables Market Revenues & Volume, By LED, 2022-2032F |
6.1.5 Pakistan Interactive Tables Market Revenues & Volume, By Capacitive, 2022-2032F |
6.1.6 Pakistan Interactive Tables Market Revenues & Volume, By Others, 2022-2032F |
6.2 Pakistan Interactive Tables Market, By Screen Size |
6.2.1 Overview and Analysis |
6.2.2 Pakistan Interactive Tables Market Revenues & Volume, By 32-65 Inch, 2022-2032F |
6.2.3 Pakistan Interactive Tables Market Revenues & Volume, By 65 Inch & Above, 2022-2032F |
6.3 Pakistan Interactive Tables Market, By Application |
6.3.1 Overview and Analysis |
6.3.2 Pakistan Interactive Tables Market Revenues & Volume, By Exhibition & Trade Shows, 2022-2032F |
6.3.3 Pakistan Interactive Tables Market Revenues & Volume, By Education, 2022-2032F |
6.3.4 Pakistan Interactive Tables Market Revenues & Volume, By Retail, 2022-2032F |
6.3.5 Pakistan Interactive Tables Market Revenues & Volume, By Control Room, 2022-2032F |
6.3.6 Pakistan Interactive Tables Market Revenues & Volume, By Hospitality, 2022-2032F |
6.3.7 Pakistan Interactive Tables Market Revenues & Volume, By Transportation, 2022-2032F |
7 Pakistan Interactive Tables Market Import-Export Trade Statistics |
7.1 Pakistan Interactive Tables Market Export to Major Countries |
7.2 Pakistan Interactive Tables Market Imports from Major Countries |
8 Pakistan Interactive Tables Market Key Performance Indicators |
8.1 Average time spent per user on interactive tables in public spaces. |
8.2 Number of interactive table installations in educational institutions and corporate offices. |
8.3 Percentage increase in demand for interactive table solutions in the retail and hospitality sectors. |
9 Pakistan Interactive Tables Market - Opportunity Assessment |
9.1 Pakistan Interactive Tables Market Opportunity Assessment, By Technology, 2022 & 2032F |
9.2 Pakistan Interactive Tables Market Opportunity Assessment, By Screen Size, 2022 & 2032F |
9.3 Pakistan Interactive Tables Market Opportunity Assessment, By Application, 2022 & 2032F |
10 Pakistan Interactive Tables Market - Competitive Landscape |
10.1 Pakistan Interactive Tables Market Revenue Share, By Companies, 2025 |
10.2 Pakistan Interactive Tables Market Competitive Benchmarking, By Operating and Technical Parameters |
11 Company Profiles |
12 Recommendations |
13 Disclaimer |
Global Go To Market Strategy - 2030
Export potential enables firms to identify high-growth global markets with greater confidence by combining advanced trade intelligence with a structured quantitative methodology. The framework analyzes emerging demand trends and country-level import patterns while integrating macroeconomic and trade datasets such as GDP and population forecasts, bilateral import–export flows, tariff structures, elasticity differentials between developed and developing economies, geographic distance, and import demand projections. Using weighted trade values from 2020–2024 as the base period to project country-to-country export potential for 2030, these inputs are operationalized through calculated drivers such as gravity model parameters, tariff impact factors, and projected GDP per-capita growth. Through an analysis of hidden potentials, demand hotspots, and market conditions that are most favorable to success, this method enables firms to focus on target countries, maximize returns, and global expansion with data, backed by accuracy.
By factoring in the projected importer demand gap that is currently unmet and could be potential opportunity, it identifies the potential for the Exporter (Country) among 190 countries, against the general trade analysis, which identifies the biggest importer or exporter.
To discover high-growth global markets and optimize your business strategy:
Click Here
Pricing
- Single User License$ 1,995
- Department License$ 2,400
- Site License$ 3,120
- Global License$ 3,795

Leadership Perspectives from Industry Events
Search
Thought Leadership and Analyst Meet


Our Clients
6WResearch In News
- India Air Conditioner Market Set for Strong Rebound in 2026 After Weather-Led Correction and GST-Driven Recovery: 6Wresearch
- ADAS in India: How Automatic Emergency Braking, Blind Spot Detection & Driver Monitoring are Transforming Road Safety
- Doha a strategic location for EV manufacturing hub: IPA Qatar
- Demand for luxury TVs surging in the GCC, says Samsung
- Empowering Growth: The Thriving Journey of Bangladesh’s Cable Industry
- Demand for luxury TVs surging in the GCC, says Samsung
Latest Reports
- Nicaragua RPG Gaming Market (2026-2032)
- New Zealand RPG Gaming Market (2026-2032)
- Netherlands RPG Gaming Market (2026-2032)
- Nauru RPG Gaming Market (2026-2032)
- Namibia RPG Gaming Market (2026-2032)
- Mozambique RPG Gaming Market (2026-2032)
- Montenegro RPG Gaming Market (2026-2032)
- Mongolia RPG Gaming Market (2026-2032)
- Monaco RPG Gaming Market (2026-2032)
- Micronesia RPG Gaming Market (2026-2032)
Industry Events and Analyst Meet

EV India Expo 2026

HIMTEX 2026

India Refining Summit 2026

India EV Show 2026

EV tech India Expo 2026
Whitepaper
- Middle East & Africa Commercial Security Market Click here to view more.
- Middle East & Africa Fire Safety Systems & Equipment Market Click here to view more.
- GCC Drone Market Click here to view more.
- Middle East Lighting Fixture Market Click here to view more.
- GCC Physical & Perimeter Security Market Click here to view more.