Pakistan Inventory Tags Market (2026-2032) Outlook | Size, Forecast, Value, Share, Revenue, Companies, Analysis, Trends, Industry & Growth
Market Forecast By Technology (Barcodes, RFID), By Label Type (Plastic, Paper, Metal), By Printing technology (Digital Printing, Flexography, Lithography, Screen Printing, Gravure, Others) And Competitive Landscape
| Product Code: ETC4601318 | Publication Date: Jul 2023 | Updated Date: Mar 2026 | Product Type: Report | |
| Publisher: 6Wresearch | Author: Summon Dutta | No. of Pages: 85 | No. of Figures: 45 | No. of Tables: 25 |
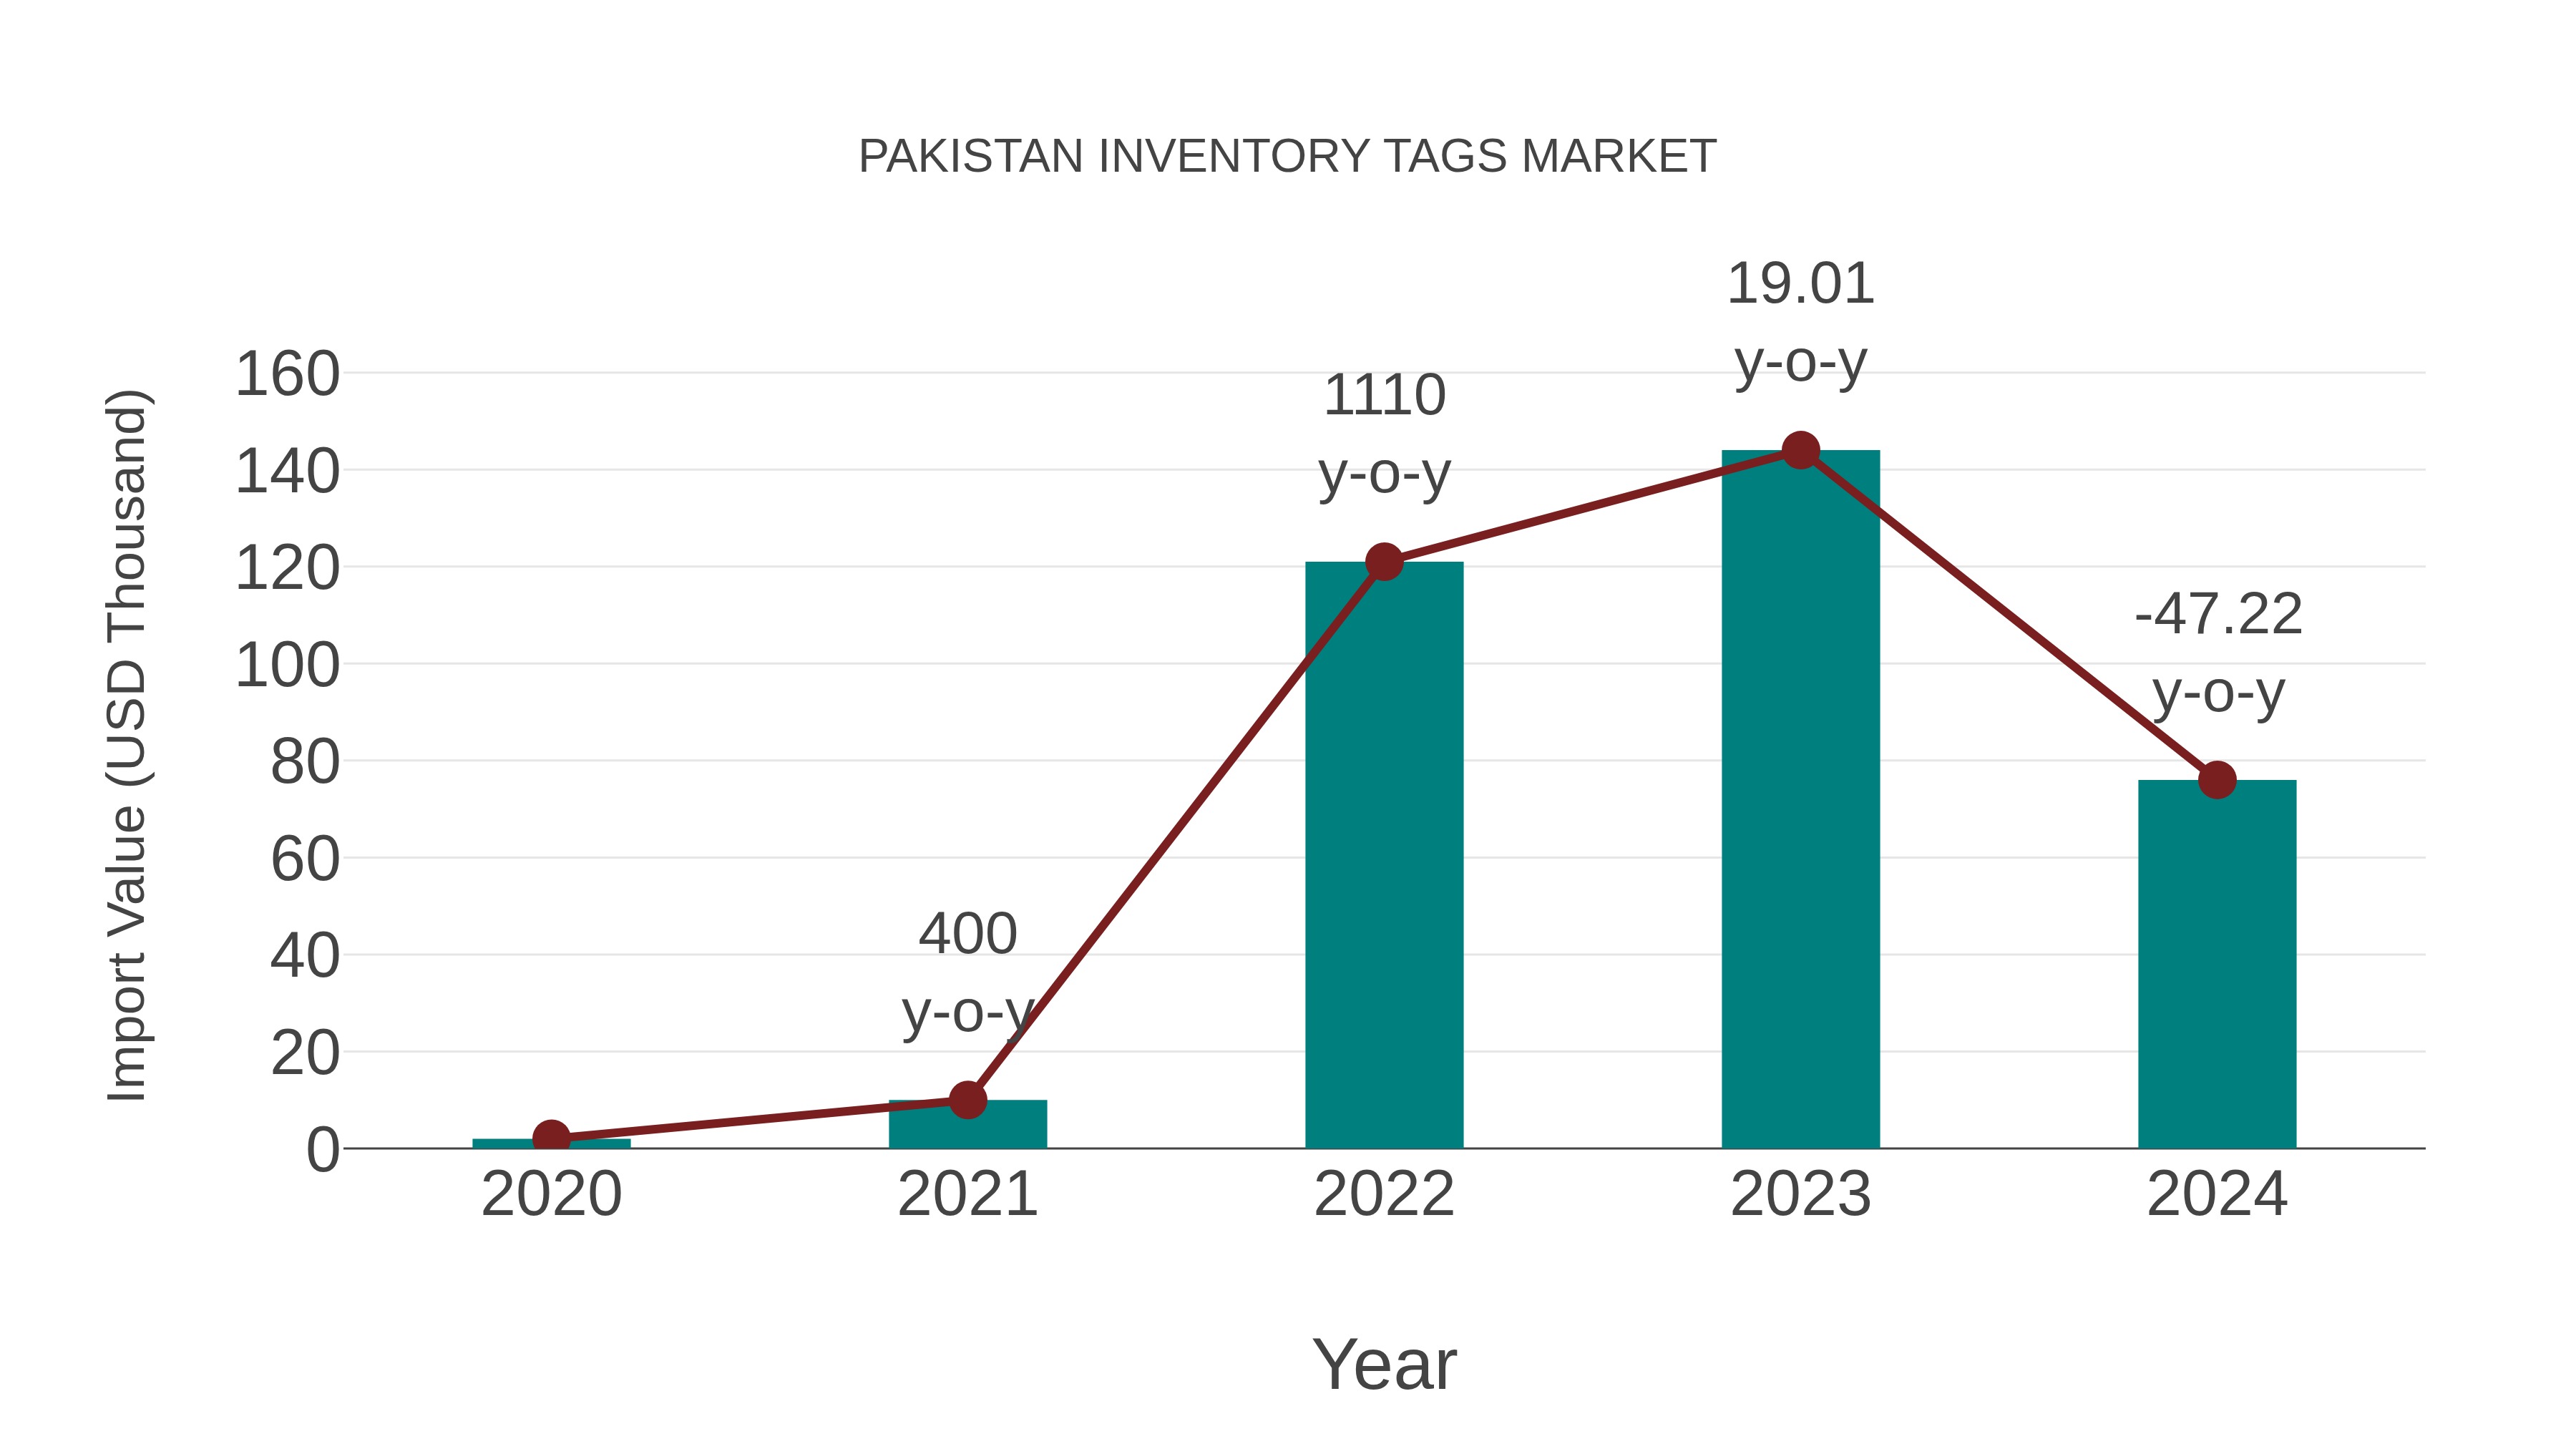
Pakistan Inventory Tags Market: Import Trend Analysis
Pakistan import trend for inventory tags market saw a decline of -47.22% from 2023 to 2024. However, the compound annual growth rate (CAGR) for 2020-2024 stood at an impressive 148.28%. This significant drop in imports in 2024 could be attributed to changing trade policies or shifts in market demand.
Pakistan Inventory Tags Market Overview
The inventory tags market in Pakistan is expanding as businesses seek efficient inventory management solutions. RFID and barcode tags enhance tracking, accuracy, and efficiency in supply chain and warehouse operations.
Drivers of the market
The inventory tags market is fueled by the demand for efficient inventory management solutions in retail, manufacturing, and logistics sectors. The growth of these sectors and the emphasis on improving supply chain visibility and accuracy are key drivers.
Challenges of the market
The inventory tags market in Pakistan encounters high costs for advanced tagging systems and the need for technical expertise for implementation and management. Limited awareness and understanding of the benefits of inventory tags among businesses hinder market growth. The dependency on imported materials and technology increases vulnerability to supply chain issues. Ensuring data accuracy and integrating inventory tags with existing systems are significant challenges.
Government Policy of the market
The Pakistan Inventory Tags Market is witnessing growth as businesses adopt advanced tracking and management systems. Government policies emphasizing inventory optimization and supply chain efficiency drive market expansion. Inventory tags enable real-time asset tracking, inventory visibility, and loss prevention, enhancing operational efficiency and reducing costs for businesses across various industries.
Key Highlights of the Report:
- Pakistan Inventory Tags Market Outlook
- Market Size of Pakistan Inventory Tags Market, 2025
- Forecast of Pakistan Inventory Tags Market, 2032
- Historical Data and Forecast of Pakistan Inventory Tags Revenues & Volume for the Period 2022-2032F
- Pakistan Inventory Tags Market Trend Evolution
- Pakistan Inventory Tags Market Drivers and Challenges
- Pakistan Inventory Tags Price Trends
- Pakistan Inventory Tags Porter's Five Forces
- Pakistan Inventory Tags Industry Life Cycle
- Historical Data and Forecast of Pakistan Inventory Tags Market Revenues & Volume By Technology for the Period 2022-2032F
- Historical Data and Forecast of Pakistan Inventory Tags Market Revenues & Volume By Barcodes for the Period 2022-2032F
- Historical Data and Forecast of Pakistan Inventory Tags Market Revenues & Volume By RFID for the Period 2022-2032F
- Historical Data and Forecast of Pakistan Inventory Tags Market Revenues & Volume By Label Type for the Period 2022-2032F
- Historical Data and Forecast of Pakistan Inventory Tags Market Revenues & Volume By Plastic for the Period 2022-2032F
- Historical Data and Forecast of Pakistan Inventory Tags Market Revenues & Volume By Paper for the Period 2022-2032F
- Historical Data and Forecast of Pakistan Inventory Tags Market Revenues & Volume By Metal for the Period 2022-2032F
- Historical Data and Forecast of Pakistan Inventory Tags Market Revenues & Volume By Printing technology for the Period 2022-2032F
- Historical Data and Forecast of Pakistan Inventory Tags Market Revenues & Volume By Digital Printing for the Period 2022-2032F
- Historical Data and Forecast of Pakistan Inventory Tags Market Revenues & Volume By Flexography for the Period 2022-2032F
- Historical Data and Forecast of Pakistan Inventory Tags Market Revenues & Volume By Lithography for the Period 2022-2032F
- Historical Data and Forecast of Pakistan Inventory Tags Market Revenues & Volume By Screen Printing for the Period 2022-2032F
- Historical Data and Forecast of Pakistan Inventory Tags Market Revenues & Volume By Gravure for the Period 2022-2032F
- Historical Data and Forecast of Pakistan Inventory Tags Market Revenues & Volume By Others for the Period 2022-2032F
- Pakistan Inventory Tags Import Export Trade Statistics
- Market Opportunity Assessment By Technology
- Market Opportunity Assessment By Label Type
- Market Opportunity Assessment By Printing technology
- Pakistan Inventory Tags Top Companies Market Share
- Pakistan Inventory Tags Competitive Benchmarking By Technical and Operational Parameters
- Pakistan Inventory Tags Company Profiles
- Pakistan Inventory Tags Key Strategic Recommendations
Pakistan Inventory Tags Market (2026-2032): FAQs
The Pakistan inventory tags market is expected to witness growth in the coming years driven by increasing adoption of RFID technology by companies like TCS Pakistan and Netsol Technologies for efficient inventory management.
The Pakistan inventory tags market encompasses a wide range of products used for tracking and managing inventory in various industries such as retail, manufacturing, healthcare, and logistics. Companies like Avery Dennison, Zebra Technologies, and CCL Industries are prominent players offering RFID tags, barcode labels, and other tracking solutions to help businesses improve inventory management efficiency and accuracy.
Consumers in Pakistan are increasingly demanding RFID-enabled inventory tags for improved tracking and management, leading companies like TPL Trakker and Systems Limited to develop advanced solutions. Additionally, the adoption of cloud-based inventory management systems is on the rise, driven by the need for real-time data access and analytics. On the policy front, the Pakistani government's initiatives to promote digitalization and e-commerce are influencing the adoption of inventory tagging technologies across various industries.
The Pakistan inventory tags market is primarily driven by the increasing adoption of RFID technology by major retail players such as Gul Ahmed and Khaadi to improve inventory management efficiency. However, challenges such as the high initial investment costs and the lack of awareness among small businesses hinder market growth. The dynamics of this market are also influenced by the government initiatives to promote digitalization and the entry of international players like Avery Dennison offering advanced solutions for inventory tracking.
The growth of the Pakistan inventory tags market is primarily driven by the increasing adoption of RFID technology by major companies like TCS (Tranzum Companies & Services) and M&P (Mian & Pervaiz). This technology enables efficient tracking and management of inventory, leading to improved operational processes and reduced losses due to theft or misplacement. Additionally, the growing e-commerce sector in Pakistan, exemplified by brands like Daraz.pk, is fueling the demand for advanced inventory management solutions, further propelling the market growth.
6Wresearch actively monitors the Pakistan Inventory Tags Market and publishes its comprehensive annual report, highlighting emerging trends, growth drivers, revenue analysis, and forecast outlook. Our insights help businesses to make data-backed strategic decisions with ongoing market dynamics. Our analysts track relevent industries related to the Pakistan Inventory Tags Market, allowing our clients with actionable intelligence and reliable forecasts tailored to emerging regional needs.
Yes, we provide customisation as per your requirements. To learn more, feel free to contact us on sales@6wresearch.com
1 Executive Summary |
2 Introduction |
2.1 Key Highlights of the Report |
2.2 Report Description |
2.3 Market Scope & Segmentation |
2.4 Research Methodology |
2.5 Assumptions |
3 Pakistan Inventory Tags Market Overview |
3.1 Pakistan Country Macro Economic Indicators |
3.2 Pakistan Inventory Tags Market Revenues & Volume, 2022 & 2032F |
3.3 Pakistan Inventory Tags Market - Industry Life Cycle |
3.4 Pakistan Inventory Tags Market - Porter's Five Forces |
3.5 Pakistan Inventory Tags Market Revenues & Volume Share, By Technology, 2022 & 2032F |
3.6 Pakistan Inventory Tags Market Revenues & Volume Share, By Label Type, 2022 & 2032F |
3.7 Pakistan Inventory Tags Market Revenues & Volume Share, By Printing technology, 2022 & 2032F |
4 Pakistan Inventory Tags Market Dynamics |
4.1 Impact Analysis |
4.2 Market Drivers |
4.2.1 Increasing adoption of inventory management systems in Pakistan |
4.2.2 Growing awareness about the importance of tracking and managing inventory efficiently |
4.2.3 Government initiatives promoting digitization and automation in businesses |
4.3 Market Restraints |
4.3.1 High initial investment required for implementing inventory tagging systems |
4.3.2 Lack of skilled workforce for operating and maintaining inventory management technologies |
4.3.3 Concerns regarding data security and privacy in using inventory tags |
5 Pakistan Inventory Tags Market Trends |
6 Pakistan Inventory Tags Market, By Types |
6.1 Pakistan Inventory Tags Market, By Technology |
6.1.1 Overview and Analysis |
6.1.2 Pakistan Inventory Tags Market Revenues & Volume, By Technology, 2022-2032F |
6.1.3 Pakistan Inventory Tags Market Revenues & Volume, By Barcodes, 2022-2032F |
6.1.4 Pakistan Inventory Tags Market Revenues & Volume, By RFID, 2022-2032F |
6.2 Pakistan Inventory Tags Market, By Label Type |
6.2.1 Overview and Analysis |
6.2.2 Pakistan Inventory Tags Market Revenues & Volume, By Plastic, 2022-2032F |
6.2.3 Pakistan Inventory Tags Market Revenues & Volume, By Paper, 2022-2032F |
6.2.4 Pakistan Inventory Tags Market Revenues & Volume, By Metal, 2022-2032F |
6.3 Pakistan Inventory Tags Market, By Printing technology |
6.3.1 Overview and Analysis |
6.3.2 Pakistan Inventory Tags Market Revenues & Volume, By Digital Printing, 2022-2032F |
6.3.3 Pakistan Inventory Tags Market Revenues & Volume, By Flexography, 2022-2032F |
6.3.4 Pakistan Inventory Tags Market Revenues & Volume, By Lithography, 2022-2032F |
6.3.5 Pakistan Inventory Tags Market Revenues & Volume, By Screen Printing, 2022-2032F |
6.3.6 Pakistan Inventory Tags Market Revenues & Volume, By Gravure, 2022-2032F |
6.3.7 Pakistan Inventory Tags Market Revenues & Volume, By Others, 2022-2032F |
7 Pakistan Inventory Tags Market Import-Export Trade Statistics |
7.1 Pakistan Inventory Tags Market Export to Major Countries |
7.2 Pakistan Inventory Tags Market Imports from Major Countries |
8 Pakistan Inventory Tags Market Key Performance Indicators |
8.1 Percentage increase in the number of businesses adopting inventory management systems |
8.2 Average time saved in inventory tracking and management processes after implementing inventory tagging solutions |
8.3 Reduction in inventory discrepancies and stockouts after the deployment of inventory tags |
9 Pakistan Inventory Tags Market - Opportunity Assessment |
9.1 Pakistan Inventory Tags Market Opportunity Assessment, By Technology, 2022 & 2032F |
9.2 Pakistan Inventory Tags Market Opportunity Assessment, By Label Type, 2022 & 2032F |
9.3 Pakistan Inventory Tags Market Opportunity Assessment, By Printing technology, 2022 & 2032F |
10 Pakistan Inventory Tags Market - Competitive Landscape |
10.1 Pakistan Inventory Tags Market Revenue Share, By Companies, 2025 |
10.2 Pakistan Inventory Tags Market Competitive Benchmarking, By Operating and Technical Parameters |
11 Company Profiles |
12 Recommendations |
13 Disclaimer |
Global Go To Market Strategy - 2030
Export potential enables firms to identify high-growth global markets with greater confidence by combining advanced trade intelligence with a structured quantitative methodology. The framework analyzes emerging demand trends and country-level import patterns while integrating macroeconomic and trade datasets such as GDP and population forecasts, bilateral import–export flows, tariff structures, elasticity differentials between developed and developing economies, geographic distance, and import demand projections. Using weighted trade values from 2020–2024 as the base period to project country-to-country export potential for 2030, these inputs are operationalized through calculated drivers such as gravity model parameters, tariff impact factors, and projected GDP per-capita growth. Through an analysis of hidden potentials, demand hotspots, and market conditions that are most favorable to success, this method enables firms to focus on target countries, maximize returns, and global expansion with data, backed by accuracy.
By factoring in the projected importer demand gap that is currently unmet and could be potential opportunity, it identifies the potential for the Exporter (Country) among 190 countries, against the general trade analysis, which identifies the biggest importer or exporter.
To discover high-growth global markets and optimize your business strategy:
Click Here
Pricing
- Single User License$ 1,995
- Department License$ 2,400
- Site License$ 3,120
- Global License$ 3,795

Leadership Perspectives from Industry Events
Search
Thought Leadership and Analyst Meet


Our Clients
6WResearch In News
- India Export Attractiveness Tracker 2026
- India Air Conditioner Market Set for Strong Rebound in 2026 After Weather-Led Correction and GST-Driven Recovery: 6Wresearch
- ADAS in India: How Automatic Emergency Braking, Blind Spot Detection & Driver Monitoring are Transforming Road Safety
- Doha a strategic location for EV manufacturing hub: IPA Qatar
- Demand for luxury TVs surging in the GCC, says Samsung
- Empowering Growth: The Thriving Journey of Bangladesh’s Cable Industry
Latest Reports
- Nicaragua RPG Gaming Market (2026-2032)
- New Zealand RPG Gaming Market (2026-2032)
- Netherlands RPG Gaming Market (2026-2032)
- Nauru RPG Gaming Market (2026-2032)
- Namibia RPG Gaming Market (2026-2032)
- Mozambique RPG Gaming Market (2026-2032)
- Montenegro RPG Gaming Market (2026-2032)
- Mongolia RPG Gaming Market (2026-2032)
- Monaco RPG Gaming Market (2026-2032)
- Micronesia RPG Gaming Market (2026-2032)
Industry Events and Analyst Meet

EV India Expo 2026

HIMTEX 2026

India Refining Summit 2026

India EV Show 2026

EV tech India Expo 2026
Whitepaper
- Middle East & Africa Commercial Security Market Click here to view more.
- Middle East & Africa Fire Safety Systems & Equipment Market Click here to view more.
- GCC Drone Market Click here to view more.
- Middle East Lighting Fixture Market Click here to view more.
- GCC Physical & Perimeter Security Market Click here to view more.