Pakistan Laminated Labels Market (2026-2032) Outlook | Forecast, Share, Industry, Size, Growth, Analysis, Trends, Revenue, Value & Companies
Market Forecast By Composition (Facestock, adhesive, release liner), By Printing ink (water-based, solvent-based, holt melt-based, UV curable), By Printing technology (Digital, Flexographic, Lithography) And Competitive Landscape
| Product Code: ETC4601378 | Publication Date: Jul 2023 | Updated Date: Mar 2026 | Product Type: Report | |
| Publisher: 6Wresearch | Author: Summon Dutta | No. of Pages: 85 | No. of Figures: 45 | No. of Tables: 25 |
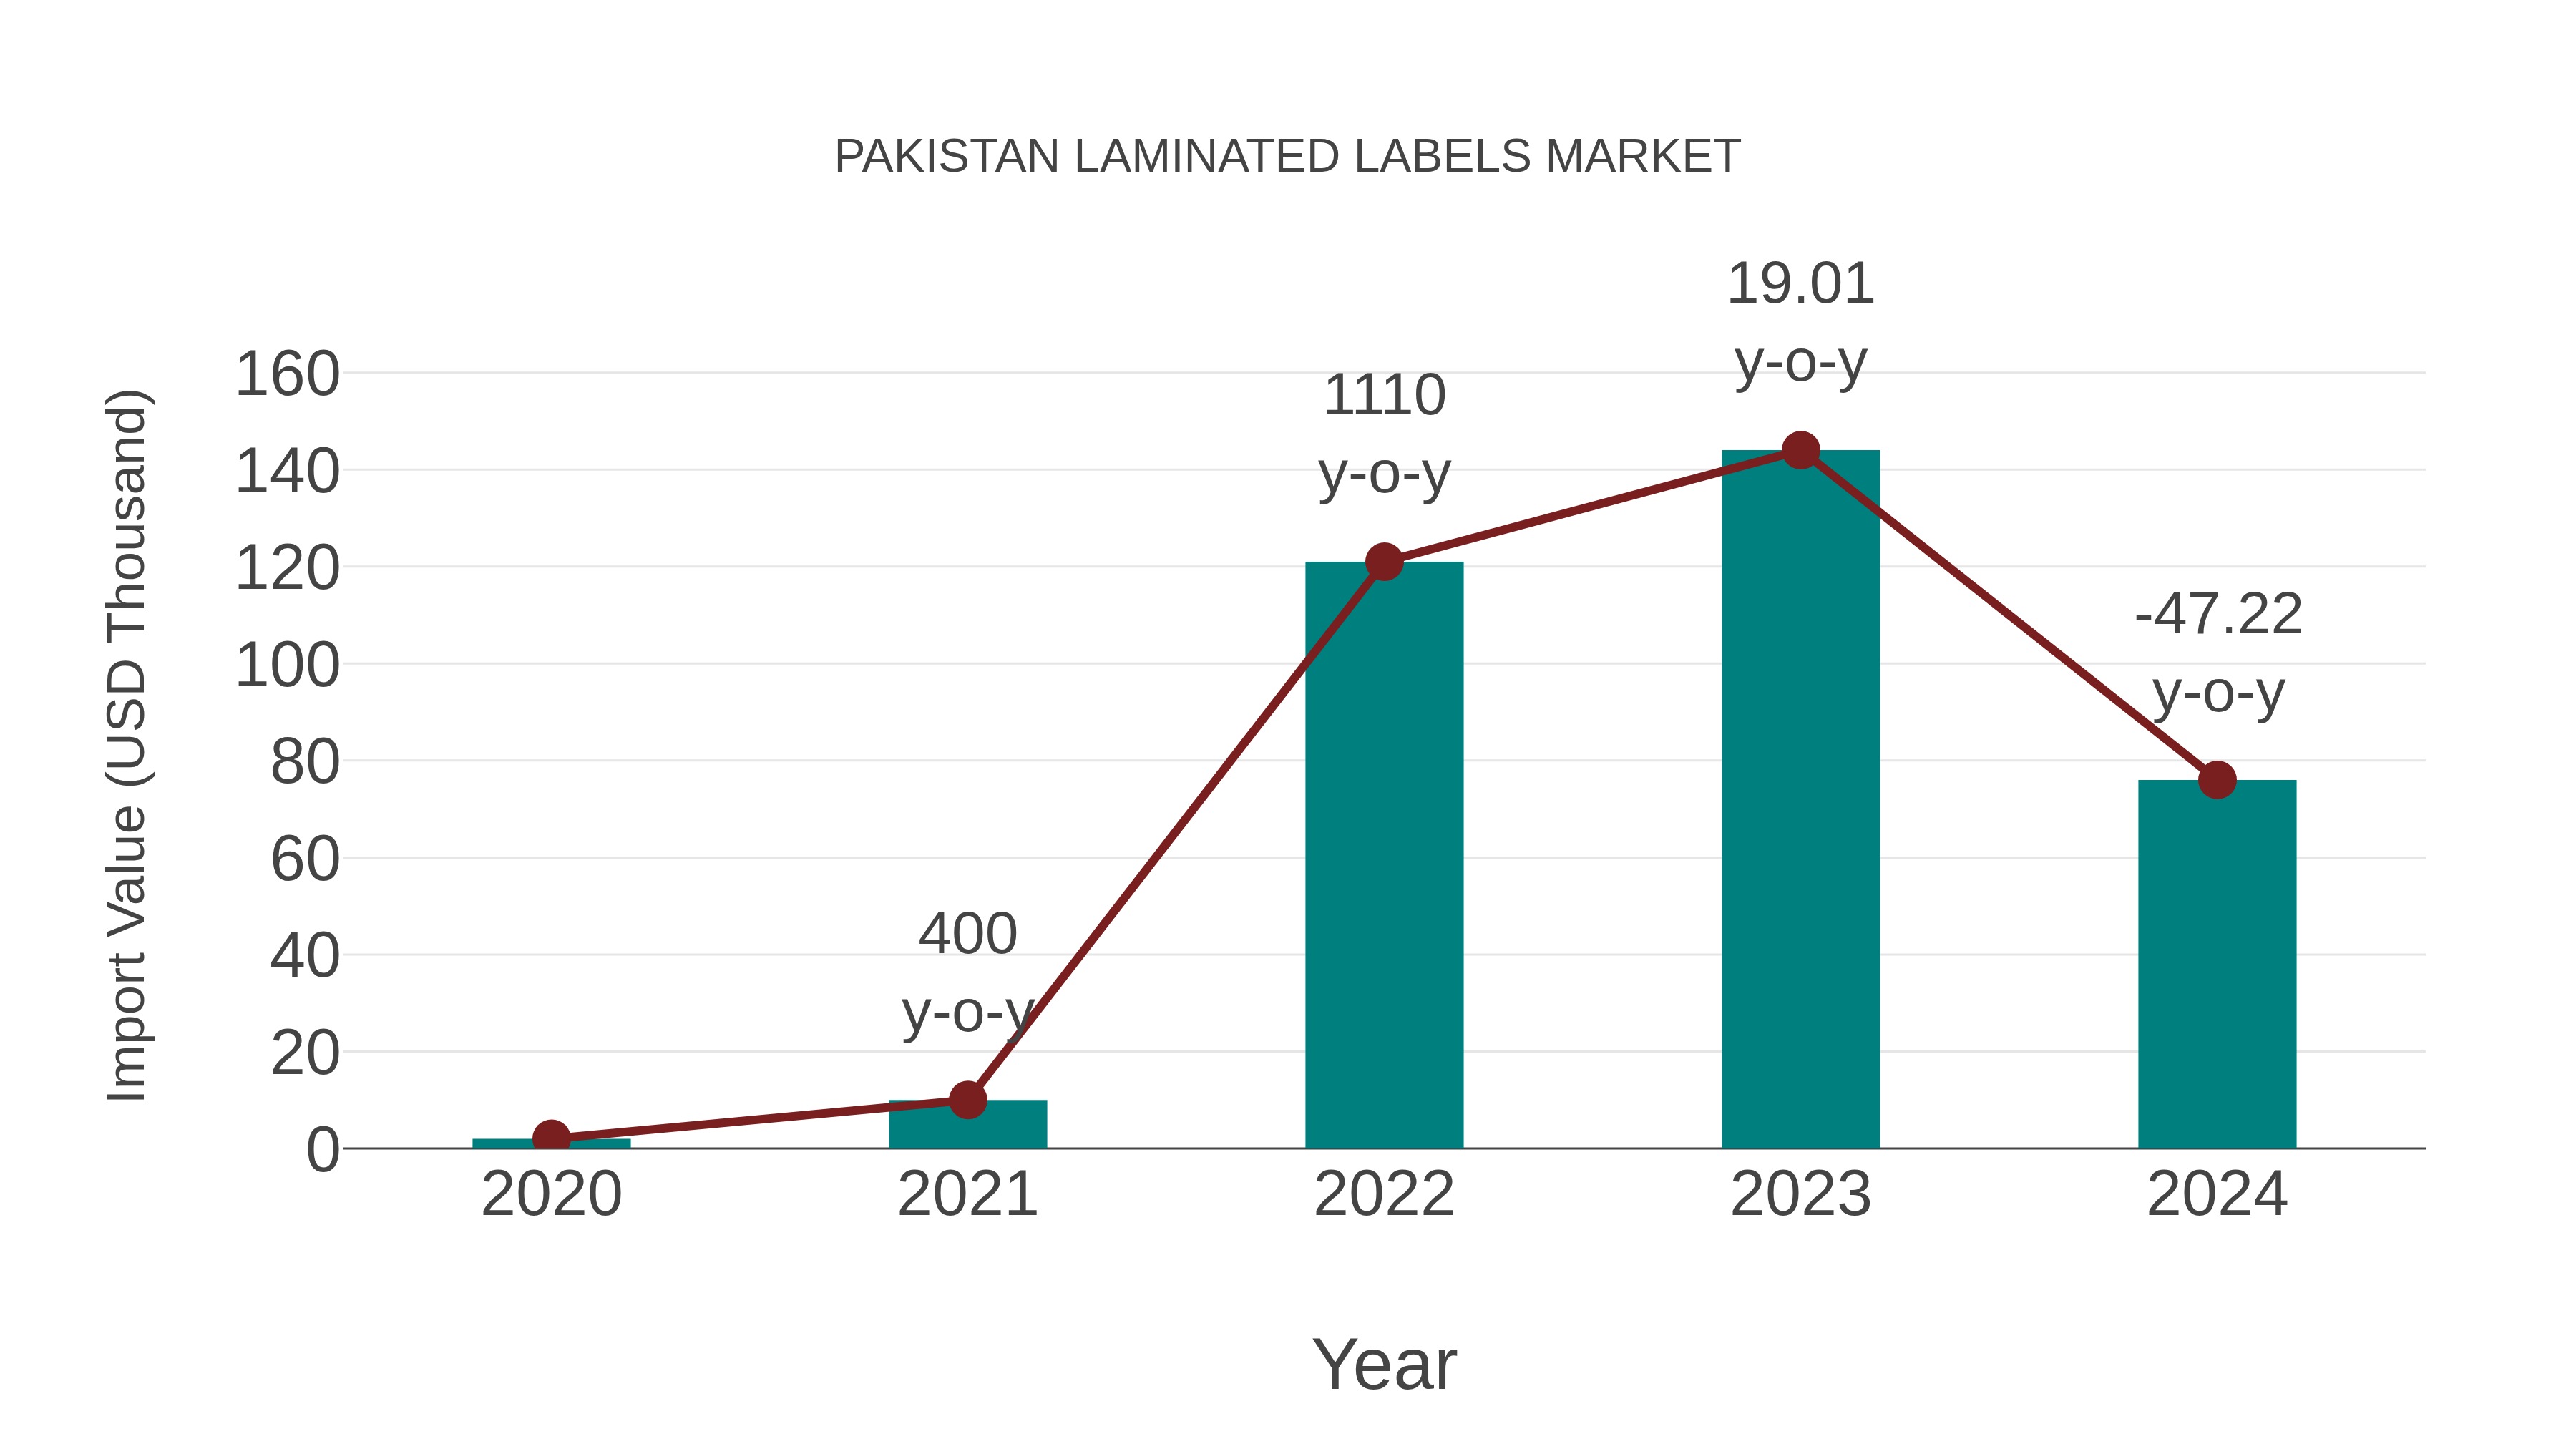
Pakistan Laminated Labels Market: Import Trend Analysis
Pakistan import trend for laminated labels saw a notable decline from 2023 to 2024, with a growth rate of -47.22%. However, the compound annual growth rate (CAGR) for 2020-2024 stood at a high 148.28%. This significant fluctuation could be attributed to shifts in demand patterns or changes in trade policies impacting the market dynamics.
Pakistan Laminated Labels Market Overview
The laminated labels market in Pakistan is expanding as businesses seek durable and high-quality labeling solutions. Laminated labels are resistant to moisture, chemicals, and abrasion, making them suitable for various packaging and branding applications.
Drivers of the market
The laminated labels market in Pakistan is driven by the demand for durable and visually appealing labeling solutions across various industries, including food and beverage, pharmaceuticals, and consumer goods. Laminated labels offer benefits such as resistance to moisture, chemicals, and abrasion. The emphasis on product branding, regulatory compliance, and packaging innovation are key drivers.
Challenges of the market
The laminated labels market in Pakistan encounters high production and processing costs. Limited awareness among industries about the benefits and applications of laminated labels restricts market growth. The reliance on imported raw materials makes the market vulnerable to supply chain disruptions and price fluctuations. Ensuring product durability, quality, and meeting regulatory standards are significant challenges.
Government Policy of the market
The Pakistan Laminated Labels Market exhibits growth driven by the packaging industry`s demand for durable and visually appealing labeling solutions. Government initiatives promoting product quality and consumer safety contribute significantly to market dynamics. Laminated labels, featuring multiple layers for protection and aesthetics, offer resistance to moisture, abrasion, and chemicals, ensuring product integrity and brand visibility. Market demand centers on customized label designs for food, beverage, pharmaceutical, and personal care products, driving innovation and investment in label printing technologies.
Key Highlights of the Report:
- Pakistan Laminated Labels Market Outlook
- Market Size of Pakistan Laminated Labels Market, 2025
- Forecast of Pakistan Laminated Labels Market, 2032
- Historical Data and Forecast of Pakistan Laminated Labels Revenues & Volume for the Period 2022-2032F
- Pakistan Laminated Labels Market Trend Evolution
- Pakistan Laminated Labels Market Drivers and Challenges
- Pakistan Laminated Labels Price Trends
- Pakistan Laminated Labels Porter's Five Forces
- Pakistan Laminated Labels Industry Life Cycle
- Historical Data and Forecast of Pakistan Laminated Labels Market Revenues & Volume By Composition for the Period 2022-2032F
- Historical Data and Forecast of Pakistan Laminated Labels Market Revenues & Volume By Facestock for the Period 2022-2032F
- Historical Data and Forecast of Pakistan Laminated Labels Market Revenues & Volume By adhesive for the Period 2022-2032F
- Historical Data and Forecast of Pakistan Laminated Labels Market Revenues & Volume By release liner for the Period 2022-2032F
- Historical Data and Forecast of Pakistan Laminated Labels Market Revenues & Volume By Printing ink for the Period 2022-2032F
- Historical Data and Forecast of Pakistan Laminated Labels Market Revenues & Volume By water-based for the Period 2022-2032F
- Historical Data and Forecast of Pakistan Laminated Labels Market Revenues & Volume By solvent-based for the Period 2022-2032F
- Historical Data and Forecast of Pakistan Laminated Labels Market Revenues & Volume By holt melt-based for the Period 2022-2032F
- Historical Data and Forecast of Pakistan Laminated Labels Market Revenues & Volume By UV curable for the Period 2022-2032F
- Historical Data and Forecast of Pakistan Laminated Labels Market Revenues & Volume By Printing technology for the Period 2022-2032F
- Historical Data and Forecast of Pakistan Laminated Labels Market Revenues & Volume By Digital for the Period 2022-2032F
- Historical Data and Forecast of Pakistan Laminated Labels Market Revenues & Volume By Flexographic for the Period 2022-2032F
- Historical Data and Forecast of Pakistan Laminated Labels Market Revenues & Volume By Lithography for the Period 2022-2032F
- Pakistan Laminated Labels Import Export Trade Statistics
- Market Opportunity Assessment By Composition
- Market Opportunity Assessment By Printing ink
- Market Opportunity Assessment By Printing technology
- Pakistan Laminated Labels Top Companies Market Share
- Pakistan Laminated Labels Competitive Benchmarking By Technical and Operational Parameters
- Pakistan Laminated Labels Company Profiles
- Pakistan Laminated Labels Key Strategic Recommendations
Pakistan Laminated Labels Market (2026-2032): FAQs
Companies like Avery Dennison and UPM Raflatac have been expanding their presence in Pakistan, indicating potential growth opportunities for businesses looking to invest in the laminated labels market in the country.
The growth of the Pakistan laminated labels market is primarily driven by increasing demand from sectors such as food and beverage, pharmaceuticals, and consumer goods. Companies like Packages Limited and HBL Labels & Packaging are actively expanding their product offerings and investing in advanced printing technologies to meet the growing demand for high-quality labels in the market. Additionally, the adoption of innovative labeling solutions such as RFID-enabled labels is further fueling market growth by enhancing supply chain efficiency and product traceability.
The future outlook for the Pakistan laminated labels market is optimistic, driven by the increasing demand for high-quality packaging solutions in industries such as food and beverage, pharmaceuticals, and cosmetics. Companies like Packages Limited and Novatex Limited are investing in advanced printing technologies to offer innovative laminated label solutions that enhance product appeal and durability. As the e-commerce sector continues to grow in Pakistan, there is a rising need for secure and attractive labels to distinguish products and ensure brand recognition, indicating a positive long-term direction for the market.
The Pakistan laminated labels market is primarily driven by the increasing demand for durable and visually appealing packaging solutions in industries such as food and beverage, pharmaceuticals, and cosmetics. Companies like Packages Limited and Interloop Limited are investing in advanced printing technologies to enhance label quality and brand visibility. However, challenges such as rising raw material costs and stringent regulations on labeling content pose hurdles to market growth. The dynamics of this market are also influenced by shifting consumer preferences towards eco-friendly and sustainable labeling solutions, prompting companies like Packages Limited to explore biodegradable label options.
Consumer trends in the Pakistan laminated labels market are leaning towards sustainable packaging solutions, driving companies like EcoFlex Packaging to offer eco-friendly label options that cater to environmentally conscious consumers. In terms of technology, the market is witnessing a shift towards digital printing methods, with companies like Descon Engineering Limited investing in advanced digital label printing equipment to meet the increasing demand for customization and shorter print runs. From a policy perspective, the Pakistan government's emphasis on promoting local manufacturing under the 'Made in Pakistan' initiative is influencing companies like Packages Limited to expand their production capabilities for laminated labels domestically.
6Wresearch actively monitors the Pakistan Laminated Labels Market and publishes its comprehensive annual report, highlighting emerging trends, growth drivers, revenue analysis, and forecast outlook. Our insights help businesses to make data-backed strategic decisions with ongoing market dynamics. Our analysts track relevent industries related to the Pakistan Laminated Labels Market, allowing our clients with actionable intelligence and reliable forecasts tailored to emerging regional needs.
Yes, we provide customisation as per your requirements. To learn more, feel free to contact us on sales@6wresearch.com
1 Executive Summary |
2 Introduction |
2.1 Key Highlights of the Report |
2.2 Report Description |
2.3 Market Scope & Segmentation |
2.4 Research Methodology |
2.5 Assumptions |
3 Pakistan Laminated Labels Market Overview |
3.1 Pakistan Country Macro Economic Indicators |
3.2 Pakistan Laminated Labels Market Revenues & Volume, 2022 & 2032F |
3.3 Pakistan Laminated Labels Market - Industry Life Cycle |
3.4 Pakistan Laminated Labels Market - Porter's Five Forces |
3.5 Pakistan Laminated Labels Market Revenues & Volume Share, By Composition, 2022 & 2032F |
3.6 Pakistan Laminated Labels Market Revenues & Volume Share, By Printing ink, 2022 & 2032F |
3.7 Pakistan Laminated Labels Market Revenues & Volume Share, By Printing technology, 2022 & 2032F |
4 Pakistan Laminated Labels Market Dynamics |
4.1 Impact Analysis |
4.2 Market Drivers |
4.2.1 Increasing demand for packaged goods in Pakistan |
4.2.2 Growing awareness about product labeling and branding |
4.2.3 Government regulations mandating the use of labels on consumer products |
4.3 Market Restraints |
4.3.1 High production costs associated with laminated labels |
4.3.2 Intense competition from alternative labeling solutions |
4.3.3 Economic fluctuations impacting consumer spending on packaged goods |
5 Pakistan Laminated Labels Market Trends |
6 Pakistan Laminated Labels Market, By Types |
6.1 Pakistan Laminated Labels Market, By Composition |
6.1.1 Overview and Analysis |
6.1.2 Pakistan Laminated Labels Market Revenues & Volume, By Composition, 2022-2032F |
6.1.3 Pakistan Laminated Labels Market Revenues & Volume, By Facestock, 2022-2032F |
6.1.4 Pakistan Laminated Labels Market Revenues & Volume, By adhesive, 2022-2032F |
6.1.5 Pakistan Laminated Labels Market Revenues & Volume, By release liner, 2022-2032F |
6.2 Pakistan Laminated Labels Market, By Printing ink |
6.2.1 Overview and Analysis |
6.2.2 Pakistan Laminated Labels Market Revenues & Volume, By water-based, 2022-2032F |
6.2.3 Pakistan Laminated Labels Market Revenues & Volume, By solvent-based, 2022-2032F |
6.2.4 Pakistan Laminated Labels Market Revenues & Volume, By holt melt-based, 2022-2032F |
6.2.5 Pakistan Laminated Labels Market Revenues & Volume, By UV curable, 2022-2032F |
6.3 Pakistan Laminated Labels Market, By Printing technology |
6.3.1 Overview and Analysis |
6.3.2 Pakistan Laminated Labels Market Revenues & Volume, By Digital, 2022-2032F |
6.3.3 Pakistan Laminated Labels Market Revenues & Volume, By Flexographic, 2022-2032F |
6.3.4 Pakistan Laminated Labels Market Revenues & Volume, By Lithography, 2022-2032F |
7 Pakistan Laminated Labels Market Import-Export Trade Statistics |
7.1 Pakistan Laminated Labels Market Export to Major Countries |
7.2 Pakistan Laminated Labels Market Imports from Major Countries |
8 Pakistan Laminated Labels Market Key Performance Indicators |
8.1 Percentage increase in the adoption of laminated labels by industries |
8.2 Growth rate of the packaging industry in Pakistan |
8.3 Percentage of companies complying with labeling regulations in the country |
9 Pakistan Laminated Labels Market - Opportunity Assessment |
9.1 Pakistan Laminated Labels Market Opportunity Assessment, By Composition, 2022 & 2032F |
9.2 Pakistan Laminated Labels Market Opportunity Assessment, By Printing ink, 2022 & 2032F |
9.3 Pakistan Laminated Labels Market Opportunity Assessment, By Printing technology, 2022 & 2032F |
10 Pakistan Laminated Labels Market - Competitive Landscape |
10.1 Pakistan Laminated Labels Market Revenue Share, By Companies, 2025 |
10.2 Pakistan Laminated Labels Market Competitive Benchmarking, By Operating and Technical Parameters |
11 Company Profiles |
12 Recommendations |
13 Disclaimer |
Export potential assessment - trade Analytics for 2030
Export potential enables firms to identify high-growth global markets with greater confidence by combining advanced trade intelligence with a structured quantitative methodology. The framework analyzes emerging demand trends and country-level import patterns while integrating macroeconomic and trade datasets such as GDP and population forecasts, bilateral import–export flows, tariff structures, elasticity differentials between developed and developing economies, geographic distance, and import demand projections. Using weighted trade values from 2020–2024 as the base period to project country-to-country export potential for 2030, these inputs are operationalized through calculated drivers such as gravity model parameters, tariff impact factors, and projected GDP per-capita growth. Through an analysis of hidden potentials, demand hotspots, and market conditions that are most favorable to success, this method enables firms to focus on target countries, maximize returns, and global expansion with data, backed by accuracy.
By factoring in the projected importer demand gap that is currently unmet and could be potential opportunity, it identifies the potential for the Exporter (Country) among 190 countries, against the general trade analysis, which identifies the biggest importer or exporter.
To discover high-growth global markets and optimize your business strategy:
Click Here
Pricing
- Single User License$ 1,995
- Department License$ 2,400
- Site License$ 3,120
- Global License$ 3,795

Search
Thought Leadership and Analyst Meet


Our Clients
Latest Reports
- Philippines Polyhydroxybutyrate-co-Hydroxyvalerate Market (2026-2032) | Trends, Insights, Challenges, Restraints, Competition, Size, Value, Forecast, Pricing, Share, Outlook, Revenue, Investment Opportunities, Strategy, Drivers, Demand, Growth, segmentation, Analysis, Companies
- Peru Polyhydroxybutyrate-co-Hydroxyvalerate Market (2026-2032) | Growth, Demand, Challenges, Share, Trends, Analysis, Pricing, Investment Opportunities, Drivers, Value, Forecast, Competition, Size, Companies, Insights, Outlook, Restraints, segmentation, Revenue, Strategy
- Pakistan Polyhydroxybutyrate-co-Hydroxyvalerate Market (2026-2032) | Restraints, segmentation, Pricing, Forecast, Share, Strategy, Competition, Trends, Insights, Drivers, Challenges, Growth, Revenue, Outlook, Value, Investment Opportunities, Companies, Size, Analysis, Demand
- Oman Polyhydroxybutyrate-co-Hydroxyvalerate Market (2026-2032) | Drivers, segmentation, Insights, Competition, Pricing, Outlook, Size, Revenue, Challenges, Forecast, Analysis, Growth, Value, Share, Trends, Investment Opportunities, Strategy, Restraints, Companies, Demand
- Nigeria Polyhydroxybutyrate-co-Hydroxyvalerate Market (2026-2032) | Value, Investment Opportunities, Analysis, Revenue, Restraints, Pricing, Outlook, Competition, Demand, Growth, Forecast, Companies, Trends, Challenges, segmentation, Drivers, Insights, Share, Size, Strategy
- Nepal Polyhydroxybutyrate-co-Hydroxyvalerate Market (2026-2032) | Insights, Analysis, Drivers, Share, Revenue, Demand, segmentation, Investment Opportunities, Competition, Forecast, Growth, Pricing, Companies, Strategy, Trends, Restraints, Challenges, Outlook, Size, Value
- Myanmar Polyhydroxybutyrate-co-Hydroxyvalerate Market (2026-2032) | Outlook, Revenue, Strategy, Restraints, Drivers, segmentation, Share, Forecast, Competition, Insights, Growth, Pricing, Size, Demand, Value, Companies, Trends, Challenges, Investment Opportunities, Analysis
- Morocco Polyhydroxybutyrate-co-Hydroxyvalerate Market (2026-2032) | Outlook, Investment Opportunities, Restraints, Strategy, Forecast, Challenges, Drivers, Growth, Companies, segmentation, Trends, Size, Competition, Revenue, Demand, Insights, Share, Analysis, Value, Pricing
- Mexico Polyhydroxybutyrate-co-Hydroxyvalerate Market (2026-2032) | Size, Drivers, Outlook, Share, Strategy, Growth, Pricing, Challenges, Companies, Demand, Value, Investment Opportunities, Restraints, Trends, Forecast, segmentation, Analysis, Insights, Competition, Revenue
- Malaysia Polyhydroxybutyrate-co-Hydroxyvalerate Market (2026-2032) | Share, segmentation, Size, Companies, Analysis, Insights, Forecast, Value, Revenue, Drivers, Restraints, Challenges, Investment Opportunities, Trends, Competition, Strategy, Demand, Growth, Outlook, Pricing
Industry Events and Analyst Meet

HIMTEX 2026

India Refining Summit 2026

India EV Show 2026

EV tech India Expo 2026

Auto Tech Asia 2026
Whitepaper
- Middle East & Africa Commercial Security Market Click here to view more.
- Middle East & Africa Fire Safety Systems & Equipment Market Click here to view more.
- GCC Drone Market Click here to view more.
- Middle East Lighting Fixture Market Click here to view more.
- GCC Physical & Perimeter Security Market Click here to view more.
6WResearch In News
- Doha a strategic location for EV manufacturing hub: IPA Qatar
- Demand for luxury TVs surging in the GCC, says Samsung
- Empowering Growth: The Thriving Journey of Bangladesh’s Cable Industry
- Demand for luxury TVs surging in the GCC, says Samsung
- Video call with a traditional healer? Once unthinkable, it’s now common in South Africa
- Intelligent Buildings To Smooth GCC’s Path To Net Zero