Pakistan Polyurethane (PU) Microspheres Market (2026-2032) Outlook | Forecast, Revenue, Growth, Trends, Analysis, Industry, Size, Companies, Share & Value
Market Forecast By Applications (Encapsulation, Paints & coatings, Adhesives films, Cosmetics, Other applications) And Competitive Landscape
| Product Code: ETC4512218 | Publication Date: Jul 2023 | Updated Date: Mar 2026 | Product Type: Report | |
| Publisher: 6Wresearch | Author: Dhaval Chaurasia | No. of Pages: 85 | No. of Figures: 45 | No. of Tables: 25 |
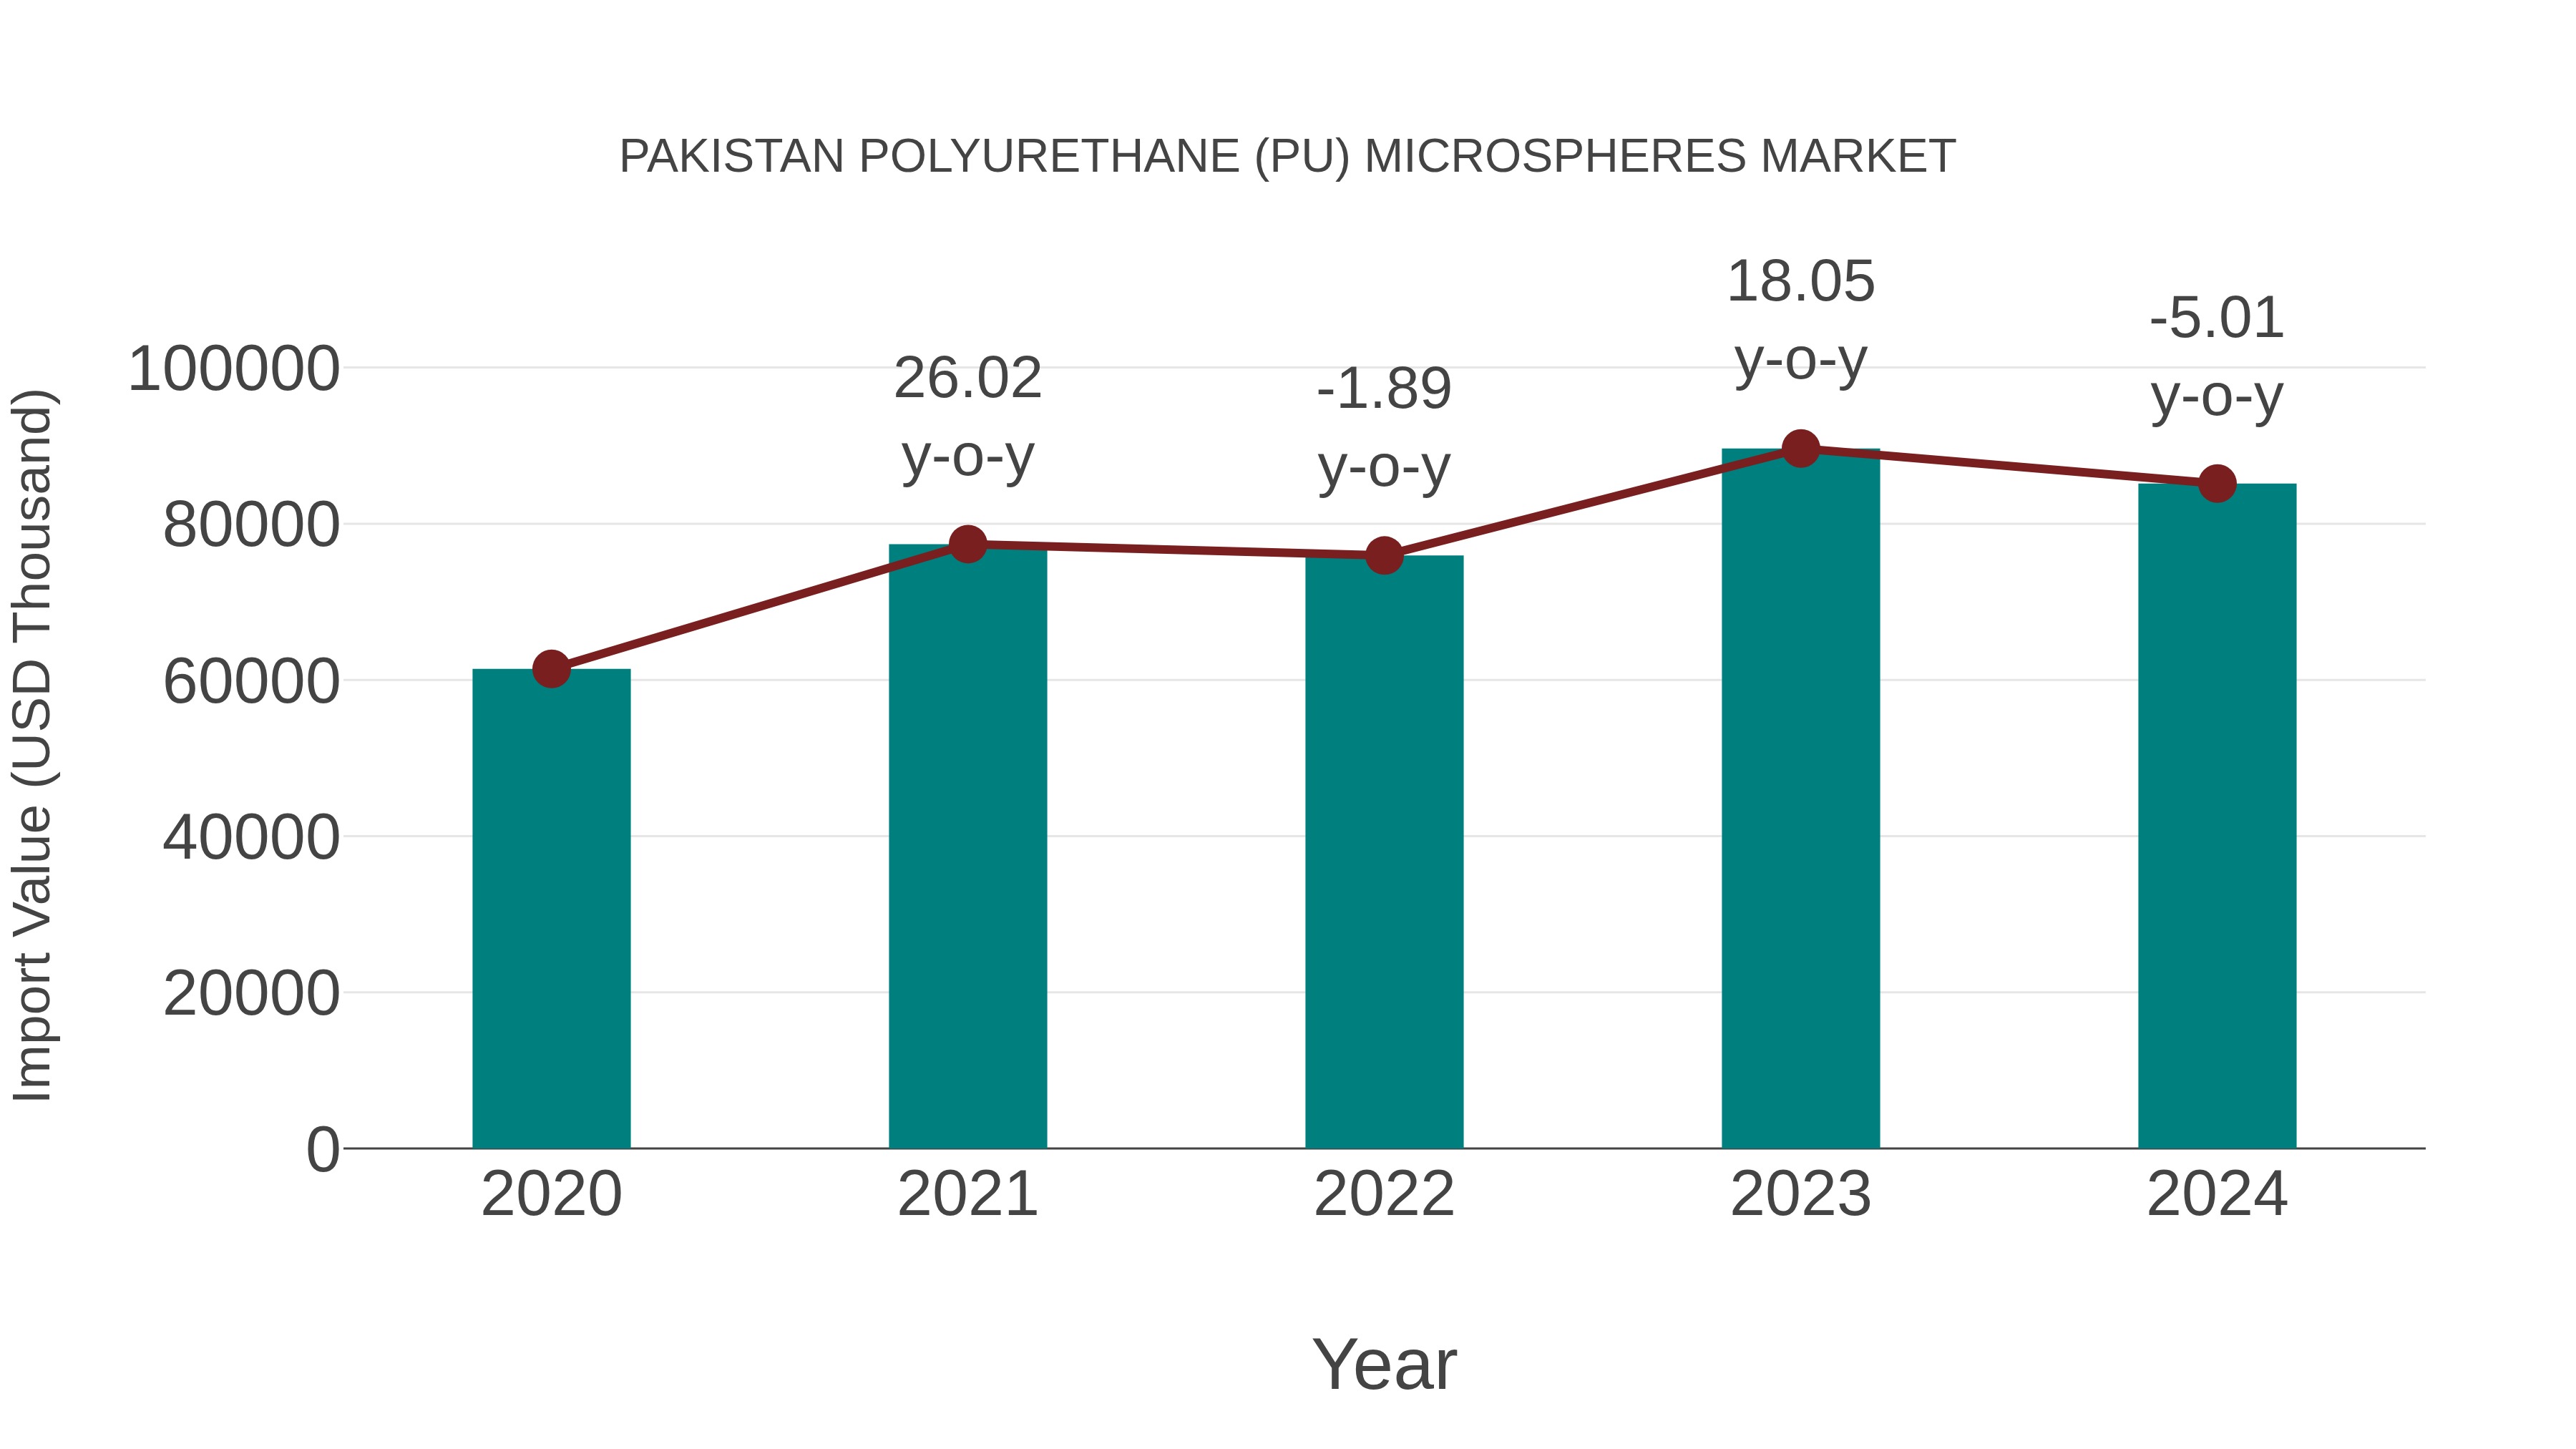
Pakistan Polyurethane (Pu) Microspheres Market: Import Trend Analysis
Pakistan import trend for polyurethane (PU) microspheres showed a decline with a growth rate of -5.01% from 2023 to 2024, while the compound annual growth rate (CAGR) for 2020-2024 stood at 8.51%. This decline could be attributed to shifts in market demand or changes in trade policies affecting imports.
Pakistan Polyurethane (PU) Microspheres Market Overview
The Polyurethane Microspheres Market in Pakistan is growing with the demand for advanced materials in coatings, adhesives, and medical applications. PU microspheres offer controlled release properties, lightweight filler options, and enhanced performance in various formulations, making them valuable in diverse industries.
Drivers of the market
The Pakistan polyurethane microspheres market is witnessing growth due to the increasing demand from industries such as paints and coatings, cosmetics, adhesives, and biomedical applications. Polyurethane microspheres offer properties such as lightweight, high strength, low density, and controlled particle size distribution, making them suitable for use as additives in various formulations. The expanding construction and automotive sectors in Pakistan, coupled with the growing emphasis on sustainable and eco-friendly materials, are driving the demand for polyurethane microspheres in the country. Moreover, technological advancements in microsphere production and the development of novel applications are further fueling market growth.
Challenges of the market
The polyurethane (PU) microspheres market in Pakistan is constrained by the high cost of raw materials and production. The market is heavily reliant on imports, making it vulnerable to global price fluctuations. Additionally, there is limited local expertise and infrastructure for the production and development of high-quality PU microspheres. The market also faces competition from alternative materials and imported products, which can often be cheaper.
Government Policy of the market
In Pakistan, the government has introduced policies to promote the development of the polyurethane microspheres market, considering its applications in coatings, adhesives, and cosmetics. These policies include financial incentives for research and development, technology commercialization support, and export promotion initiatives to enhance the competitiveness of the local polyurethane microspheres industry. Additionally, the government has enacted regulations to ensure product quality, safety standards, and environmental sustainability in the production and usage of polyurethane microspheres.
Key Highlights of the Report:
- Pakistan Polyurethane (PU) Microspheres Market Outlook
- Market Size of Pakistan Polyurethane (PU) Microspheres Market, 2025
- Forecast of Pakistan Polyurethane (PU) Microspheres Market, 2032
- Historical Data and Forecast of Pakistan Polyurethane (PU) Microspheres Revenues & Volume for the Period 2022-2032F
- Pakistan Polyurethane (PU) Microspheres Market Trend Evolution
- Pakistan Polyurethane (PU) Microspheres Market Drivers and Challenges
- Pakistan Polyurethane (PU) Microspheres Price Trends
- Pakistan Polyurethane (PU) Microspheres Porter's Five Forces
- Pakistan Polyurethane (PU) Microspheres Industry Life Cycle
- Historical Data and Forecast of Pakistan Polyurethane (PU) Microspheres Market Revenues & Volume By Applications for the Period 2022-2032F
- Historical Data and Forecast of Pakistan Polyurethane (PU) Microspheres Market Revenues & Volume By Encapsulation for the Period 2022-2032F
- Historical Data and Forecast of Pakistan Polyurethane (PU) Microspheres Market Revenues & Volume By Paints & coatings for the Period 2022-2032F
- Historical Data and Forecast of Pakistan Polyurethane (PU) Microspheres Market Revenues & Volume By Adhesives films for the Period 2022-2032F
- Historical Data and Forecast of Pakistan Polyurethane (PU) Microspheres Market Revenues & Volume By Cosmetics for the Period 2022-2032F
- Historical Data and Forecast of Pakistan Polyurethane (PU) Microspheres Market Revenues & Volume By Other applications for the Period 2022-2032F
- Pakistan Polyurethane (PU) Microspheres Import Export Trade Statistics
- Market Opportunity Assessment By Applications
- Pakistan Polyurethane (PU) Microspheres Top Companies Market Share
- Pakistan Polyurethane (PU) Microspheres Competitive Benchmarking By Technical and Operational Parameters
- Pakistan Polyurethane (PU) Microspheres Company Profiles
- Pakistan Polyurethane (PU) Microspheres Key Strategic Recommendations
Pakistan Polyurethane (PU) Microspheres Market (2026-2032): FAQs
6Wresearch actively monitors the Pakistan Polyurethane (PU) Microspheres Market and publishes its comprehensive annual report, highlighting emerging trends, growth drivers, revenue analysis, and forecast outlook. Our insights help businesses to make data-backed strategic decisions with ongoing market dynamics. Our analysts track relevent industries related to the Pakistan Polyurethane (PU) Microspheres Market, allowing our clients with actionable intelligence and reliable forecasts tailored to emerging regional needs.
Yes, we provide customisation as per your requirements. To learn more, feel free to contact us on sales@6wresearch.com
1 Executive Summary |
2 Introduction |
2.1 Key Highlights of the Report |
2.2 Report Description |
2.3 Market Scope & Segmentation |
2.4 Research Methodology |
2.5 Assumptions |
3 Pakistan Polyurethane (PU) Microspheres Market Overview |
3.1 Pakistan Country Macro Economic Indicators |
3.2 Pakistan Polyurethane (PU) Microspheres Market Revenues & Volume, 2022 & 2032F |
3.3 Pakistan Polyurethane (PU) Microspheres Market - Industry Life Cycle |
3.4 Pakistan Polyurethane (PU) Microspheres Market - Porter's Five Forces |
3.5 Pakistan Polyurethane (PU) Microspheres Market Revenues & Volume Share, By Applications, 2022 & 2032F |
4 Pakistan Polyurethane (PU) Microspheres Market Dynamics |
4.1 Impact Analysis |
4.2 Market Drivers |
4.2.1 Increasing demand for lightweight materials in various industries such as automotive, construction, and packaging |
4.2.2 Growing awareness regarding the benefits of polyurethane microspheres in reducing overall product weight and enhancing performance |
4.2.3 Rising investments in research and development for innovative applications of polyurethane microspheres |
4.3 Market Restraints |
4.3.1 Fluctuating prices of raw materials used in the production of polyurethane microspheres |
4.3.2 Stringent regulations related to environmental concerns and safety standards impacting production and usage |
4.3.3 Competition from alternative materials affecting market penetration and adoption rates |
5 Pakistan Polyurethane (PU) Microspheres Market Trends |
6 Pakistan Polyurethane (PU) Microspheres Market, By Types |
6.1 Pakistan Polyurethane (PU) Microspheres Market, By Applications |
6.1.1 Overview and Analysis |
6.1.2 Pakistan Polyurethane (PU) Microspheres Market Revenues & Volume, By Applications, 2022-2032F |
6.1.3 Pakistan Polyurethane (PU) Microspheres Market Revenues & Volume, By Encapsulation, 2022-2032F |
6.1.4 Pakistan Polyurethane (PU) Microspheres Market Revenues & Volume, By Paints & coatings, 2022-2032F |
6.1.5 Pakistan Polyurethane (PU) Microspheres Market Revenues & Volume, By Adhesives films, 2022-2032F |
6.1.6 Pakistan Polyurethane (PU) Microspheres Market Revenues & Volume, By Cosmetics, 2022-2032F |
6.1.7 Pakistan Polyurethane (PU) Microspheres Market Revenues & Volume, By Other applications, 2022-2032F |
7 Pakistan Polyurethane (PU) Microspheres Market Import-Export Trade Statistics |
7.1 Pakistan Polyurethane (PU) Microspheres Market Export to Major Countries |
7.2 Pakistan Polyurethane (PU) Microspheres Market Imports from Major Countries |
8 Pakistan Polyurethane (PU) Microspheres Market Key Performance Indicators |
8.1 Adoption rate of polyurethane microspheres in new industries or applications |
8.2 Rate of new product developments and innovations in polyurethane microspheres |
8.3 Number of patents filed or granted for polyurethane microsphere technologies |
8.4 Percentage increase in research and development expenditure by key market players |
8.5 Customer satisfaction and feedback metrics on the performance of polyurethane microspheres in different applications |
9 Pakistan Polyurethane (PU) Microspheres Market - Opportunity Assessment |
9.1 Pakistan Polyurethane (PU) Microspheres Market Opportunity Assessment, By Applications, 2022 & 2032F |
10 Pakistan Polyurethane (PU) Microspheres Market - Competitive Landscape |
10.1 Pakistan Polyurethane (PU) Microspheres Market Revenue Share, By Companies, 2025 |
10.2 Pakistan Polyurethane (PU) Microspheres Market Competitive Benchmarking, By Operating and Technical Parameters |
11 Company Profiles |
12 Recommendations |
13 Disclaimer |
Global Go To Market Strategy - 2030
Export potential enables firms to identify high-growth global markets with greater confidence by combining advanced trade intelligence with a structured quantitative methodology. The framework analyzes emerging demand trends and country-level import patterns while integrating macroeconomic and trade datasets such as GDP and population forecasts, bilateral import–export flows, tariff structures, elasticity differentials between developed and developing economies, geographic distance, and import demand projections. Using weighted trade values from 2020–2024 as the base period to project country-to-country export potential for 2030, these inputs are operationalized through calculated drivers such as gravity model parameters, tariff impact factors, and projected GDP per-capita growth. Through an analysis of hidden potentials, demand hotspots, and market conditions that are most favorable to success, this method enables firms to focus on target countries, maximize returns, and global expansion with data, backed by accuracy.
By factoring in the projected importer demand gap that is currently unmet and could be potential opportunity, it identifies the potential for the Exporter (Country) among 190 countries, against the general trade analysis, which identifies the biggest importer or exporter.
To discover high-growth global markets and optimize your business strategy:
Click Here
Pricing
- Single User License$ 1,995
- Department License$ 2,400
- Site License$ 3,120
- Global License$ 3,795

Leadership Perspectives from Industry Events
Search
Thought Leadership and Analyst Meet


Our Clients
6WResearch In News
- Doha a strategic location for EV manufacturing hub: IPA Qatar
- Demand for luxury TVs surging in the GCC, says Samsung
- Empowering Growth: The Thriving Journey of Bangladesh’s Cable Industry
- Demand for luxury TVs surging in the GCC, says Samsung
- Video call with a traditional healer? Once unthinkable, it’s now common in South Africa
- Intelligent Buildings To Smooth GCC’s Path To Net Zero
Latest Reports
- Cape Verde Portable Hand-Thrown Extinguisher Market (2026-2032)
- Canada Portable Hand-Thrown Extinguisher Market (2026-2032)
- Cameroon Portable Hand-Thrown Extinguisher Market (2026-2032)
- Burundi Portable Hand-Thrown Extinguisher Market (2026-2032)
- Burkina Faso Portable Hand-Thrown Extinguisher Market (2026-2032)
- Bulgaria Portable Hand-Thrown Extinguisher Market (2026-2032)
- Brunei Portable Hand-Thrown Extinguisher Market (2026-2032)
- Botswana Portable Hand-Thrown Extinguisher Market (2026-2032)
- Bosnia and Herzegovina Portable Hand-Thrown Extinguisher Market (2026-2032)
- Bolivia Portable Hand-Thrown Extinguisher Market (2026-2032)
Industry Events and Analyst Meet

HIMTEX 2026

India Refining Summit 2026

India EV Show 2026

EV tech India Expo 2026

Auto Tech Asia 2026
Whitepaper
- Middle East & Africa Commercial Security Market Click here to view more.
- Middle East & Africa Fire Safety Systems & Equipment Market Click here to view more.
- GCC Drone Market Click here to view more.
- Middle East Lighting Fixture Market Click here to view more.
- GCC Physical & Perimeter Security Market Click here to view more.