Pakistan Ready-to-Drink Tea & Coffee Market (2026-2032) | Pricing Analysis, Companies, Supply, Competition, Competitive, Segmentation, Size, Investment Trends, Analysis, Consumer Insights, Value, Challenges, Demand, Share, Drivers, Growth, Industry, Trends, Segments, Restraints, Strategic Insights, Opportunities, Outlook, Forecast, Strategy, Revenue
Market Forecast By Type (Coffee-Based, Tea-Based, Energy-Boosting, Herbal-Infused, Sugar-Free), By Flavor (Mocha, Green Tea, Black Tea, Chamomile, Unsweetened), By Packaging Type (Bottles, Cans, Tetra Packs, Pouches, Cartons), By Distribution Channel (Supermarkets/Hypermarkets, Online Retail, Convenience Stores, Specialty Stores, Cafs & Restaurants), By End User (Office Workers, Students, Travelers, Health Conscious, Diabetic Consumers) And Competitive Landscape
| Product Code: ETC10273823 | Publication Date: Apr 2025 | Updated Date: Feb 2026 | Product Type: Market Research Report | |
| Publisher: 6Wresearch | No. of Pages: 65 | No. of Figures: 34 | No. of Tables: 19 | |
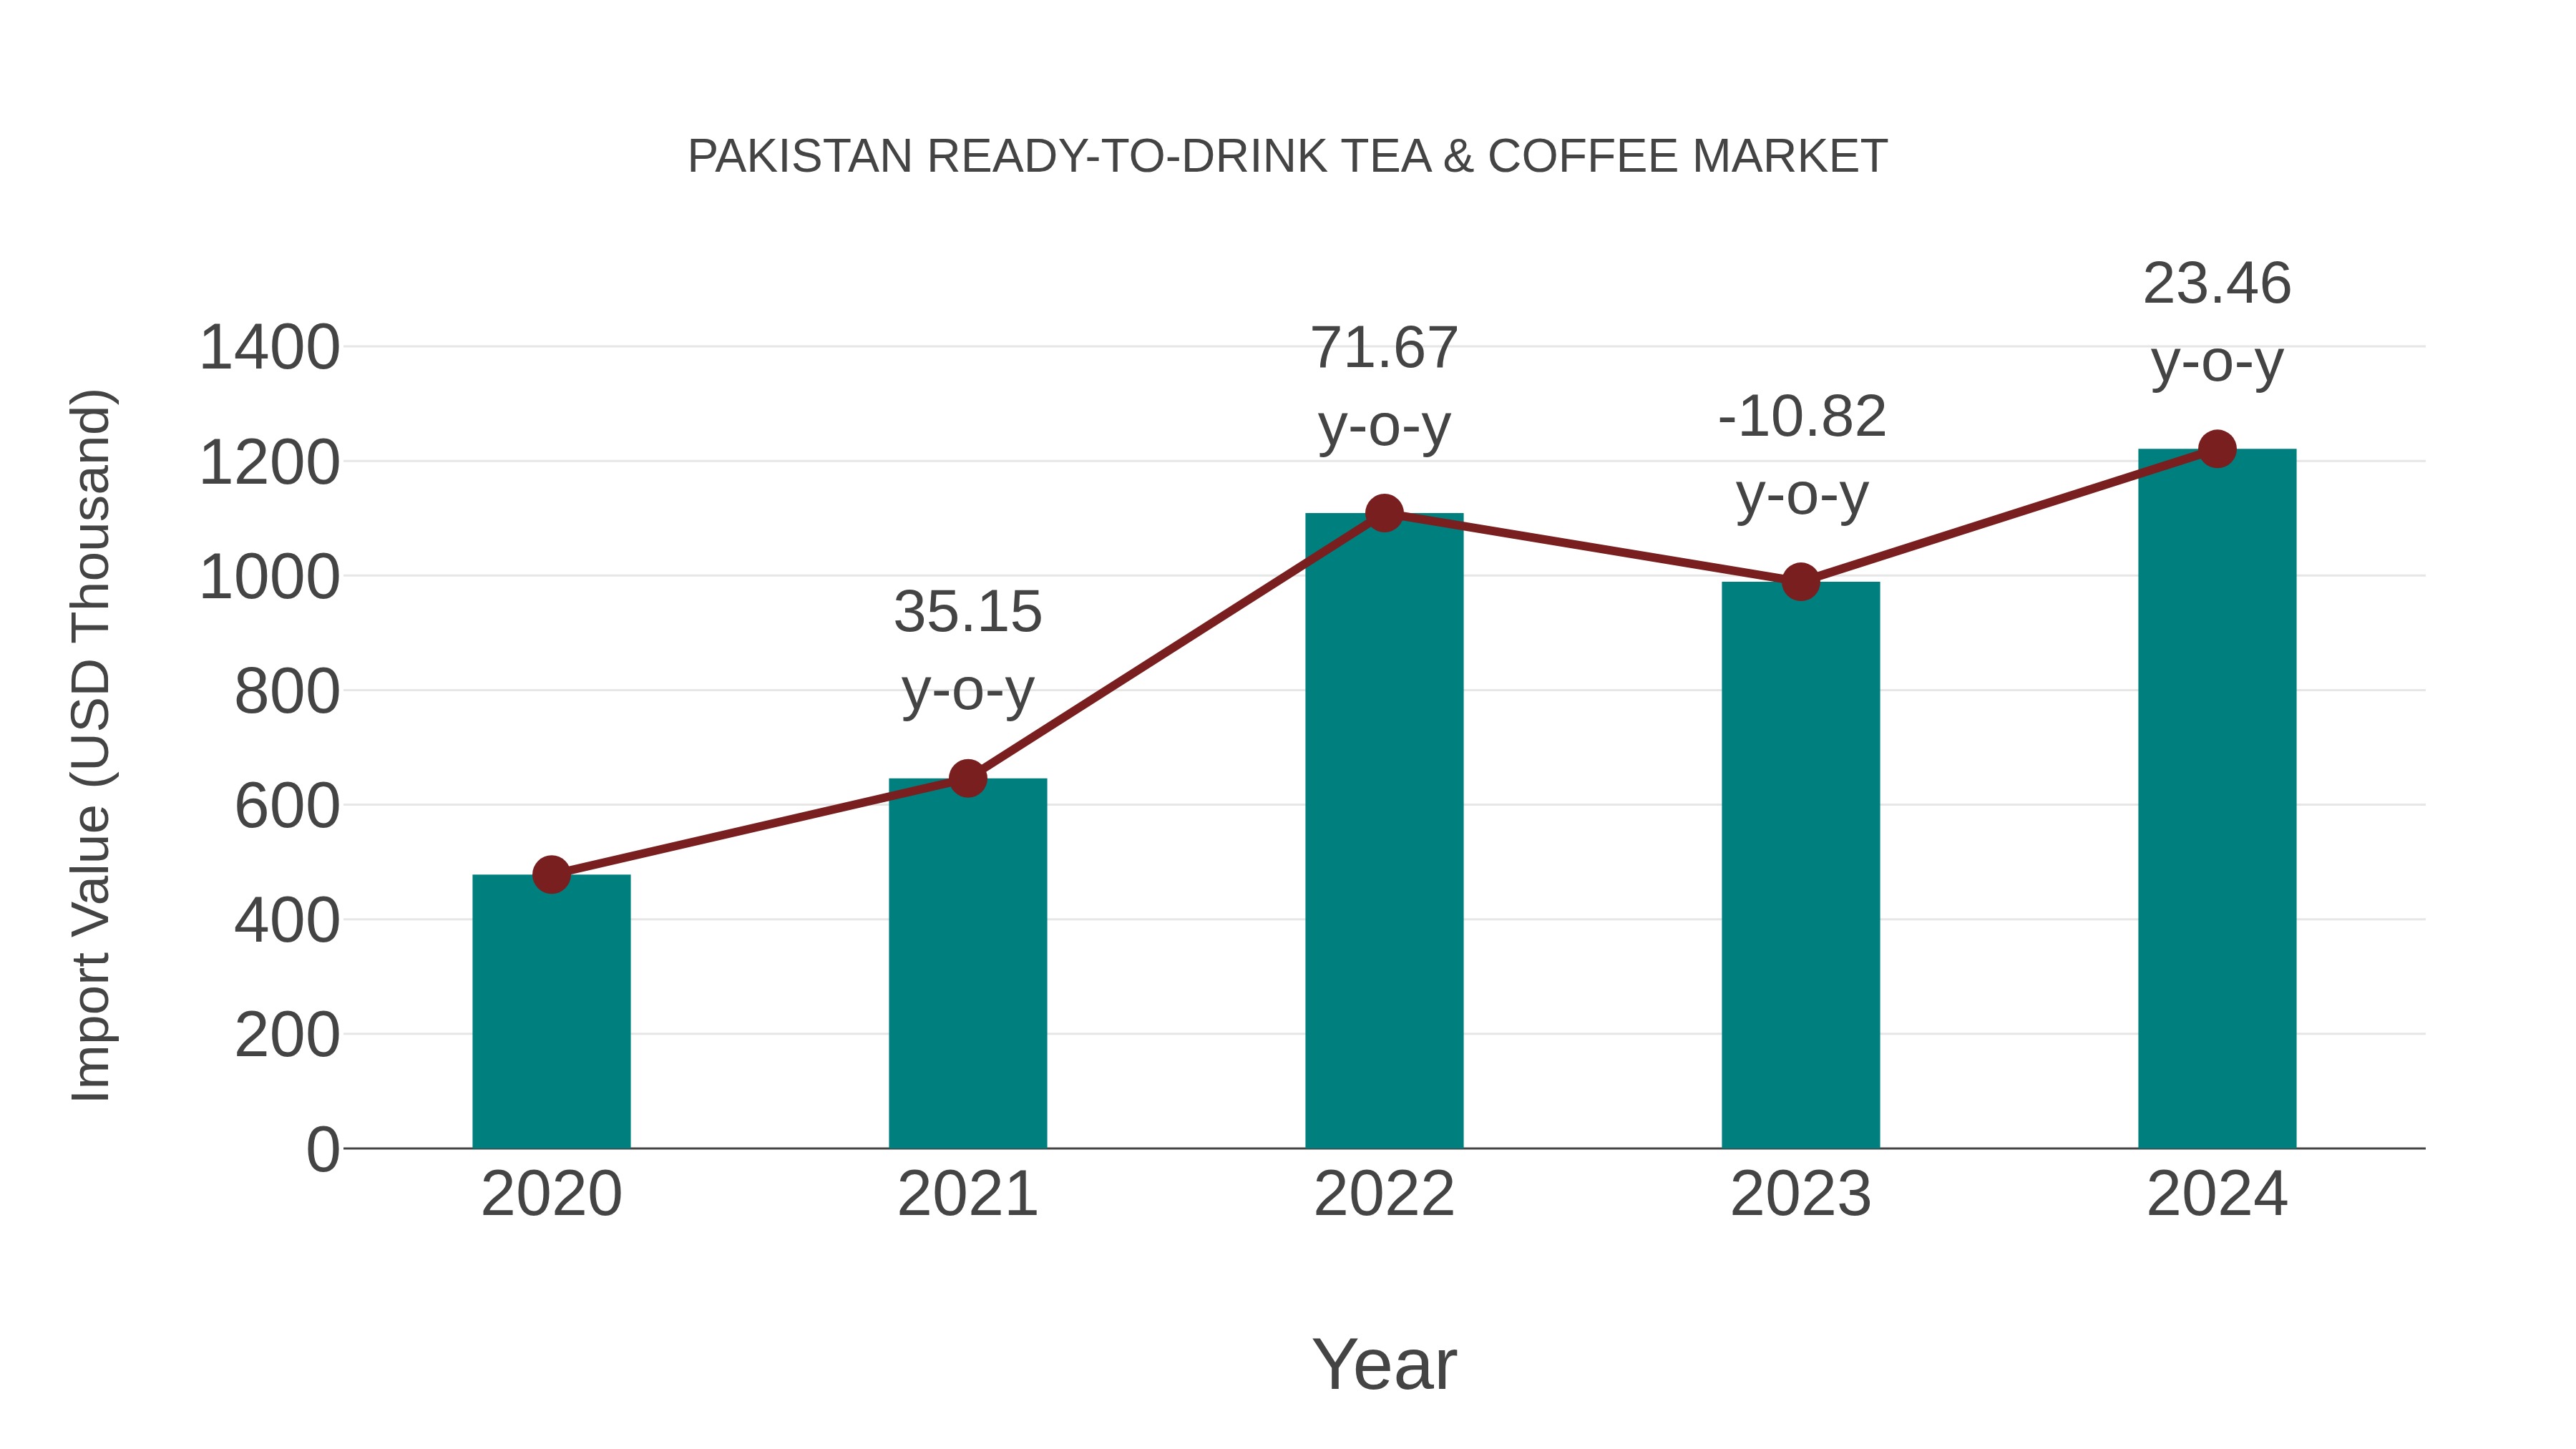
Pakistan Ready-to-drink Tea & Coffee Market: Import Trend Analysis
Pakistan import trend for the ready-to-drink tea & coffee market showed a growth rate of 23.46% from 2023 to 2024, with a compound annual growth rate (CAGR) of 26.42% from 2020 to 2024. This significant increase could be attributed to evolving consumer preferences towards convenient beverage options.
Key Highlights of the Report:
- Pakistan Ready-to-Drink Tea & Coffee Market Outlook
- Market Size of Pakistan Ready-to-Drink Tea & Coffee Market, 2025
- Forecast of Pakistan Ready-to-Drink Tea & Coffee Market, 2032
- Historical Data and Forecast of Pakistan Ready-to-Drink Tea & Coffee Revenues & Volume for the Period 2022-2032F
- Pakistan Ready-to-Drink Tea & Coffee Market Trend Evolution
- Pakistan Ready-to-Drink Tea & Coffee Market Drivers and Challenges
- Pakistan Ready-to-Drink Tea & Coffee Price Trends
- Pakistan Ready-to-Drink Tea & Coffee Porter's Five Forces
- Pakistan Ready-to-Drink Tea & Coffee Industry Life Cycle
- Historical Data and Forecast of Pakistan Ready-to-Drink Tea & Coffee Market Revenues & Volume By Type for the Period 2022-2032F
- Historical Data and Forecast of Pakistan Ready-to-Drink Tea & Coffee Market Revenues & Volume By Coffee-Based for the Period 2022-2032F
- Historical Data and Forecast of Pakistan Ready-to-Drink Tea & Coffee Market Revenues & Volume By Tea-Based for the Period 2022-2032F
- Historical Data and Forecast of Pakistan Ready-to-Drink Tea & Coffee Market Revenues & Volume By Energy-Boosting for the Period 2022-2032F
- Historical Data and Forecast of Pakistan Ready-to-Drink Tea & Coffee Market Revenues & Volume By Herbal-Infused for the Period 2022-2032F
- Historical Data and Forecast of Pakistan Ready-to-Drink Tea & Coffee Market Revenues & Volume By Sugar-Free for the Period 2022 - 2032F
- Historical Data and Forecast of Pakistan Ready-to-Drink Tea & Coffee Market Revenues & Volume By Flavor for the Period 2022-2032F
- Historical Data and Forecast of Pakistan Ready-to-Drink Tea & Coffee Market Revenues & Volume By Mocha for the Period 2022-2032F
- Historical Data and Forecast of Pakistan Ready-to-Drink Tea & Coffee Market Revenues & Volume By Green Tea for the Period 2022-2032F
- Historical Data and Forecast of Pakistan Ready-to-Drink Tea & Coffee Market Revenues & Volume By Black Tea for the Period 2022-2032F
- Historical Data and Forecast of Pakistan Ready-to-Drink Tea & Coffee Market Revenues & Volume By Chamomile for the Period 2022-2032F
- Historical Data and Forecast of Pakistan Ready-to-Drink Tea & Coffee Market Revenues & Volume By Unsweetened for the Period 2022 - 2032F
- Historical Data and Forecast of Pakistan Ready-to-Drink Tea & Coffee Market Revenues & Volume By Packaging Type for the Period 2022-2032F
- Historical Data and Forecast of Pakistan Ready-to-Drink Tea & Coffee Market Revenues & Volume By Bottles for the Period 2022-2032F
- Historical Data and Forecast of Pakistan Ready-to-Drink Tea & Coffee Market Revenues & Volume By Cans for the Period 2022-2032F
- Historical Data and Forecast of Pakistan Ready-to-Drink Tea & Coffee Market Revenues & Volume By Tetra Packs for the Period 2022-2032F
- Historical Data and Forecast of Pakistan Ready-to-Drink Tea & Coffee Market Revenues & Volume By Pouches for the Period 2022-2032F
- Historical Data and Forecast of Pakistan Ready-to-Drink Tea & Coffee Market Revenues & Volume By Cartons for the Period 2022 - 2032F
- Historical Data and Forecast of Pakistan Ready-to-Drink Tea & Coffee Market Revenues & Volume By Distribution Channel for the Period 2022-2032F
- Historical Data and Forecast of Pakistan Ready-to-Drink Tea & Coffee Market Revenues & Volume By Supermarkets/Hypermarkets for the Period 2022-2032F
- Historical Data and Forecast of Pakistan Ready-to-Drink Tea & Coffee Market Revenues & Volume By Online Retail for the Period 2022-2032F
- Historical Data and Forecast of Pakistan Ready-to-Drink Tea & Coffee Market Revenues & Volume By Convenience Stores for the Period 2022-2032F
- Historical Data and Forecast of Pakistan Ready-to-Drink Tea & Coffee Market Revenues & Volume By Specialty Stores for the Period 2022-2032F
- Historical Data and Forecast of Pakistan Ready-to-Drink Tea & Coffee Market Revenues & Volume By Cafs & Restaurants for the Period 2022 - 2032F
- Historical Data and Forecast of Pakistan Ready-to-Drink Tea & Coffee Market Revenues & Volume By End User for the Period 2022-2032F
- Historical Data and Forecast of Pakistan Ready-to-Drink Tea & Coffee Market Revenues & Volume By Office Workers for the Period 2022-2032F
- Historical Data and Forecast of Pakistan Ready-to-Drink Tea & Coffee Market Revenues & Volume By Students for the Period 2022-2032F
- Historical Data and Forecast of Pakistan Ready-to-Drink Tea & Coffee Market Revenues & Volume By Travelers for the Period 2022-2032F
- Historical Data and Forecast of Pakistan Ready-to-Drink Tea & Coffee Market Revenues & Volume By Health Conscious for the Period 2022 - 2032F
- Historical Data and Forecast of Pakistan Ready-to-Drink Tea & Coffee Market Revenues & Volume By Diabetic Consumers for the Period 2022 - 2032F
- Pakistan Ready-to-Drink Tea & Coffee Import Export Trade Statistics
- Market Opportunity Assessment By Type
- Market Opportunity Assessment By Flavor
- Market Opportunity Assessment By Packaging Type
- Market Opportunity Assessment By Distribution Channel
- Market Opportunity Assessment By End User
- Pakistan Ready-to-Drink Tea & Coffee Top Companies Market Share
- Pakistan Ready-to-Drink Tea & Coffee Competitive Benchmarking By Technical and Operational Parameters
- Pakistan Ready-to-Drink Tea & Coffee Company Profiles
- Pakistan Ready-to-Drink Tea & Coffee Key Strategic Recommendations
Frequently Asked Questions About the Market Study (FAQs):
6Wresearch actively monitors the Pakistan Ready-to-Drink Tea & Coffee Market and publishes its comprehensive annual report, highlighting emerging trends, growth drivers, revenue analysis, and forecast outlook. Our insights help businesses to make data-backed strategic decisions with ongoing market dynamics. Our analysts track relevent industries related to the Pakistan Ready-to-Drink Tea & Coffee Market, allowing our clients with actionable intelligence and reliable forecasts tailored to emerging regional needs.
Yes, we provide customisation as per your requirements. To learn more, feel free to contact us on sales@6wresearch.com
1 Executive Summary |
2 Introduction |
2.1 Key Highlights of the Report |
2.2 Report Description |
2.3 Market Scope & Segmentation |
2.4 Research Methodology |
2.5 Assumptions |
3 Pakistan Ready-to-Drink Tea & Coffee Market Overview |
3.1 Pakistan Country Macro Economic Indicators |
3.2 Pakistan Ready-to-Drink Tea & Coffee Market Revenues & Volume, 2022 & 2032F |
3.3 Pakistan Ready-to-Drink Tea & Coffee Market - Industry Life Cycle |
3.4 Pakistan Ready-to-Drink Tea & Coffee Market - Porter's Five Forces |
3.5 Pakistan Ready-to-Drink Tea & Coffee Market Revenues & Volume Share, By Type, 2022 & 2032F |
3.6 Pakistan Ready-to-Drink Tea & Coffee Market Revenues & Volume Share, By Flavor, 2022 & 2032F |
3.7 Pakistan Ready-to-Drink Tea & Coffee Market Revenues & Volume Share, By Packaging Type, 2022 & 2032F |
3.8 Pakistan Ready-to-Drink Tea & Coffee Market Revenues & Volume Share, By Distribution Channel, 2022 & 2032F |
3.9 Pakistan Ready-to-Drink Tea & Coffee Market Revenues & Volume Share, By End User, 2022 & 2032F |
4 Pakistan Ready-to-Drink Tea & Coffee Market Dynamics |
4.1 Impact Analysis |
4.2 Market Drivers |
4.2.1 Increasing urbanization and changing lifestyles leading to higher demand for convenient beverage options. |
4.2.2 Growing awareness about health and wellness, driving the demand for healthier ready-to-drink tea and coffee products. |
4.2.3 Rising disposable incomes and a burgeoning middle-class population fueling consumption of premium and specialty beverages. |
4.3 Market Restraints |
4.3.1 Fluctuations in raw material prices such as tea leaves and coffee beans impacting production costs. |
4.3.2 Intense competition from other beverage categories like carbonated drinks, juices, and energy drinks. |
4.3.3 Regulatory challenges related to labeling, ingredients, and advertising affecting market growth. |
5 Pakistan Ready-to-Drink Tea & Coffee Market Trends |
6 Pakistan Ready-to-Drink Tea & Coffee Market, By Types |
6.1 Pakistan Ready-to-Drink Tea & Coffee Market, By Type |
6.1.1 Overview and Analysis |
6.1.2 Pakistan Ready-to-Drink Tea & Coffee Market Revenues & Volume, By Type, 2022 - 2032F |
6.1.3 Pakistan Ready-to-Drink Tea & Coffee Market Revenues & Volume, By Coffee-Based, 2022 - 2032F |
6.1.4 Pakistan Ready-to-Drink Tea & Coffee Market Revenues & Volume, By Tea-Based, 2022 - 2032F |
6.1.5 Pakistan Ready-to-Drink Tea & Coffee Market Revenues & Volume, By Energy-Boosting, 2022 - 2032F |
6.1.6 Pakistan Ready-to-Drink Tea & Coffee Market Revenues & Volume, By Herbal-Infused, 2022 - 2032F |
6.1.7 Pakistan Ready-to-Drink Tea & Coffee Market Revenues & Volume, By Sugar-Free, 2022 - 2032F |
6.2 Pakistan Ready-to-Drink Tea & Coffee Market, By Flavor |
6.2.1 Overview and Analysis |
6.2.2 Pakistan Ready-to-Drink Tea & Coffee Market Revenues & Volume, By Mocha, 2022 - 2032F |
6.2.3 Pakistan Ready-to-Drink Tea & Coffee Market Revenues & Volume, By Green Tea, 2022 - 2032F |
6.2.4 Pakistan Ready-to-Drink Tea & Coffee Market Revenues & Volume, By Black Tea, 2022 - 2032F |
6.2.5 Pakistan Ready-to-Drink Tea & Coffee Market Revenues & Volume, By Chamomile, 2022 - 2032F |
6.2.6 Pakistan Ready-to-Drink Tea & Coffee Market Revenues & Volume, By Unsweetened, 2022 - 2032F |
6.3 Pakistan Ready-to-Drink Tea & Coffee Market, By Packaging Type |
6.3.1 Overview and Analysis |
6.3.2 Pakistan Ready-to-Drink Tea & Coffee Market Revenues & Volume, By Bottles, 2022 - 2032F |
6.3.3 Pakistan Ready-to-Drink Tea & Coffee Market Revenues & Volume, By Cans, 2022 - 2032F |
6.3.4 Pakistan Ready-to-Drink Tea & Coffee Market Revenues & Volume, By Tetra Packs, 2022 - 2032F |
6.3.5 Pakistan Ready-to-Drink Tea & Coffee Market Revenues & Volume, By Pouches, 2022 - 2032F |
6.3.6 Pakistan Ready-to-Drink Tea & Coffee Market Revenues & Volume, By Cartons, 2022 - 2032F |
6.4 Pakistan Ready-to-Drink Tea & Coffee Market, By Distribution Channel |
6.4.1 Overview and Analysis |
6.4.2 Pakistan Ready-to-Drink Tea & Coffee Market Revenues & Volume, By Supermarkets/Hypermarkets, 2022 - 2032F |
6.4.3 Pakistan Ready-to-Drink Tea & Coffee Market Revenues & Volume, By Online Retail, 2022 - 2032F |
6.4.4 Pakistan Ready-to-Drink Tea & Coffee Market Revenues & Volume, By Convenience Stores, 2022 - 2032F |
6.4.5 Pakistan Ready-to-Drink Tea & Coffee Market Revenues & Volume, By Specialty Stores, 2022 - 2032F |
6.4.6 Pakistan Ready-to-Drink Tea & Coffee Market Revenues & Volume, By Caf s & Restaurants, 2022 - 2032F |
6.5 Pakistan Ready-to-Drink Tea & Coffee Market, By End User |
6.5.1 Overview and Analysis |
6.5.2 Pakistan Ready-to-Drink Tea & Coffee Market Revenues & Volume, By Office Workers, 2022 - 2032F |
6.5.3 Pakistan Ready-to-Drink Tea & Coffee Market Revenues & Volume, By Students, 2022 - 2032F |
6.5.4 Pakistan Ready-to-Drink Tea & Coffee Market Revenues & Volume, By Travelers, 2022 - 2032F |
6.5.5 Pakistan Ready-to-Drink Tea & Coffee Market Revenues & Volume, By Health Conscious, 2022 - 2032F |
6.5.6 Pakistan Ready-to-Drink Tea & Coffee Market Revenues & Volume, By Diabetic Consumers, 2022 - 2032F |
7 Pakistan Ready-to-Drink Tea & Coffee Market Import-Export Trade Statistics |
7.1 Pakistan Ready-to-Drink Tea & Coffee Market Export to Major Countries |
7.2 Pakistan Ready-to-Drink Tea & Coffee Market Imports from Major Countries |
8 Pakistan Ready-to-Drink Tea & Coffee Market Key Performance Indicators |
8.1 Consumer engagement metrics on social media platforms such as likes, shares, comments, and brand mentions. |
8.2 Product innovation rate measured by the number of new flavors, packaging formats, or functional ingredients introduced. |
8.3 Distribution network expansion metrics tracking the number of new retail outlets, convenience stores, and online platforms carrying ready-to-drink tea and coffee products. |
8.4 Sustainability practices adoption indicators like recyclable packaging materials, carbon footprint reduction initiatives, and ethical sourcing practices implementation. |
9 Pakistan Ready-to-Drink Tea & Coffee Market - Opportunity Assessment |
9.1 Pakistan Ready-to-Drink Tea & Coffee Market Opportunity Assessment, By Type, 2022 & 2032F |
9.2 Pakistan Ready-to-Drink Tea & Coffee Market Opportunity Assessment, By Flavor, 2022 & 2032F |
9.3 Pakistan Ready-to-Drink Tea & Coffee Market Opportunity Assessment, By Packaging Type, 2022 & 2032F |
9.4 Pakistan Ready-to-Drink Tea & Coffee Market Opportunity Assessment, By Distribution Channel, 2022 & 2032F |
9.5 Pakistan Ready-to-Drink Tea & Coffee Market Opportunity Assessment, By End User, 2022 & 2032F |
10 Pakistan Ready-to-Drink Tea & Coffee Market - Competitive Landscape |
10.1 Pakistan Ready-to-Drink Tea & Coffee Market Revenue Share, By Companies, 2025 |
10.2 Pakistan Ready-to-Drink Tea & Coffee Market Competitive Benchmarking, By Operating and Technical Parameters |
11 Company Profiles |
12 Recommendations |
13 Disclaimer |
Export potential assessment - trade Analytics for 2030
Export potential enables firms to identify high-growth global markets with greater confidence by combining advanced trade intelligence with a structured quantitative methodology. The framework analyzes emerging demand trends and country-level import patterns while integrating macroeconomic and trade datasets such as GDP and population forecasts, bilateral import–export flows, tariff structures, elasticity differentials between developed and developing economies, geographic distance, and import demand projections. Using weighted trade values from 2020–2024 as the base period to project country-to-country export potential for 2030, these inputs are operationalized through calculated drivers such as gravity model parameters, tariff impact factors, and projected GDP per-capita growth. Through an analysis of hidden potentials, demand hotspots, and market conditions that are most favorable to success, this method enables firms to focus on target countries, maximize returns, and global expansion with data, backed by accuracy.
By factoring in the projected importer demand gap that is currently unmet and could be potential opportunity, it identifies the potential for the Exporter (Country) among 190 countries, against the general trade analysis, which identifies the biggest importer or exporter.
To discover high-growth global markets and optimize your business strategy:
Click Here
Pricing
- Single User License$ 1,995
- Department License$ 2,400
- Site License$ 3,120
- Global License$ 3,795

Search
Thought Leadership and Analyst Meet


Our Clients
Latest Reports
- Philippines Polyhydroxybutyrate-co-Hydroxyvalerate Market (2026-2032) | Trends, Insights, Challenges, Restraints, Competition, Size, Value, Forecast, Pricing, Share, Outlook, Revenue, Investment Opportunities, Strategy, Drivers, Demand, Growth, segmentation, Analysis, Companies
- Peru Polyhydroxybutyrate-co-Hydroxyvalerate Market (2026-2032) | Growth, Demand, Challenges, Share, Trends, Analysis, Pricing, Investment Opportunities, Drivers, Value, Forecast, Competition, Size, Companies, Insights, Outlook, Restraints, segmentation, Revenue, Strategy
- Pakistan Polyhydroxybutyrate-co-Hydroxyvalerate Market (2026-2032) | Restraints, segmentation, Pricing, Forecast, Share, Strategy, Competition, Trends, Insights, Drivers, Challenges, Growth, Revenue, Outlook, Value, Investment Opportunities, Companies, Size, Analysis, Demand
- Oman Polyhydroxybutyrate-co-Hydroxyvalerate Market (2026-2032) | Drivers, segmentation, Insights, Competition, Pricing, Outlook, Size, Revenue, Challenges, Forecast, Analysis, Growth, Value, Share, Trends, Investment Opportunities, Strategy, Restraints, Companies, Demand
- Nigeria Polyhydroxybutyrate-co-Hydroxyvalerate Market (2026-2032) | Value, Investment Opportunities, Analysis, Revenue, Restraints, Pricing, Outlook, Competition, Demand, Growth, Forecast, Companies, Trends, Challenges, segmentation, Drivers, Insights, Share, Size, Strategy
- Nepal Polyhydroxybutyrate-co-Hydroxyvalerate Market (2026-2032) | Insights, Analysis, Drivers, Share, Revenue, Demand, segmentation, Investment Opportunities, Competition, Forecast, Growth, Pricing, Companies, Strategy, Trends, Restraints, Challenges, Outlook, Size, Value
- Myanmar Polyhydroxybutyrate-co-Hydroxyvalerate Market (2026-2032) | Outlook, Revenue, Strategy, Restraints, Drivers, segmentation, Share, Forecast, Competition, Insights, Growth, Pricing, Size, Demand, Value, Companies, Trends, Challenges, Investment Opportunities, Analysis
- Morocco Polyhydroxybutyrate-co-Hydroxyvalerate Market (2026-2032) | Outlook, Investment Opportunities, Restraints, Strategy, Forecast, Challenges, Drivers, Growth, Companies, segmentation, Trends, Size, Competition, Revenue, Demand, Insights, Share, Analysis, Value, Pricing
- Mexico Polyhydroxybutyrate-co-Hydroxyvalerate Market (2026-2032) | Size, Drivers, Outlook, Share, Strategy, Growth, Pricing, Challenges, Companies, Demand, Value, Investment Opportunities, Restraints, Trends, Forecast, segmentation, Analysis, Insights, Competition, Revenue
- Malaysia Polyhydroxybutyrate-co-Hydroxyvalerate Market (2026-2032) | Share, segmentation, Size, Companies, Analysis, Insights, Forecast, Value, Revenue, Drivers, Restraints, Challenges, Investment Opportunities, Trends, Competition, Strategy, Demand, Growth, Outlook, Pricing
Industry Events and Analyst Meet

HIMTEX 2026

India Refining Summit 2026

India EV Show 2026

EV tech India Expo 2026

Auto Tech Asia 2026
Whitepaper
- Middle East & Africa Commercial Security Market Click here to view more.
- Middle East & Africa Fire Safety Systems & Equipment Market Click here to view more.
- GCC Drone Market Click here to view more.
- Middle East Lighting Fixture Market Click here to view more.
- GCC Physical & Perimeter Security Market Click here to view more.
6WResearch In News
- Doha a strategic location for EV manufacturing hub: IPA Qatar
- Demand for luxury TVs surging in the GCC, says Samsung
- Empowering Growth: The Thriving Journey of Bangladesh’s Cable Industry
- Demand for luxury TVs surging in the GCC, says Samsung
- Video call with a traditional healer? Once unthinkable, it’s now common in South Africa
- Intelligent Buildings To Smooth GCC’s Path To Net Zero