Papua New Guinea CBD Patch Market (2026-2032) | Analysis, Industry, Competitive Landscape, Companies, Value, Share, Segmentation, Growth, Forecast, Size & Revenue, Trends, Outlook
Market Forecast By Product (Layer Drug-In-Adhesive, Reservoir, Matrix), By Species (Cannabis Indica, Sativa, Hybrid), By Packaging (Two to Five Patches, Single Patch, More Than Five Patches), By Dosage (Below 30mg, 30-40 mg, 40-50mg, Above 50 mg), By Derivatives (Cannabidiol (CBD), Tetrahydrocannabinol (THC), Others), By Application (Chronic Pain, Anxiety, Arthritis, Elevate Mood, Neurological Pain, Others), By Source Type (Natural, Synthetic), By End User (Homecare Setting, Research and Development Centres, Hospital, Clinics, Rehab Centres, Others) And Competitive Landscape
| Product Code: ETC8771844 | Publication Date: Sep 2024 | Updated Date: Feb 2026 | Product Type: Market Research Report | |
| Publisher: 6Wresearch | Author: Summon Dutta | No. of Pages: 75 | No. of Figures: 35 | No. of Tables: 20 |
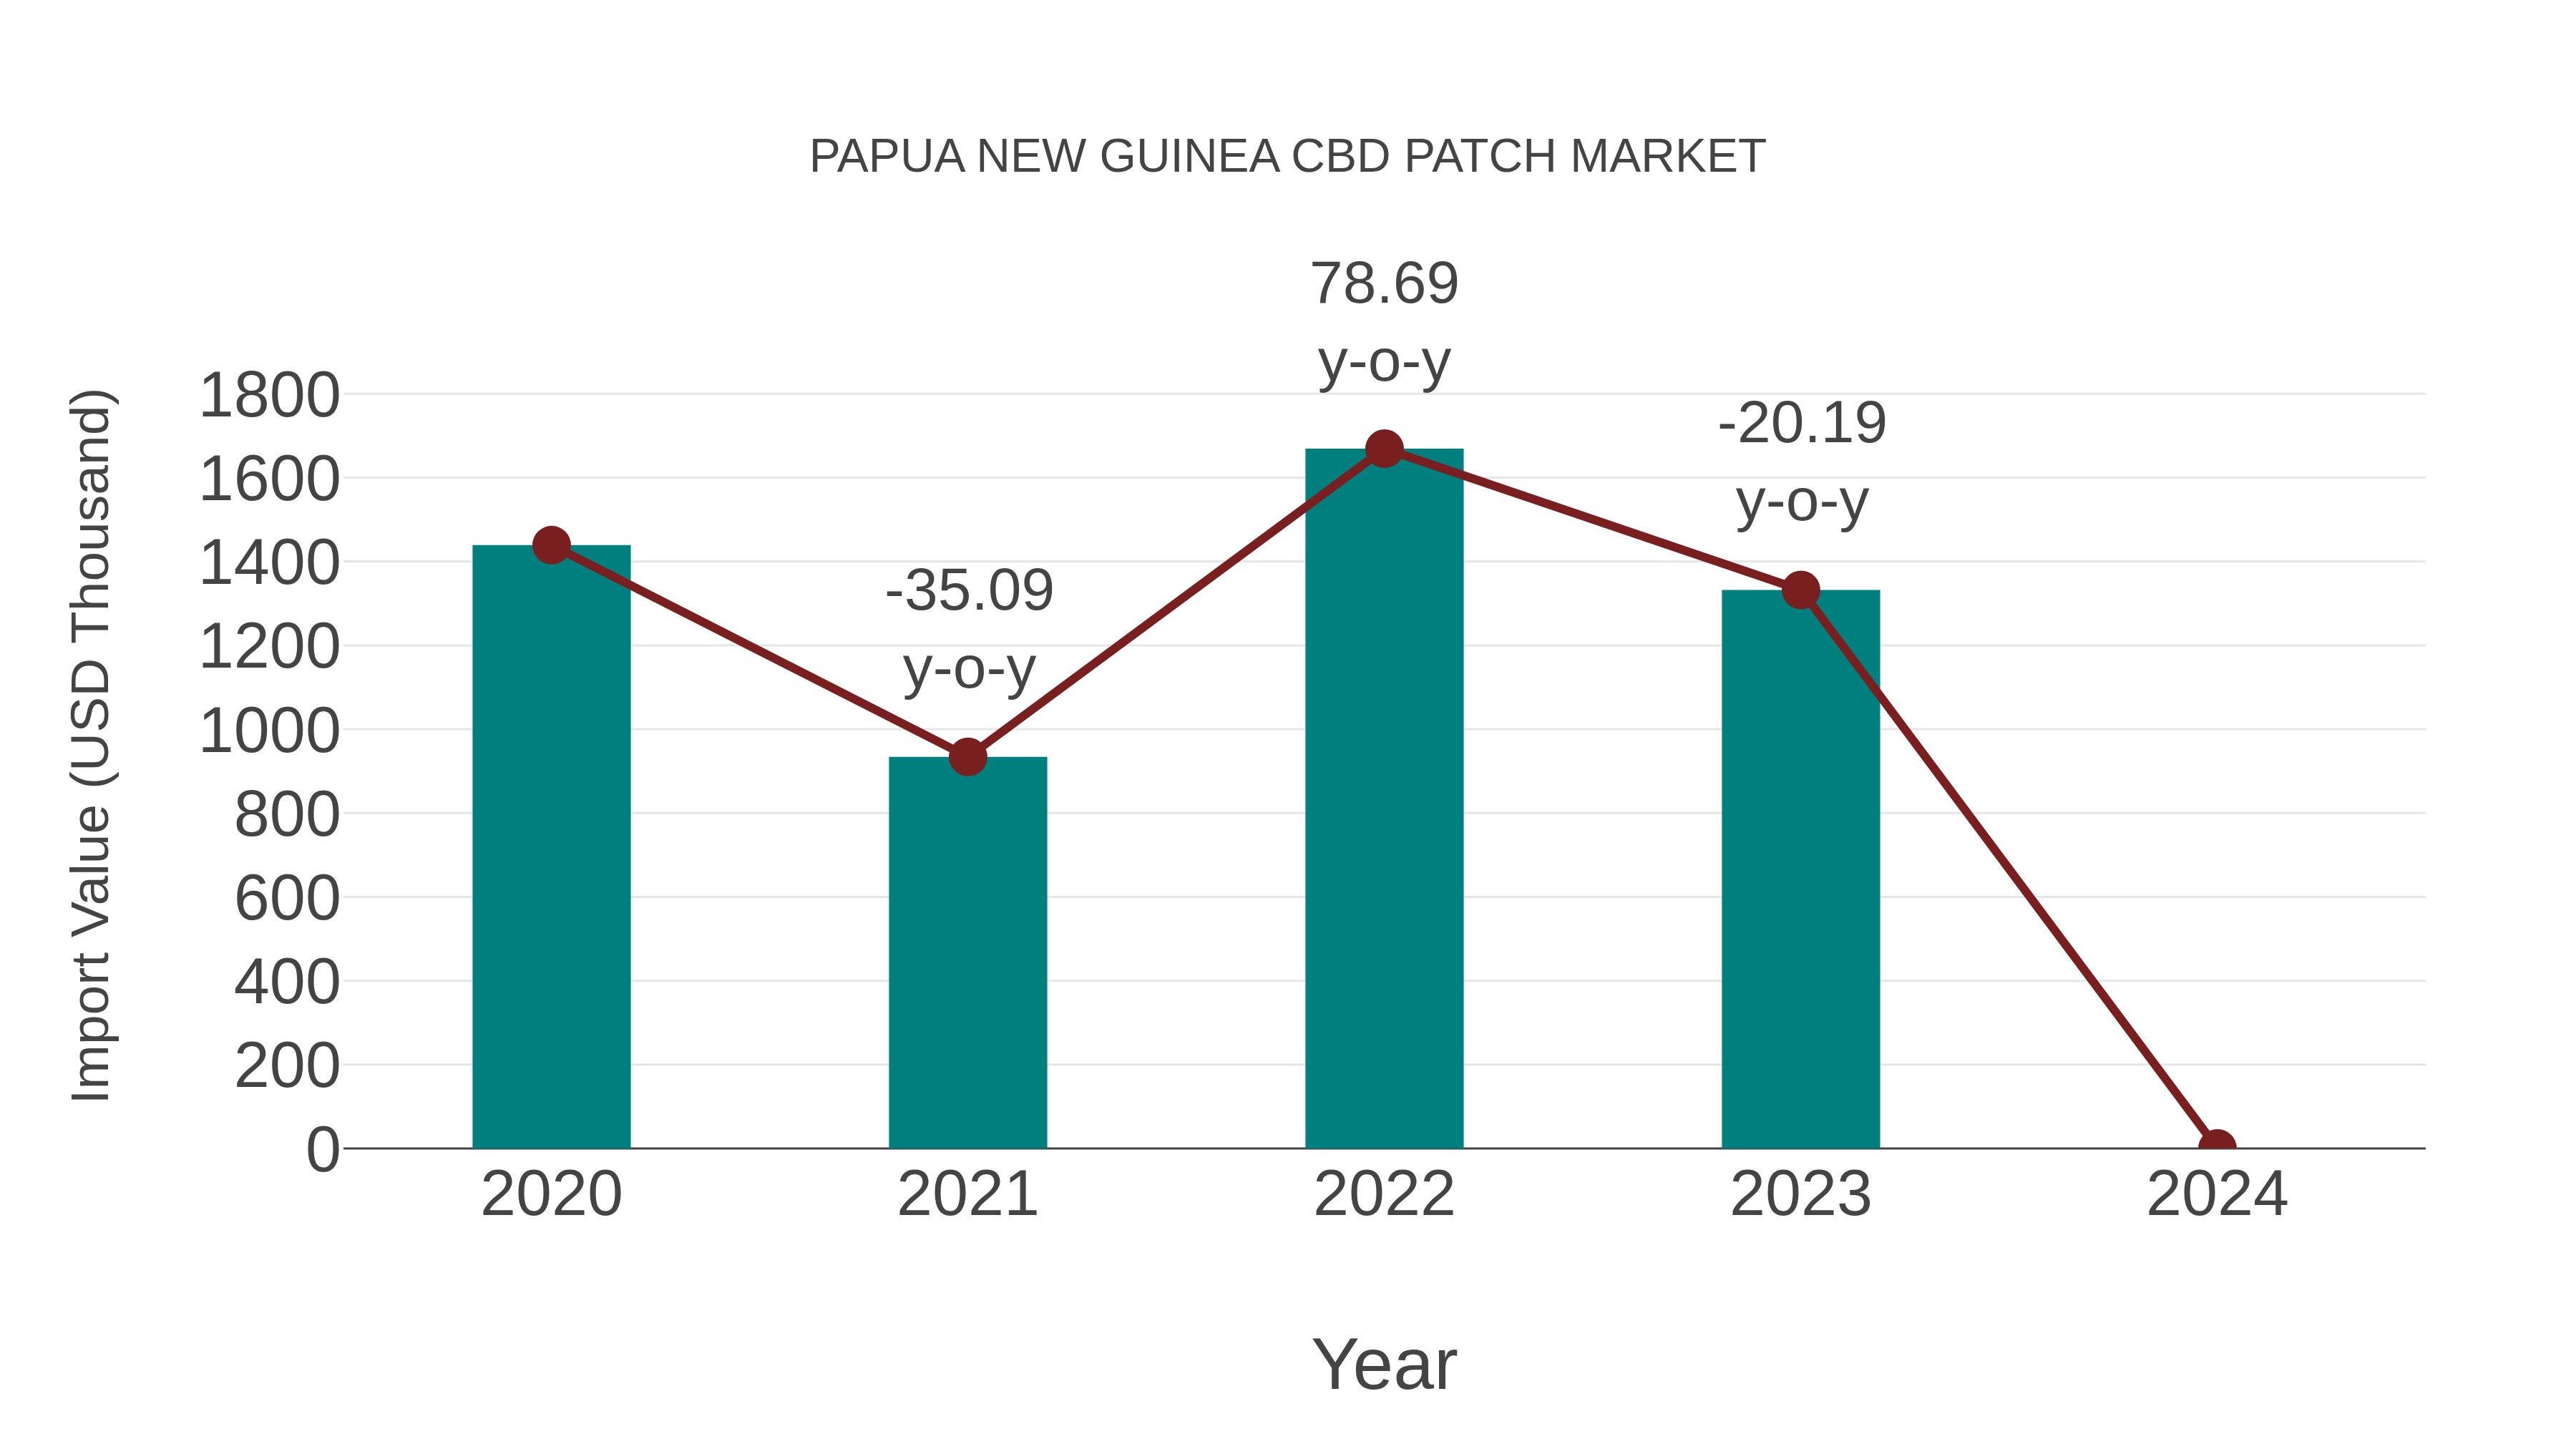
Papua New Guinea Cbd Patch Market: Import Trend Analysis
The import trend for CBD patches in the Papua New Guinea market showed steady growth from 2018 to 2020, with an increase in demand for these products. The market experienced a notable rise in imported CBD patches during this period.
Key Highlights of the Report:
- Papua New Guinea CBD Patch Market Outlook
- Market Size of Papua New Guinea CBD Patch Market, 2025
- Forecast of Papua New Guinea CBD Patch Market, 2032
- Historical Data and Forecast of Papua New Guinea CBD Patch Revenues & Volume for the Period 2022-2032F
- Papua New Guinea CBD Patch Market Trend Evolution
- Papua New Guinea CBD Patch Market Drivers and Challenges
- Papua New Guinea CBD Patch Price Trends
- Papua New Guinea CBD Patch Porter's Five Forces
- Papua New Guinea CBD Patch Industry Life Cycle
- Historical Data and Forecast of Papua New Guinea CBD Patch Market Revenues & Volume By Product for the Period 2022-2032F
- Historical Data and Forecast of Papua New Guinea CBD Patch Market Revenues & Volume By Layer Drug-In-Adhesive for the Period 2022-2032F
- Historical Data and Forecast of Papua New Guinea CBD Patch Market Revenues & Volume By Reservoir for the Period 2022-2032F
- Historical Data and Forecast of Papua New Guinea CBD Patch Market Revenues & Volume By Matrix for the Period 2022-2032F
- Historical Data and Forecast of Papua New Guinea CBD Patch Market Revenues & Volume By Species for the Period 2022-2032F
- Historical Data and Forecast of Papua New Guinea CBD Patch Market Revenues & Volume By Cannabis Indica for the Period 2022-2032F
- Historical Data and Forecast of Papua New Guinea CBD Patch Market Revenues & Volume By Sativa for the Period 2022-2032F
- Historical Data and Forecast of Papua New Guinea CBD Patch Market Revenues & Volume By Hybrid for the Period 2022-2032F
- Historical Data and Forecast of Papua New Guinea CBD Patch Market Revenues & Volume By Packaging for the Period 2022-2032F
- Historical Data and Forecast of Papua New Guinea CBD Patch Market Revenues & Volume By Two to Five Patches for the Period 2022-2032F
- Historical Data and Forecast of Papua New Guinea CBD Patch Market Revenues & Volume By Single Patch for the Period 2022-2032F
- Historical Data and Forecast of Papua New Guinea CBD Patch Market Revenues & Volume By More Than Five Patches for the Period 2022-2032F
- Historical Data and Forecast of Papua New Guinea CBD Patch Market Revenues & Volume By Dosage for the Period 2022-2032F
- Historical Data and Forecast of Papua New Guinea CBD Patch Market Revenues & Volume By Below 30mg for the Period 2022-2032F
- Historical Data and Forecast of Papua New Guinea CBD Patch Market Revenues & Volume By 30-40 mg for the Period 2022-2032F
- Historical Data and Forecast of Papua New Guinea CBD Patch Market Revenues & Volume By 40-50mg for the Period 2022-2032F
- Historical Data and Forecast of Papua New Guinea CBD Patch Market Revenues & Volume By Above 50 mg for the Period 2022-2032F
- Historical Data and Forecast of Papua New Guinea CBD Patch Market Revenues & Volume By Derivatives for the Period 2022-2032F
- Historical Data and Forecast of Papua New Guinea CBD Patch Market Revenues & Volume By Cannabidiol (CBD) for the Period 2022-2032F
- Historical Data and Forecast of Papua New Guinea CBD Patch Market Revenues & Volume By Tetrahydrocannabinol (THC) for the Period 2022-2032F
- Historical Data and Forecast of Papua New Guinea CBD Patch Market Revenues & Volume By Others for the Period 2022-2032F
- Historical Data and Forecast of Papua New Guinea CBD Patch Market Revenues & Volume By Application for the Period 2022-2032F
- Historical Data and Forecast of Papua New Guinea CBD Patch Market Revenues & Volume By Chronic Pain for the Period 2022-2032F
- Historical Data and Forecast of Papua New Guinea CBD Patch Market Revenues & Volume By Anxiety for the Period 2022-2032F
- Historical Data and Forecast of Papua New Guinea CBD Patch Market Revenues & Volume By Arthritis for the Period 2022-2032F
- Historical Data and Forecast of Papua New Guinea CBD Patch Market Revenues & Volume By Elevate Mood for the Period 2022-2032F
- Historical Data and Forecast of Papua New Guinea CBD Patch Market Revenues & Volume By Neurological Pain for the Period 2022-2032F
- Historical Data and Forecast of Papua New Guinea CBD Patch Market Revenues & Volume By Others for the Period 2022-2032F
- Historical Data and Forecast of Papua New Guinea CBD Patch Market Revenues & Volume By Source Type for the Period 2022-2032F
- Historical Data and Forecast of Papua New Guinea CBD Patch Market Revenues & Volume By Natural for the Period 2022-2032F
- Historical Data and Forecast of Papua New Guinea CBD Patch Market Revenues & Volume By Synthetic for the Period 2022-2032F
- Historical Data and Forecast of Papua New Guinea CBD Patch Market Revenues & Volume By End User for the Period 2022-2032F
- Historical Data and Forecast of Papua New Guinea CBD Patch Market Revenues & Volume By Homecare Setting for the Period 2022-2032F
- Historical Data and Forecast of Papua New Guinea CBD Patch Market Revenues & Volume By Research and Development Centres for the Period 2022-2032F
- Historical Data and Forecast of Papua New Guinea CBD Patch Market Revenues & Volume By Hospital for the Period 2022-2032F
- Historical Data and Forecast of Papua New Guinea CBD Patch Market Revenues & Volume By Clinics for the Period 2022-2032F
- Historical Data and Forecast of Papua New Guinea CBD Patch Market Revenues & Volume By Rehab Centres for the Period 2022-2032F
- Historical Data and Forecast of Papua New Guinea CBD Patch Market Revenues & Volume By Others for the Period 2022-2032F
- Papua New Guinea CBD Patch Import Export Trade Statistics
- Market Opportunity Assessment By Product
- Market Opportunity Assessment By Species
- Market Opportunity Assessment By Packaging
- Market Opportunity Assessment By Dosage
- Market Opportunity Assessment By Derivatives
- Market Opportunity Assessment By Application
- Market Opportunity Assessment By Source Type
- Market Opportunity Assessment By End User
- Papua New Guinea CBD Patch Top Companies Market Share
- Papua New Guinea CBD Patch Competitive Benchmarking By Technical and Operational Parameters
- Papua New Guinea CBD Patch Company Profiles
- Papua New Guinea CBD Patch Key Strategic Recommendations
Frequently Asked Questions About the Market Study (FAQs):
6Wresearch actively monitors the Papua New Guinea CBD Patch Market and publishes its comprehensive annual report, highlighting emerging trends, growth drivers, revenue analysis, and forecast outlook. Our insights help businesses to make data-backed strategic decisions with ongoing market dynamics. Our analysts track relevent industries related to the Papua New Guinea CBD Patch Market, allowing our clients with actionable intelligence and reliable forecasts tailored to emerging regional needs.
Yes, we provide customisation as per your requirements. To learn more, feel free to contact us on sales@6wresearch.com
1 Executive Summary |
2 Introduction |
2.1 Key Highlights of the Report |
2.2 Report Description |
2.3 Market Scope & Segmentation |
2.4 Research Methodology |
2.5 Assumptions |
3 Papua New Guinea CBD Patch Market Overview |
3.1 Papua New Guinea Country Macro Economic Indicators |
3.2 Papua New Guinea CBD Patch Market Revenues & Volume, 2022 & 2032F |
3.3 Papua New Guinea CBD Patch Market - Industry Life Cycle |
3.4 Papua New Guinea CBD Patch Market - Porter's Five Forces |
3.5 Papua New Guinea CBD Patch Market Revenues & Volume Share, By Product, 2022 & 2032F |
3.6 Papua New Guinea CBD Patch Market Revenues & Volume Share, By Species, 2022 & 2032F |
3.7 Papua New Guinea CBD Patch Market Revenues & Volume Share, By Packaging, 2022 & 2032F |
3.8 Papua New Guinea CBD Patch Market Revenues & Volume Share, By Dosage, 2022 & 2032F |
3.9 Papua New Guinea CBD Patch Market Revenues & Volume Share, By Derivatives, 2022 & 2032F |
3.10 Papua New Guinea CBD Patch Market Revenues & Volume Share, By Application, 2022 & 2032F |
3.11 Papua New Guinea CBD Patch Market Revenues & Volume Share, By Source Type, 2022 & 2032F |
4 Papua New Guinea CBD Patch Market Dynamics |
4.1 Impact Analysis |
4.2 Market Drivers |
4.2.1 Increasing awareness about the benefits of CBD products |
4.2.2 Growing acceptance of alternative healthcare solutions |
4.2.3 Favorable government regulations promoting the use of CBD products |
4.3 Market Restraints |
4.3.1 Limited availability of high-quality CBD patches in the market |
4.3.2 Lack of clear regulatory framework for CBD products in Papua New Guinea |
5 Papua New Guinea CBD Patch Market Trends |
6 Papua New Guinea CBD Patch Market, By Types |
6.1 Papua New Guinea CBD Patch Market, By Product |
6.1.1 Overview and Analysis |
6.1.2 Papua New Guinea CBD Patch Market Revenues & Volume, By Product, 2022-2032F |
6.1.3 Papua New Guinea CBD Patch Market Revenues & Volume, By Layer Drug-In-Adhesive, 2022-2032F |
6.1.4 Papua New Guinea CBD Patch Market Revenues & Volume, By Reservoir, 2022-2032F |
6.1.5 Papua New Guinea CBD Patch Market Revenues & Volume, By Matrix, 2022-2032F |
6.2 Papua New Guinea CBD Patch Market, By Species |
6.2.1 Overview and Analysis |
6.2.2 Papua New Guinea CBD Patch Market Revenues & Volume, By Cannabis Indica, 2022-2032F |
6.2.3 Papua New Guinea CBD Patch Market Revenues & Volume, By Sativa, 2022-2032F |
6.2.4 Papua New Guinea CBD Patch Market Revenues & Volume, By Hybrid, 2022-2032F |
6.3 Papua New Guinea CBD Patch Market, By Packaging |
6.3.1 Overview and Analysis |
6.3.2 Papua New Guinea CBD Patch Market Revenues & Volume, By Two to Five Patches, 2022-2032F |
6.3.3 Papua New Guinea CBD Patch Market Revenues & Volume, By Single Patch, 2022-2032F |
6.3.4 Papua New Guinea CBD Patch Market Revenues & Volume, By More Than Five Patches, 2022-2032F |
6.4 Papua New Guinea CBD Patch Market, By Dosage |
6.4.1 Overview and Analysis |
6.4.2 Papua New Guinea CBD Patch Market Revenues & Volume, By Below 30mg, 2022-2032F |
6.4.3 Papua New Guinea CBD Patch Market Revenues & Volume, By 30-40 mg, 2022-2032F |
6.4.4 Papua New Guinea CBD Patch Market Revenues & Volume, By 40-50mg, 2022-2032F |
6.4.5 Papua New Guinea CBD Patch Market Revenues & Volume, By Above 50 mg, 2022-2032F |
6.5 Papua New Guinea CBD Patch Market, By Derivatives |
6.5.1 Overview and Analysis |
6.5.2 Papua New Guinea CBD Patch Market Revenues & Volume, By Cannabidiol (CBD), 2022-2032F |
6.5.3 Papua New Guinea CBD Patch Market Revenues & Volume, By Tetrahydrocannabinol (THC), 2022-2032F |
6.5.4 Papua New Guinea CBD Patch Market Revenues & Volume, By Others, 2022-2032F |
6.6 Papua New Guinea CBD Patch Market, By Application |
6.6.1 Overview and Analysis |
6.6.2 Papua New Guinea CBD Patch Market Revenues & Volume, By Chronic Pain, 2022-2032F |
6.6.3 Papua New Guinea CBD Patch Market Revenues & Volume, By Anxiety, 2022-2032F |
6.6.4 Papua New Guinea CBD Patch Market Revenues & Volume, By Arthritis, 2022-2032F |
6.6.5 Papua New Guinea CBD Patch Market Revenues & Volume, By Elevate Mood, 2022-2032F |
6.6.6 Papua New Guinea CBD Patch Market Revenues & Volume, By Neurological Pain, 2022-2032F |
6.6.7 Papua New Guinea CBD Patch Market Revenues & Volume, By Others, 2022-2032F |
6.7 Papua New Guinea CBD Patch Market, By Source Type |
6.7.1 Overview and Analysis |
6.7.2 Papua New Guinea CBD Patch Market Revenues & Volume, By Natural, 2022-2032F |
6.7.3 Papua New Guinea CBD Patch Market Revenues & Volume, By Synthetic, 2022-2032F |
6.8 Papua New Guinea CBD Patch Market, By End User |
6.8.1 Overview and Analysis |
6.8.2 Papua New Guinea CBD Patch Market Revenues & Volume, By Homecare Setting, 2022-2032F |
6.8.3 Papua New Guinea CBD Patch Market Revenues & Volume, By Research and Development Centres, 2022-2032F |
6.8.4 Papua New Guinea CBD Patch Market Revenues & Volume, By Clinics, 2022-2032F |
6.8.5 Papua New Guinea CBD Patch Market Revenues & Volume, By Clinics, 2022-2032F |
6.8.6 Papua New Guinea CBD Patch Market Revenues & Volume, By Rehab Centres, 2022-2032F |
6.8.7 Papua New Guinea CBD Patch Market Revenues & Volume, By Others, 2022-2032F |
7 Papua New Guinea CBD Patch Market Import-Export Trade Statistics |
7.1 Papua New Guinea CBD Patch Market Export to Major Countries |
7.2 Papua New Guinea CBD Patch Market Imports from Major Countries |
8 Papua New Guinea CBD Patch Market Key Performance Indicators |
8.1 Number of clinical trials conducted on CBD patches in Papua New Guinea |
8.2 Percentage of healthcare professionals recommending CBD patches |
8.3 Growth in the number of retail outlets selling CBD patches |
9 Papua New Guinea CBD Patch Market - Opportunity Assessment |
9.1 Papua New Guinea CBD Patch Market Opportunity Assessment, By Product, 2022 & 2032F |
9.2 Papua New Guinea CBD Patch Market Opportunity Assessment, By Species, 2022 & 2032F |
9.3 Papua New Guinea CBD Patch Market Opportunity Assessment, By Packaging, 2022 & 2032F |
9.4 Papua New Guinea CBD Patch Market Opportunity Assessment, By Dosage, 2022 & 2032F |
9.5 Papua New Guinea CBD Patch Market Opportunity Assessment, By Derivatives, 2022 & 2032F |
9.6 Papua New Guinea CBD Patch Market Opportunity Assessment, By Application, 2022 & 2032F |
9.7 Papua New Guinea CBD Patch Market Opportunity Assessment, By Source Type, 2022 & 2032F |
9.7 Papua New Guinea CBD Patch Market Opportunity Assessment, By End User, 2022 & 2032F |
10 Papua New Guinea CBD Patch Market - Competitive Landscape |
10.1 Papua New Guinea CBD Patch Market Revenue Share, By Companies, 2025 |
10.2 Papua New Guinea CBD Patch Market Competitive Benchmarking, By Operating and Technical Parameters |
11 Company Profiles |
12 Recommendations |
13 Disclaimer |
Export potential assessment - trade Analytics for 2030
Export potential enables firms to identify high-growth global markets with greater confidence by combining advanced trade intelligence with a structured quantitative methodology. The framework analyzes emerging demand trends and country-level import patterns while integrating macroeconomic and trade datasets such as GDP and population forecasts, bilateral import–export flows, tariff structures, elasticity differentials between developed and developing economies, geographic distance, and import demand projections. Using weighted trade values from 2020–2024 as the base period to project country-to-country export potential for 2030, these inputs are operationalized through calculated drivers such as gravity model parameters, tariff impact factors, and projected GDP per-capita growth. Through an analysis of hidden potentials, demand hotspots, and market conditions that are most favorable to success, this method enables firms to focus on target countries, maximize returns, and global expansion with data, backed by accuracy.
By factoring in the projected importer demand gap that is currently unmet and could be potential opportunity, it identifies the potential for the Exporter (Country) among 190 countries, against the general trade analysis, which identifies the biggest importer or exporter.
To discover high-growth global markets and optimize your business strategy:
Click Here
Pricing
- Single User License$ 1,995
- Department License$ 2,400
- Site License$ 3,120
- Global License$ 3,795

Search
Thought Leadership and Analyst Meet


Our Clients
Latest Reports
- China Electric Appliance Rental Market (2026-2032) | Trends, Revenue, Growth, Challenges, Size, Value, Outlook, Pricing, Strategy, Insights, Restraints, segmentation, Companies, Investment Opportunities, Analysis, Demand, Drivers, Competition, Forecast, Share
- Chile Electric Appliance Rental Market (2026-2032) | Outlook, Competition, Drivers, Strategy, Revenue, Analysis, Value, Pricing, Restraints, Size, Demand, Share, Growth, Forecast, Challenges, Insights, Investment Opportunities, Companies, Trends, segmentation
- Cambodia Electric Appliance Rental Market (2026-2032) | Companies, Analysis, Restraints, Pricing, Insights, Challenges, Outlook, Strategy, Forecast, Trends, Competition, Value, Revenue, Investment Opportunities, segmentation, Drivers, Size, Demand, Growth, Share
- Brazil Electric Appliance Rental Market (2026-2032) | Revenue, Strategy, Forecast, Companies, segmentation, Competition, Size, Investment Opportunities, Pricing, Restraints, Outlook, Challenges, Analysis, Drivers, Value, Demand, Insights, Trends, Growth, Share
- Bangladesh Electric Appliance Rental Market (2026-2032) | Drivers, Forecast, Investment Opportunities, Strategy, Insights, Demand, Challenges, Outlook, Trends, Competition, Value, Revenue, Size, Pricing, Analysis, Companies, Restraints, segmentation, Share, Growth
- Bahrain Electric Appliance Rental Market (2026-2032) | Outlook, Size, Competition, Restraints, Drivers, Value, Trends, Investment Opportunities, Insights, Forecast, Revenue, Strategy, Growth, Share, Demand, Analysis, Challenges, Companies, segmentation, Pricing
- Azerbaijan Electric Appliance Rental Market (2026-2032) | Trends, Investment Opportunities, Restraints, Insights, Strategy, Competition, Value, Growth, Demand, Drivers, Analysis, Forecast, Size, Share, Outlook, segmentation, Pricing, Challenges, Revenue, Companies
- Australia Electric Appliance Rental Market (2026-2032) | Challenges, Restraints, Forecast, Demand, Size, Competition, Pricing, Investment Opportunities, Revenue, Trends, Drivers, Growth, Outlook, Analysis, Strategy, Value, segmentation, Insights, Companies, Share
- Argentina Electric Appliance Rental Market (2026-2032) | Growth, Trends, Insights, Outlook, Forecast, Size, Drivers, Analysis, Restraints, Challenges, Share, Revenue, Investment Opportunities, Strategy, Demand, Value, Companies, segmentation, Competition, Pricing
- Algeria Electric Appliance Rental Market (2026-2032) | Share, Size, Value, Strategy, Competition, Outlook, Challenges, Companies, Trends, Pricing, Insights, Forecast, Investment Opportunities, Revenue, Growth, Restraints, segmentation, Analysis, Demand, Drivers
Industry Events and Analyst Meet

HIMTEX 2026

India Refining Summit 2026

India EV Show 2026

EV tech India Expo 2026

Auto Tech Asia 2026
Whitepaper
- Middle East & Africa Commercial Security Market Click here to view more.
- Middle East & Africa Fire Safety Systems & Equipment Market Click here to view more.
- GCC Drone Market Click here to view more.
- Middle East Lighting Fixture Market Click here to view more.
- GCC Physical & Perimeter Security Market Click here to view more.
6WResearch In News
- Doha a strategic location for EV manufacturing hub: IPA Qatar
- Demand for luxury TVs surging in the GCC, says Samsung
- Empowering Growth: The Thriving Journey of Bangladesh’s Cable Industry
- Demand for luxury TVs surging in the GCC, says Samsung
- Video call with a traditional healer? Once unthinkable, it’s now common in South Africa
- Intelligent Buildings To Smooth GCC’s Path To Net Zero