Peru Bioactive Ingredients & Product Market (2026-2032) Outlook | Share, Trends, Value, Size, Forecast, Industry, Companies, Revenue, Growth, Analysis
Market Forecast By Ingredient (Probiotics, Proteins, Plant Extracts, Minerals, Vitamins, Fibers, Carotenoids), By Type (Prebiotics, Probiotics, Amino acids, peptides & proteins, Omega 3 & structured lipids, Phytochemicals & plant extracts, Minerals, Vitamins, Fibers & specialty carbohydrates), By Application (Functional food, Functional beverages, Dietary supplements, Animal nutrition, Personal care) And Competitive Landscape
| Product Code: ETC4600627 | Publication Date: Jul 2023 | Updated Date: Mar 2026 | Product Type: Report | |
| Publisher: 6Wresearch | Author: Ravi Bhandari | No. of Pages: 85 | No. of Figures: 45 | No. of Tables: 25 |
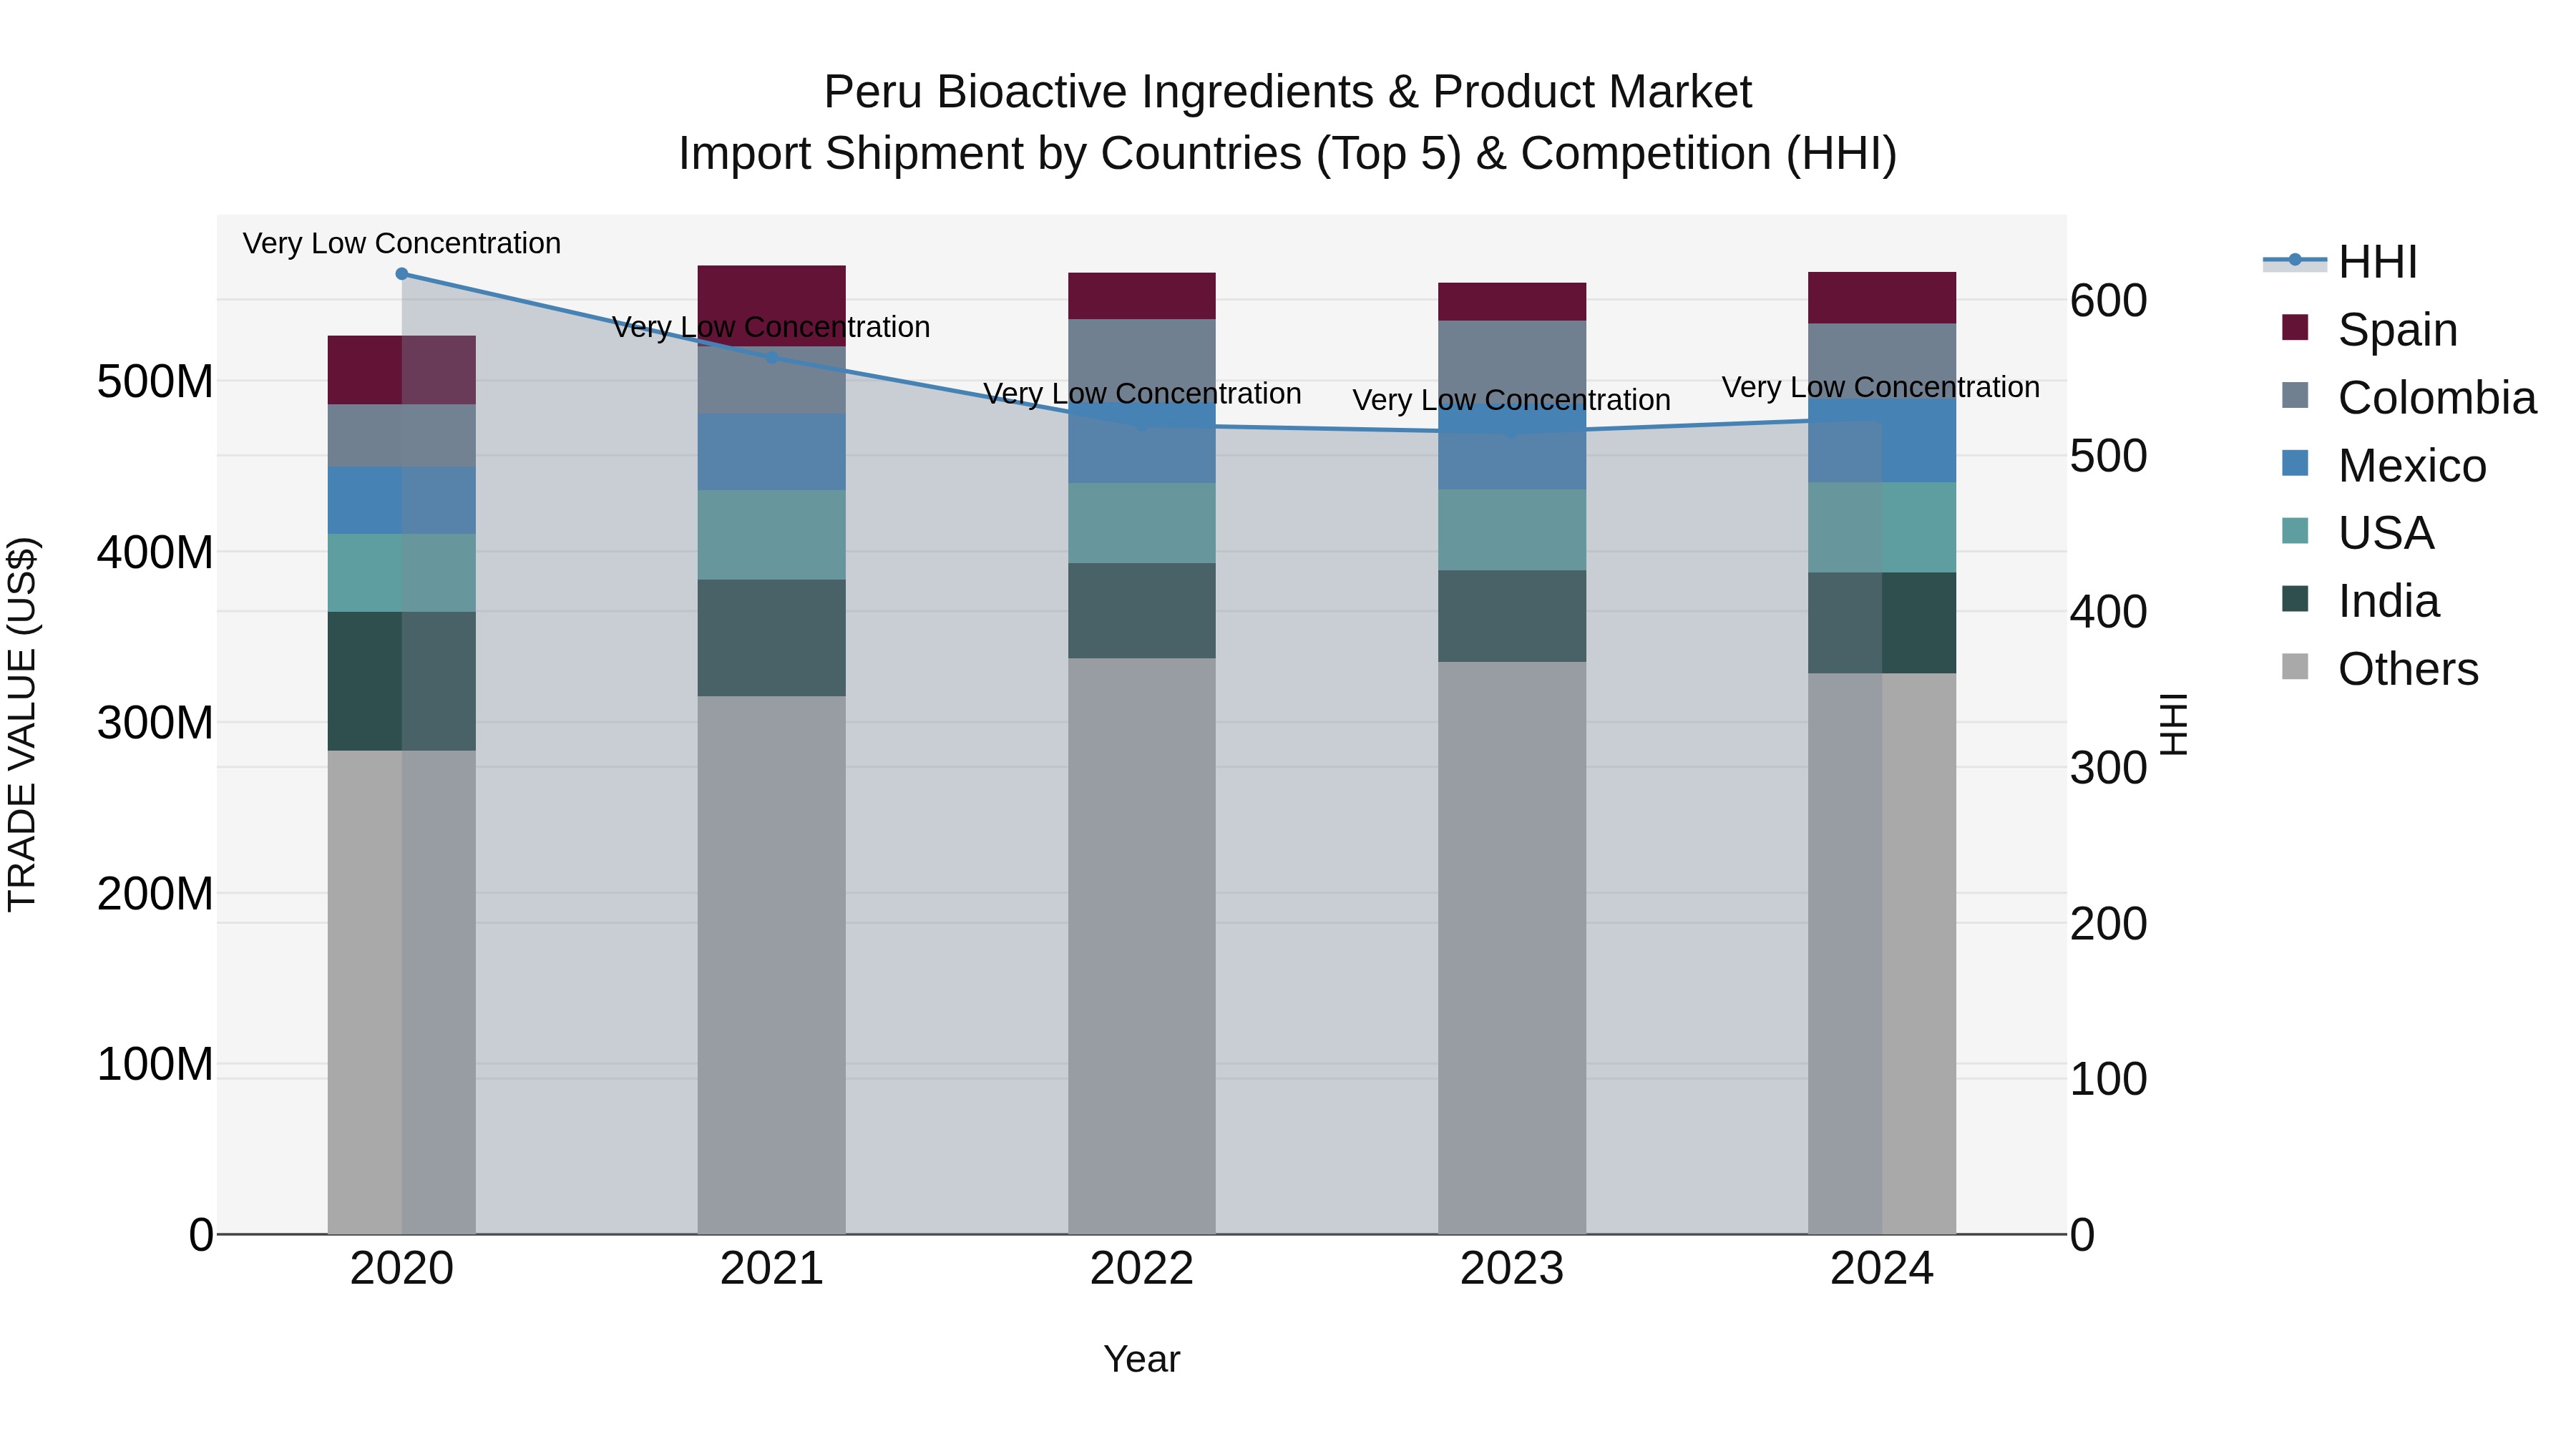
Peru Bioactive Ingredients & Product Market Top 5 Importing Countries and Market Competition (HHI) Analysis
Peru`s import shipments of bioactive ingredients and products show steady growth with a CAGR of 1.72% from 2020 to 2024. In 2024, top exporting countries to Peru include India, USA, Mexico, Colombia, and Spain. The market remains competitive with a low Herfindahl-Hirschman Index (HHI) concentration, indicating a diverse range of suppliers. The growth rate in 2024 increased by 1.08%, reflecting a positive trend in the import market for bioactive ingredients and products in Peru.
Key Highlights of the Report:
- Peru Bioactive Ingredients & Product Market Outlook
- Market Size of Peru Bioactive Ingredients & Product Market, 2025
- Forecast of Peru Bioactive Ingredients & Product Market, 2032
- Historical Data and Forecast of Peru Bioactive Ingredients & Product Revenues & Volume for the Period 2022 - 2032F
- Peru Bioactive Ingredients & Product Market Trend Evolution
- Peru Bioactive Ingredients & Product Market Drivers and Challenges
- Peru Bioactive Ingredients & Product Price Trends
- Peru Bioactive Ingredients & Product Porter's Five Forces
- Peru Bioactive Ingredients & Product Industry Life Cycle
- Historical Data and Forecast of Peru Bioactive Ingredients & Product Market Revenues & Volume By Ingredient for the Period 2022 - 2032F
- Historical Data and Forecast of Peru Bioactive Ingredients & Product Market Revenues & Volume By Probiotics for the Period 2022 - 2032F
- Historical Data and Forecast of Peru Bioactive Ingredients & Product Market Revenues & Volume By Proteins for the Period 2022 - 2032F
- Historical Data and Forecast of Peru Bioactive Ingredients & Product Market Revenues & Volume By Plant Extracts for the Period 2022 - 2032F
- Historical Data and Forecast of Peru Bioactive Ingredients & Product Market Revenues & Volume By Minerals for the Period 2022 - 2032F
- Historical Data and Forecast of Peru Bioactive Ingredients & Product Market Revenues & Volume By Vitamins for the Period 2022 - 2032F
- Historical Data and Forecast of Peru Bioactive Ingredients & Product Market Revenues & Volume By Fibers for the Period 2022 - 2032F
- Historical Data and Forecast of Peru Bioactive Ingredients & Product Market Revenues & Volume By Carotenoids for the Period 2022 - 2032F
- Historical Data and Forecast of Peru Bioactive Ingredients & Product Market Revenues & Volume By Type for the Period 2022 - 2032F
- Historical Data and Forecast of Peru Bioactive Ingredients & Product Market Revenues & Volume By Prebiotics for the Period 2022 - 2032F
- Historical Data and Forecast of Peru Bioactive Ingredients & Product Market Revenues & Volume By Probiotics for the Period 2022 - 2032F
- Historical Data and Forecast of Peru Bioactive Ingredients & Product Market Revenues & Volume By Amino acids, peptides & proteins for the Period 2022 - 2032F
- Historical Data and Forecast of Peru Bioactive Ingredients & Product Market Revenues & Volume By Omega 3 & structured lipids for the Period 2022 - 2032F
- Historical Data and Forecast of Peru Bioactive Ingredients & Product Market Revenues & Volume By Phytochemicals & plant extracts for the Period 2022 - 2032F
- Historical Data and Forecast of Peru Bioactive Ingredients & Product Market Revenues & Volume By Minerals for the Period 2022 - 2032F
- Historical Data and Forecast of Peru Bioactive Ingredients & Product Market Revenues & Volume By Vitamins for the Period 2022 - 2032F
- Historical Data and Forecast of Peru Bioactive Ingredients & Product Market Revenues & Volume By Fibers & specialty carbohydrates for the Period 2022 - 2032F
- Historical Data and Forecast of Peru Bioactive Ingredients & Product Market Revenues & Volume By Application for the Period 2022 - 2032F
- Historical Data and Forecast of Peru Bioactive Ingredients & Product Market Revenues & Volume By Functional food for the Period 2022 - 2032F
- Historical Data and Forecast of Peru Bioactive Ingredients & Product Market Revenues & Volume By Functional beverages for the Period 2022 - 2032F
- Historical Data and Forecast of Peru Bioactive Ingredients & Product Market Revenues & Volume By Dietary supplements for the Period 2022 - 2032F
- Historical Data and Forecast of Peru Bioactive Ingredients & Product Market Revenues & Volume By Animal nutrition for the Period 2022 - 2032F
- Historical Data and Forecast of Peru Bioactive Ingredients & Product Market Revenues & Volume By Personal care for the Period 2022 - 2032F
- Peru Bioactive Ingredients & Product Import Export Trade Statistics
- Market Opportunity Assessment By Ingredient
- Market Opportunity Assessment By Type
- Market Opportunity Assessment By Application
- Peru Bioactive Ingredients & Product Top Companies Market Share
- Peru Bioactive Ingredients & Product Competitive Benchmarking By Technical and Operational Parameters
- Peru Bioactive Ingredients & Product Company Profiles
- Peru Bioactive Ingredients & Product Key Strategic Recommendations
What new business and investment opportunities are available in the Peru bioactive ingredients & product market?
One significant opportunity lies in the increasing consumer demand for natural and organic products, creating a market for companies like Inca Health and Bioandina that offer a range of bioactive ingredients sourced from Peruvian superfoods such as maca, quinoa, and lucuma. Investing in innovative extraction technologies to maximize the bioavailability of these ingredients can also provide a competitive edge in this growing market.
In the Peru bioactive ingredients & product market, key competitors include companies like Naturex, Acatris, and Nutra Green Biotechnology. Naturex is known for its extensive range of natural ingredients sourced from botanicals, while Acatris specializes in innovative bioactive compounds for dietary supplements. Nutra Green Biotechnology stands out for its focus on developing cutting-edge bioactive products derived from plant extracts. These competitors differentiate themselves through unique product offerings, quality standards, and customer relationships, positioning themselves as leaders in the market.
Consumers in the Peru bioactive ingredients market are increasingly seeking natural and organic products, driving the demand for ingredients sourced from native Peruvian plants like maca and quinoa. On the technology front, companies like Inca Health are leveraging innovative extraction processes to preserve the bioactivity of these ingredients. In terms of policies, the Peruvian government is promoting sustainable sourcing practices through initiatives like the National Plan for Biodiversity 2020-2030, which encourages the preservation of the country's rich biodiversity for bioactive ingredient production.
In the Peru bioactive ingredients market, customers are increasingly seeking natural and organic products due to growing awareness about health and wellness. Companies like Agroindustrias Amazonicas are capitalizing on this trend by offering a range of bioactive ingredients sourced from the Amazon rainforest, catering to consumers looking for sustainable and ethically sourced options. Additionally, the preference for functional foods and beverages that offer health benefits beyond basic nutrition is fueling the demand for bioactive ingredients like quinoa extracts, as seen in products from brands such as Quinoa Foods.
In the future, the Peru bioactive ingredients & product market is expected to witness significant growth driven by advancements in technology and research. Companies like Naturex and A&B Ingredients are investing in developing new bioactive ingredients derived from Peruvian superfoods such as maca and quinoa. This trend is likely to continue as consumers increasingly seek natural and functional ingredients in their products. Additionally, collaborations between Peru and other countries, such as the partnership between Peruvian companies and Japanese firms for the development of innovative bioactive extracts, are expected to further drive market expansion.
6Wresearch actively monitors the Peru Bioactive Ingredients & Product Market and publishes its comprehensive annual report, highlighting emerging trends, growth drivers, revenue analysis, and forecast outlook. Our insights help businesses to make data-backed strategic decisions with ongoing market dynamics. Our analysts track relevent industries related to the Peru Bioactive Ingredients & Product Market, allowing our clients with actionable intelligence and reliable forecasts tailored to emerging regional needs.
Yes, we provide customisation as per your requirements. To learn more, feel free to contact us on sales@6wresearch.com
1 Executive Summary |
2 Introduction |
2.1 Key Highlights of the Report |
2.2 Report Description |
2.3 Market Scope & Segmentation |
2.4 Research Methodology |
2.5 Assumptions |
3 Peru Bioactive Ingredients & Product Market Overview |
3.1 Peru Country Macro Economic Indicators |
3.2 Peru Bioactive Ingredients & Product Market Revenues & Volume, 2022 & 2032F |
3.3 Peru Bioactive Ingredients & Product Market - Industry Life Cycle |
3.4 Peru Bioactive Ingredients & Product Market - Porter's Five Forces |
3.5 Peru Bioactive Ingredients & Product Market Revenues & Volume Share, By Ingredient, 2022 & 2032F |
3.6 Peru Bioactive Ingredients & Product Market Revenues & Volume Share, By Type, 2022 & 2032F |
3.7 Peru Bioactive Ingredients & Product Market Revenues & Volume Share, By Application, 2022 & 2032F |
4 Peru Bioactive Ingredients & Product Market Dynamics |
4.1 Impact Analysis |
4.2 Market Drivers |
4.2.1 Growing consumer awareness about health and wellness benefits of bioactive ingredients |
4.2.2 Increasing demand for natural and organic products |
4.2.3 Government initiatives to promote the use of bioactive ingredients in products |
4.3 Market Restraints |
4.3.1 High production costs of bioactive ingredients |
4.3.2 Lack of standardized regulations for bioactive ingredients in Peru |
4.3.3 Limited awareness and education among consumers about bioactive ingredients |
5 Peru Bioactive Ingredients & Product Market Trends |
6 Peru Bioactive Ingredients & Product Market, By Types |
6.1 Peru Bioactive Ingredients & Product Market, By Ingredient |
6.1.1 Overview and Analysis |
6.1.2 Peru Bioactive Ingredients & Product Market Revenues & Volume, By Ingredient, 2022 - 2032F |
6.1.3 Peru Bioactive Ingredients & Product Market Revenues & Volume, By Probiotics, 2022 - 2032F |
6.1.4 Peru Bioactive Ingredients & Product Market Revenues & Volume, By Proteins, 2022 - 2032F |
6.1.5 Peru Bioactive Ingredients & Product Market Revenues & Volume, By Plant Extracts, 2022 - 2032F |
6.1.6 Peru Bioactive Ingredients & Product Market Revenues & Volume, By Minerals, 2022 - 2032F |
6.1.7 Peru Bioactive Ingredients & Product Market Revenues & Volume, By Vitamins, 2022 - 2032F |
6.1.8 Peru Bioactive Ingredients & Product Market Revenues & Volume, By Fibers, 2022 - 2032F |
6.2 Peru Bioactive Ingredients & Product Market, By Type |
6.2.1 Overview and Analysis |
6.2.2 Peru Bioactive Ingredients & Product Market Revenues & Volume, By Prebiotics, 2022 - 2032F |
6.2.3 Peru Bioactive Ingredients & Product Market Revenues & Volume, By Probiotics, 2022 - 2032F |
6.2.4 Peru Bioactive Ingredients & Product Market Revenues & Volume, By Amino acids, peptides & proteins, 2022 - 2032F |
6.2.5 Peru Bioactive Ingredients & Product Market Revenues & Volume, By Omega 3 & structured lipids, 2022 - 2032F |
6.2.6 Peru Bioactive Ingredients & Product Market Revenues & Volume, By Phytochemicals & plant extracts, 2022 - 2032F |
6.2.7 Peru Bioactive Ingredients & Product Market Revenues & Volume, By Minerals, 2022 - 2032F |
6.2.8 Peru Bioactive Ingredients & Product Market Revenues & Volume, By Fibers & specialty carbohydrates, 2022 - 2032F |
6.2.9 Peru Bioactive Ingredients & Product Market Revenues & Volume, By Fibers & specialty carbohydrates, 2022 - 2032F |
6.3 Peru Bioactive Ingredients & Product Market, By Application |
6.3.1 Overview and Analysis |
6.3.2 Peru Bioactive Ingredients & Product Market Revenues & Volume, By Functional food, 2022 - 2032F |
6.3.3 Peru Bioactive Ingredients & Product Market Revenues & Volume, By Functional beverages, 2022 - 2032F |
6.3.4 Peru Bioactive Ingredients & Product Market Revenues & Volume, By Dietary supplements, 2022 - 2032F |
6.3.5 Peru Bioactive Ingredients & Product Market Revenues & Volume, By Animal nutrition, 2022 - 2032F |
6.3.6 Peru Bioactive Ingredients & Product Market Revenues & Volume, By Personal care, 2022 - 2032F |
7 Peru Bioactive Ingredients & Product Market Import-Export Trade Statistics |
7.1 Peru Bioactive Ingredients & Product Market Export to Major Countries |
7.2 Peru Bioactive Ingredients & Product Market Imports from Major Countries |
8 Peru Bioactive Ingredients & Product Market Key Performance Indicators |
8.1 Number of research studies conducted on bioactive ingredients in Peru |
8.2 Percentage of new product launches containing bioactive ingredients |
8.3 Consumer awareness and perception surveys on bioactive ingredients |
9 Peru Bioactive Ingredients & Product Market - Opportunity Assessment |
9.1 Peru Bioactive Ingredients & Product Market Opportunity Assessment, By Ingredient, 2022 & 2032F |
9.2 Peru Bioactive Ingredients & Product Market Opportunity Assessment, By Type, 2022 & 2032F |
9.3 Peru Bioactive Ingredients & Product Market Opportunity Assessment, By Application, 2022 & 2032F |
10 Peru Bioactive Ingredients & Product Market - Competitive Landscape |
10.1 Peru Bioactive Ingredients & Product Market Revenue Share, By Companies, 2025 |
10.2 Peru Bioactive Ingredients & Product Market Competitive Benchmarking, By Operating and Technical Parameters |
11 Company Profiles |
12 Recommendations |
13 Disclaimer |
Global Go To Market Strategy - 2030
Export potential enables firms to identify high-growth global markets with greater confidence by combining advanced trade intelligence with a structured quantitative methodology. The framework analyzes emerging demand trends and country-level import patterns while integrating macroeconomic and trade datasets such as GDP and population forecasts, bilateral import–export flows, tariff structures, elasticity differentials between developed and developing economies, geographic distance, and import demand projections. Using weighted trade values from 2020–2024 as the base period to project country-to-country export potential for 2030, these inputs are operationalized through calculated drivers such as gravity model parameters, tariff impact factors, and projected GDP per-capita growth. Through an analysis of hidden potentials, demand hotspots, and market conditions that are most favorable to success, this method enables firms to focus on target countries, maximize returns, and global expansion with data, backed by accuracy.
By factoring in the projected importer demand gap that is currently unmet and could be potential opportunity, it identifies the potential for the Exporter (Country) among 190 countries, against the general trade analysis, which identifies the biggest importer or exporter.
To discover high-growth global markets and optimize your business strategy:
Click Here
Pricing
- Single User License$ 1,995
- Department License$ 2,400
- Site License$ 3,120
- Global License$ 3,795

Leadership Perspectives from Industry Events
Search
Thought Leadership and Analyst Meet


Our Clients
6WResearch In News
- India Export Attractiveness Tracker 2026
- India Air Conditioner Market Set for Strong Rebound in 2026 After Weather-Led Correction and GST-Driven Recovery: 6Wresearch
- ADAS in India: How Automatic Emergency Braking, Blind Spot Detection & Driver Monitoring are Transforming Road Safety
- Doha a strategic location for EV manufacturing hub: IPA Qatar
- Demand for luxury TVs surging in the GCC, says Samsung
- Empowering Growth: The Thriving Journey of Bangladesh’s Cable Industry
Latest Reports
- Nicaragua RPG Gaming Market (2026-2032)
- New Zealand RPG Gaming Market (2026-2032)
- Netherlands RPG Gaming Market (2026-2032)
- Nauru RPG Gaming Market (2026-2032)
- Namibia RPG Gaming Market (2026-2032)
- Mozambique RPG Gaming Market (2026-2032)
- Montenegro RPG Gaming Market (2026-2032)
- Mongolia RPG Gaming Market (2026-2032)
- Monaco RPG Gaming Market (2026-2032)
- Micronesia RPG Gaming Market (2026-2032)
Industry Events and Analyst Meet

EV India Expo 2026

HIMTEX 2026

India Refining Summit 2026

India EV Show 2026

EV tech India Expo 2026
Whitepaper
- Middle East & Africa Commercial Security Market Click here to view more.
- Middle East & Africa Fire Safety Systems & Equipment Market Click here to view more.
- GCC Drone Market Click here to view more.
- Middle East Lighting Fixture Market Click here to view more.
- GCC Physical & Perimeter Security Market Click here to view more.