Peru Pantothenic Acid Market (2026-2032) Outlook | Companies, Share, Size, Revenue, Forecast, Value, Industry, Trends, Growth & Analysis
Market Forecast By Form (Powder, Tablets), By End Use (Pharmaceuticals, Nutritional &dietary Supplements, Animal Health & Nutrition, Infant Food & Supplements, Food & Beverages), By Source (Plants, Animals, Dairy Products), By Nature (Organic And , Inorganic) And Competitive Landscape
| Product Code: ETC337086 | Publication Date: Aug 2022 | Updated Date: Jul 2026 | Product Type: Market Research Report | |
| Publisher: 6Wresearch | Author: Shubham Padhi | No. of Pages: 75 | No. of Figures: 35 | No. of Tables: 20 |
Peru Pantothenic Acid Market Size, Share & Growth Rate
The Peru Pantothenic Acid Market was estimated at USD 234 Million in 2025 and is projected to reach USD 310 Million by 2032, growing at a CAGR of 4.1% from 2026 to 2032. This growth trajectory is primarily driven by a rising consumer focus on health and wellness, particularly regarding the importance of essential nutrients like Vitamin B5. Increased demand from sectors such as dietary supplements and functional foods indicates a robust market response to health-conscious trends among Peruvians.
Peru Pantothenic Acid Market Year-wise Growth Rate and Key Drivers
This graph highlights how the Peru Pantothenic Acid Market has steadily grown over the years, supported by major growth factors.
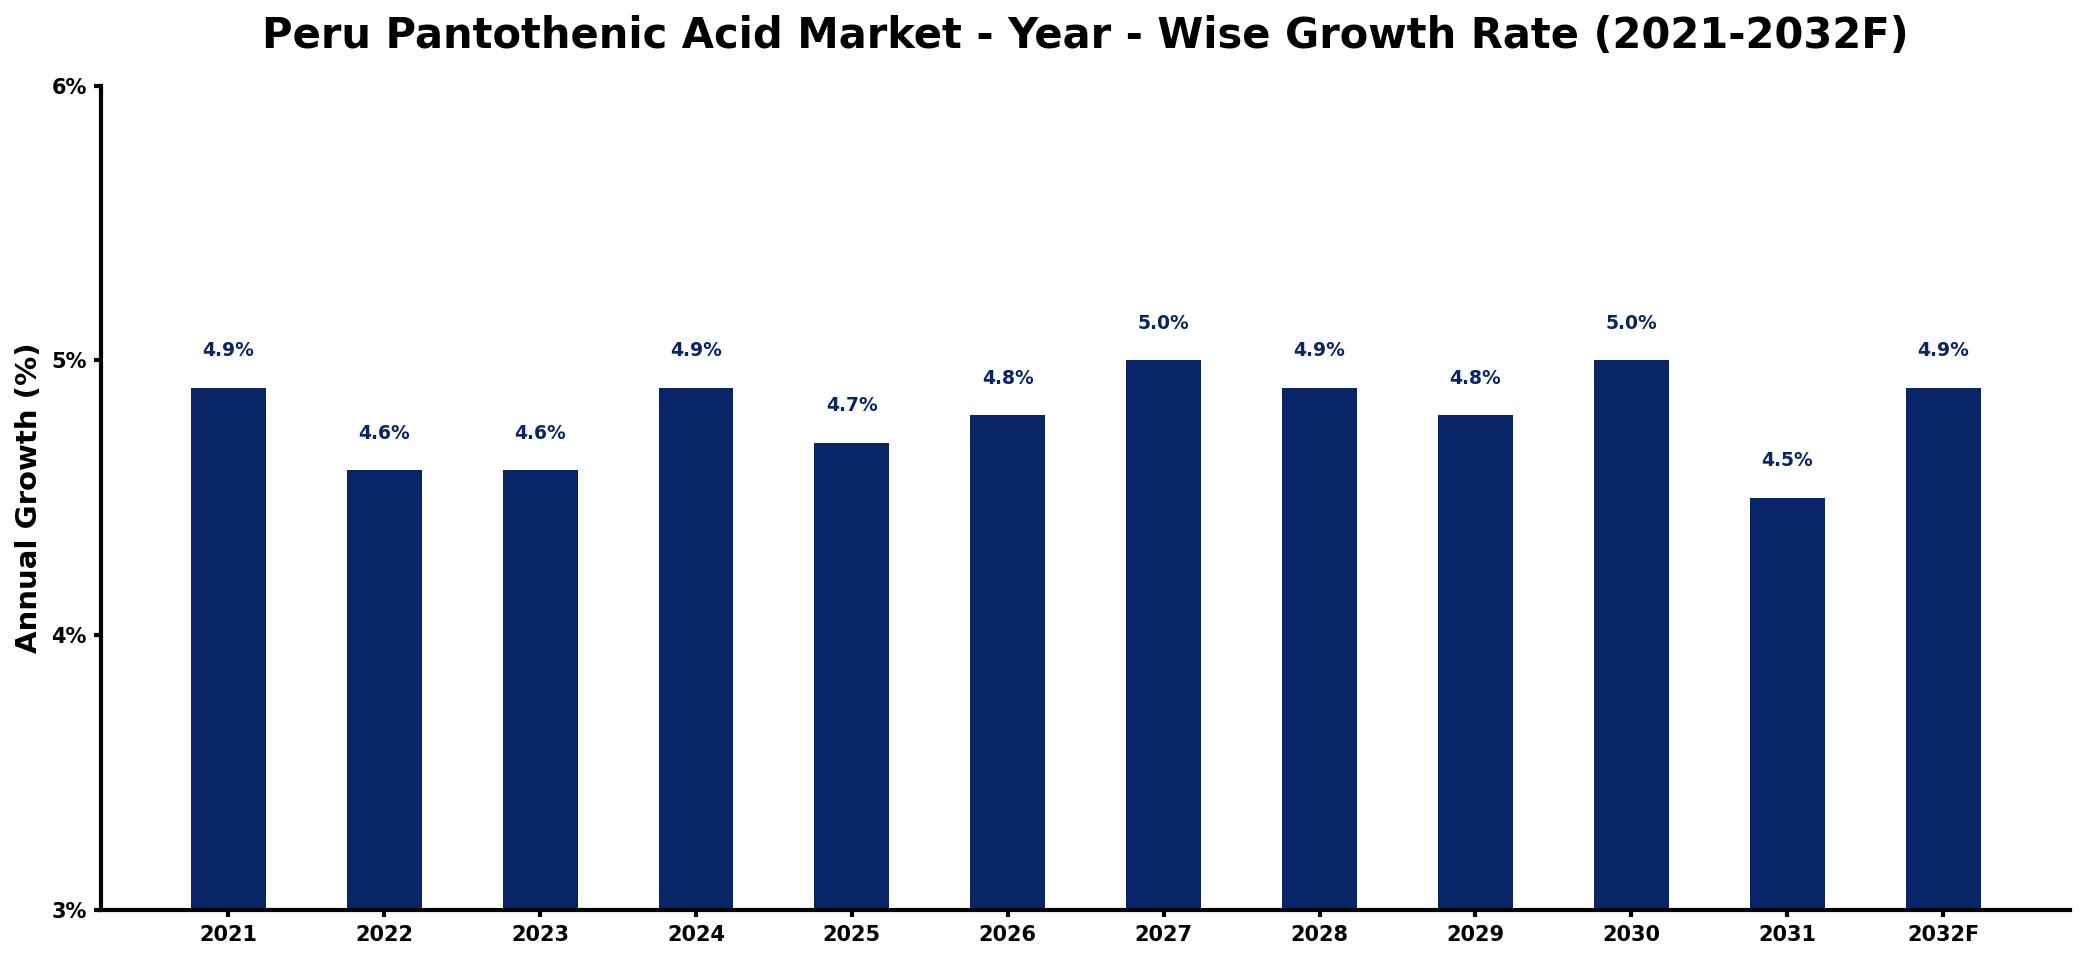
The table below presents the year‑wise growth rates along with the key drivers influencing the market
| Year | Growth Rate | Major Drivers |
| 2021 | 4.9% | Rising health awareness among consumers |
| 2022 | 4.6% | Increased demand for dietary supplements |
| 2023 | 4.6% | Expansion of online retail platforms |
| 2024 | 4.9% | Growth in functional food market |
| 2025 | 4.7% | Investment in health and wellness |
| 2026 | 4.8% | Rising popularity of natural ingredients |
| 2027 | 5.0% | Advancements in nutritional research |
| 2028 | 4.9% | Increase in preventive healthcare spending |
| 2029 | 4.8% | Growth of organic product offerings |
| 2030 | 5.0% | Emergence of new health trends |
| 2031 | 4.5% | Diversification of product formulations |
| 2032 | 4.9% | Strengthening of distribution networks |
Note: Market size estimations and growth projections presented in this report are based on 6Wresearch's proprietary forecasting methodology, utilizing the latest available industry data, government publications, and primary research inputs.
Peru Pantothenic Acid Market Synopsis
Recent years have seen a significant uptick in the awareness of pantothenic acids health benefits, marking a notable shift towards preventative health in Peru. As the market evolves, it is poised for further growth, especially as consumers integrate pantothenic acid into their daily health regimens.
The landscape is characterized by innovation and strategic partnerships, enabling companies to align their products with the growing demands of the pharmaceutical and food industries. The ongoing rise in health consciousness underscores a promising future for the Peru Pantothenic Acid market.
Peru Pantothenic Acid Market Key Takeaways
- The market is driven by increasing consumer awareness of pantothenic acids role in energy metabolism and overall health.
- Strong demand from both the pharmaceutical and food sectors is fostering market growth.
- Product innovation and strategic collaborations are crucial for tapping into the expanding consumer base.
- Government initiatives supporting health and wellness are positively influencing market dynamics.
- Opportunities for investment in supplements and fortified foods are growing, particularly within the beauty sector.
Evaluation of Restraints in Peru Pantothenic Acid Market
Despite the market's positive outlook, several limitations hinder its full potential. A significant barrier is the limited consumer knowledge regarding the specific benefits of pantothenic acid, which affects overall demand. Moreover, competition from alternative vitamin supplements presents challenges in market differentiation. Economic fluctuations also influence consumer spending, potentially impacting the purchasing of supplements. Lastly, regulatory hurdles and inconsistent quality standards complicate the landscape, necessitating strategic responses from market participants to overcome these challenges effectively.
Peru Pantothenic Acid Market Trends
The growing trend towards holistic health and wellness is driving increased consumption of pantothenic acid. Consumers are increasingly turning to dietary supplements to support energy production and manage lifestyle-related health issues. Additionally, the beauty and skincare industries are incorporating pantothenic acid into their products, enhancing the vitamin's appeal among consumers seeking effective solutions for skin health. As these trends continue to evolve, the market can expect sustained interest and innovation in formulations.
Peru Pantothenic Acid Market Opportunities
Investment opportunities abound in the Peru Pantothenic Acid market, primarily due to the escalating demand for health-enhancing products. The beauty industry presents a particularly lucrative segment, with pantothenic acid's potential to improve skin health driving innovation in cosmetics. Collaborating with local manufacturers to develop tailored products can yield significant advantages. Furthermore, targeting both the dietary supplement sector and fortified foods offers dual avenues for growth, as the populace increasingly seeks accessible health solutions.
Government Initiatives in the Peru Pantothenic Acid Market
The Peruvian government is actively promoting policies aimed at enhancing product safety and quality within the pantothenic acid market. Regulatory agencies oversee the production and distribution processes, ensuring compliance with international standards. Additionally, initiatives to boost domestic manufacturing are in place, encouraging local firms to innovate while adhering to stringent safety protocols. Such policies not only protect consumer health but also foster a competitive market environment that enhances overall industry growth.
Future Insights of the Peru Pantothenic Acid Market
Looking ahead to 2026-2032, the Peru Pantothenic Acid market is expected to maintain its upward trajectory. The growing emphasis on preventative health strategies and wellness is likely to drive further adoption of pantothenic acid in everyday dietary practices. As consumer preferences shift towards natural and fortified food products, the potential for market expansion remains strong. The ongoing integration of pantothenic acid within cosmetics and pharmaceuticals signals a dynamic landscape ripe for innovation and investment.
Peru Pantothenic Acid Market Latest Developments (2025 - 2026)
In recent months, the Peru Pantothenic Acid market has witnessed a surge in product launches, particularly within the dietary supplement and skincare sectors. Manufacturers are increasingly leveraging marketing campaigns to educate consumers about the benefits of pantothenic acid. Furthermore, collaborative efforts among industry stakeholders aim to enhance distribution channels, addressing logistical challenges and improving accessibility across various regions in Peru. This momentum is indicative of an agile market responding to evolving consumer demands.
Peru Pantothenic Acid Market - Key Attractiveness of the Report
- 10 Years of Market Numbers
- Historical Data Starting from 2022 to 2025
- Base Year: 2025
- Forecast Data until 2032
- Key Performance Indicators Impacting the Market
- Major Upcoming Developments and Projects
Key Highlights of the Report:
- Peru Pantothenic Acid Market Outlook
- Market Size of Peru Pantothenic Acid Market, 2025
- Forecast of Peru Pantothenic Acid Market, 2032
- Historical Data and Forecast of Peru Pantothenic Acid Revenues & Volume for the Period 2022-2032F
- Peru Pantothenic Acid Market Trend Evolution
- Peru Pantothenic Acid Market Drivers and Challenges
- Peru Pantothenic Acid Price Trends
- Peru Pantothenic Acid Porter's Five Forces
- Peru Pantothenic Acid Industry Life Cycle
- Historical Data and Forecast of Peru Pantothenic Acid Market Revenues & Volume By Form for the Period 2022-2032F
- Historical Data and Forecast of Peru Pantothenic Acid Market Revenues & Volume By Powder for the Period 2022-2032F
- Historical Data and Forecast of Peru Pantothenic Acid Market Revenues & Volume By Tablets for the Period 2022-2032F
- Historical Data and Forecast of Peru Pantothenic Acid Market Revenues & Volume By End Use for the Period 2022-2032F
- Historical Data and Forecast of Peru Pantothenic Acid Market Revenues & Volume By Pharmaceuticals for the Period 2022-2032F
- Historical Data and Forecast of Peru Pantothenic Acid Market Revenues & Volume By Nutritional &dietary Supplements for the Period 2022-2032F
- Historical Data and Forecast of Peru Pantothenic Acid Market Revenues & Volume By Animal Health & Nutrition for the Period 2022-2032F
- Historical Data and Forecast of Peru Pantothenic Acid Market Revenues & Volume By Infant Food & Supplements for the Period 2022-2032F
- Historical Data and Forecast of Peru Pantothenic Acid Market Revenues & Volume By Food & Beverages for the Period 2022-2032F
- Historical Data and Forecast of Peru Pantothenic Acid Market Revenues & Volume By Source for the Period 2022-2032F
- Historical Data and Forecast of Peru Pantothenic Acid Market Revenues & Volume By Plants for the Period 2022-2032F
- Historical Data and Forecast of Peru Pantothenic Acid Market Revenues & Volume By Animals for the Period 2022-2032F
- Historical Data and Forecast of Peru Pantothenic Acid Market Revenues & Volume By Dairy Products for the Period 2022-2032F
- Historical Data and Forecast of Peru Pantothenic Acid Market Revenues & Volume By Nature for the Period 2022-2032F
- Historical Data and Forecast of Peru Pantothenic Acid Market Revenues & Volume By Organic And for the Period 2022-2032F
- Historical Data and Forecast of Peru Pantothenic Acid Market Revenues & Volume By Inorganic for the Period 2022-2032F
- Peru Pantothenic Acid Import Export Trade Statistics
- Market Opportunity Assessment By Form
- Market Opportunity Assessment By End Use
- Market Opportunity Assessment By Source
- Market Opportunity Assessment By Nature
- Peru Pantothenic Acid Top Companies Market Share
- Peru Pantothenic Acid Competitive Benchmarking By Technical and Operational Parameters
- Peru Pantothenic Acid Company Profiles
- Peru Pantothenic Acid Key Strategic Recommendations
Frequently Asked Questions About the Market Study (FAQs):
The growth is primarily driven by increasing consumer awareness of the health benefits of pantothenic acid, particularly in energy production and skin health, alongside rising demands in the pharmaceutical and food sectors.
The Peru Pantothenic Acid market was estimated at USD 234 Million in 2025 and is projected to reach USD 310 Million by 2032, growing at a CAGR of 4.1% from 2026 to 2032. This reflects strong consumer demand and industry responsiveness.
Demand is predominantly driven by the pharmaceutical and food industries, with increasing interest from the beauty sector enhancing the market's growth potential.
Yes, challenges include limited consumer knowledge, competition from other supplements, and economic fluctuations that may impact consumer spending habits.
The Peruvian government promotes safety and quality in the market through regulatory oversight, encouraging local manufacturing and adherence to international standards to protect consumer welfare.
There is a notable trend towards incorporating pantothenic acid in dietary supplements, skincare, and functional foods, driven by increasing consumer interest in holistic health and wellness.
6Wresearch actively monitors the Peru Pantothenic Acid Market and publishes its comprehensive annual report, highlighting emerging trends, growth drivers, revenue analysis, and forecast outlook. Our insights help businesses to make data-backed strategic decisions with ongoing market dynamics. Our analysts track relevent industries related to the Peru Pantothenic Acid Market, allowing our clients with actionable intelligence and reliable forecasts tailored to emerging regional needs.
Yes, we provide customisation as per your requirements. To learn more, feel free to contact us on sales@6wresearch.com
1 Executive Summary |
2 Introduction |
2.1 Key Highlights of the Report |
2.2 Report Description |
2.3 Market Scope & Segmentation |
2.4 Research Methodology |
2.5 Assumptions |
3 Peru Pantothenic Acid Market Overview |
3.1 Peru Country Macro Economic Indicators |
3.2 Peru Pantothenic Acid Market Revenues & Volume, 2022 & 2032F |
3.3 Peru Pantothenic Acid Market - Industry Life Cycle |
3.4 Peru Pantothenic Acid Market - Porter's Five Forces |
3.5 Peru Pantothenic Acid Market Revenues & Volume Share, By Form, 2022 & 2032F |
3.6 Peru Pantothenic Acid Market Revenues & Volume Share, By End Use, 2022 & 2032F |
3.7 Peru Pantothenic Acid Market Revenues & Volume Share, By Source , 2022 & 2032F |
3.8 Peru Pantothenic Acid Market Revenues & Volume Share, By Nature, 2022 & 2032F |
4 Peru Pantothenic Acid Market Dynamics |
4.1 Impact Analysis |
4.2 Market Drivers |
4.2.1 Increasing awareness about the health benefits of pantothenic acid |
4.2.2 Growing demand for dietary supplements and fortified food products |
4.2.3 Rise in disposable income leading to higher spending on health and wellness products |
4.3 Market Restraints |
4.3.1 Fluctuating raw material prices affecting production costs |
4.3.2 Stringent regulations and quality standards in the health supplement industry |
4.3.3 Competition from alternative sources of vitamins and supplements |
5 Peru Pantothenic Acid Market Trends |
6 Peru Pantothenic Acid Market, By Types |
6.1 Peru Pantothenic Acid Market, By Form |
6.1.1 Overview and Analysis |
6.1.2 Peru Pantothenic Acid Market Revenues & Volume, By Form, 2022-2032F |
6.1.3 Peru Pantothenic Acid Market Revenues & Volume, By Powder, 2022-2032F |
6.1.4 Peru Pantothenic Acid Market Revenues & Volume, By Tablets, 2022-2032F |
6.2 Peru Pantothenic Acid Market, By End Use |
6.2.1 Overview and Analysis |
6.2.2 Peru Pantothenic Acid Market Revenues & Volume, By Pharmaceuticals, 2022-2032F |
6.2.3 Peru Pantothenic Acid Market Revenues & Volume, By Nutritional &dietary Supplements, 2022-2032F |
6.2.4 Peru Pantothenic Acid Market Revenues & Volume, By Animal Health & Nutrition, 2022-2032F |
6.2.5 Peru Pantothenic Acid Market Revenues & Volume, By Infant Food & Supplements, 2022-2032F |
6.2.6 Peru Pantothenic Acid Market Revenues & Volume, By Food & Beverages, 2022-2032F |
6.3 Peru Pantothenic Acid Market, By Source |
6.3.1 Overview and Analysis |
6.3.2 Peru Pantothenic Acid Market Revenues & Volume, By Plants, 2022-2032F |
6.3.3 Peru Pantothenic Acid Market Revenues & Volume, By Animals, 2022-2032F |
6.3.4 Peru Pantothenic Acid Market Revenues & Volume, By Dairy Products, 2022-2032F |
6.4 Peru Pantothenic Acid Market, By Nature |
6.4.1 Overview and Analysis |
6.4.2 Peru Pantothenic Acid Market Revenues & Volume, By Organic And , 2022-2032F |
6.4.3 Peru Pantothenic Acid Market Revenues & Volume, By Inorganic, 2022-2032F |
7 Peru Pantothenic Acid Market Import-Export Trade Statistics |
7.1 Peru Pantothenic Acid Market Export to Major Countries |
7.2 Peru Pantothenic Acid Market Imports from Major Countries |
8 Peru Pantothenic Acid Market Key Performance Indicators |
8.1 Number of new product launches containing pantothenic acid in Peru |
8.2 Consumer awareness levels regarding pantothenic acid benefits |
8.3 Growth in the number of health and wellness stores stocking pantothenic acid products |
9 Peru Pantothenic Acid Market - Opportunity Assessment |
9.1 Peru Pantothenic Acid Market Opportunity Assessment, By Form, 2022 & 2032F |
9.2 Peru Pantothenic Acid Market Opportunity Assessment, By End Use, 2022 & 2032F |
9.3 Peru Pantothenic Acid Market Opportunity Assessment, By Source , 2022 & 2032F |
9.4 Peru Pantothenic Acid Market Opportunity Assessment, By Nature, 2022 & 2032F |
10 Peru Pantothenic Acid Market - Competitive Landscape |
10.1 Peru Pantothenic Acid Market Revenue Share, By Companies, 2025 |
10.2 Peru Pantothenic Acid Market Competitive Benchmarking, By Operating and Technical Parameters |
11 Company Profiles |
12 Recommendations |
13 Disclaimer |
Global Go To Market Strategy - 2030
Export potential enables firms to identify high-growth global markets with greater confidence by combining advanced trade intelligence with a structured quantitative methodology. The framework analyzes emerging demand trends and country-level import patterns while integrating macroeconomic and trade datasets such as GDP and population forecasts, bilateral import–export flows, tariff structures, elasticity differentials between developed and developing economies, geographic distance, and import demand projections. Using weighted trade values from 2020–2024 as the base period to project country-to-country export potential for 2030, these inputs are operationalized through calculated drivers such as gravity model parameters, tariff impact factors, and projected GDP per-capita growth. Through an analysis of hidden potentials, demand hotspots, and market conditions that are most favorable to success, this method enables firms to focus on target countries, maximize returns, and global expansion with data, backed by accuracy.
By factoring in the projected importer demand gap that is currently unmet and could be potential opportunity, it identifies the potential for the Exporter (Country) among 190 countries, against the general trade analysis, which identifies the biggest importer or exporter.
To discover high-growth global markets and optimize your business strategy:
Click Here
Pricing
- Single User License$ 1,995
- Department License$ 2,400
- Site License$ 3,120
- Global License$ 3,795

Leadership Perspectives from Industry Events
Search
Thought Leadership and Analyst Meet


Our Clients
6WResearch In News
- India Air Conditioner Market Set for Strong Rebound in 2026 After Weather-Led Correction and GST-Driven Recovery: 6Wresearch
- ADAS in India: How Automatic Emergency Braking, Blind Spot Detection & Driver Monitoring are Transforming Road Safety
- Doha a strategic location for EV manufacturing hub: IPA Qatar
- Demand for luxury TVs surging in the GCC, says Samsung
- Empowering Growth: The Thriving Journey of Bangladesh’s Cable Industry
- Demand for luxury TVs surging in the GCC, says Samsung
Latest Reports
- Nicaragua RPG Gaming Market (2026-2032)
- New Zealand RPG Gaming Market (2026-2032)
- Netherlands RPG Gaming Market (2026-2032)
- Nauru RPG Gaming Market (2026-2032)
- Namibia RPG Gaming Market (2026-2032)
- Mozambique RPG Gaming Market (2026-2032)
- Montenegro RPG Gaming Market (2026-2032)
- Mongolia RPG Gaming Market (2026-2032)
- Monaco RPG Gaming Market (2026-2032)
- Micronesia RPG Gaming Market (2026-2032)
Industry Events and Analyst Meet

EV India Expo 2026

HIMTEX 2026

India Refining Summit 2026

India EV Show 2026

EV tech India Expo 2026
Whitepaper
- Middle East & Africa Commercial Security Market Click here to view more.
- Middle East & Africa Fire Safety Systems & Equipment Market Click here to view more.
- GCC Drone Market Click here to view more.
- Middle East Lighting Fixture Market Click here to view more.
- GCC Physical & Perimeter Security Market Click here to view more.