Peru Personal Care Cosmetic Ingredients Market (2026-2032) | Revenue, Share, Demand, Consumer Insights, Outlook, Competitive, Strategic Insights, Drivers, Investment Trends, Opportunities, Industry, Segmentation, Challenges, Pricing Analysis, Strategy, Analysis, Trends, Supply, Companies, Value, Restraints, Segments, Growth, Competition, Size, Forecast
Market Forecast By Ingredient Type (Emollients, Surfactants, Preservatives, UV Filters, Antioxidants), By Function (Skin Moisturization, Cleansing, Anti-Bacterial, Sun Protection, Anti-Aging), By Product Application (Face Creams, Body Washes, Deodorants, Sunscreens, Serums), By Consumer Preference (Organic, Vegan, Paraben-Free, Natural, Hypoallergenic), By Regulatory Approval (FDA Approved, EU Compliant, ECOCERT Certified, Dermatologist Recommended, ISO Certified) And Competitive Landscape
| Product Code: ETC10775712 | Publication Date: Apr 2025 | Updated Date: Apr 2026 | Product Type: Market Research Report | |
| Publisher: 6Wresearch | No. of Pages: 65 | No. of Figures: 34 | No. of Tables: 19 | |
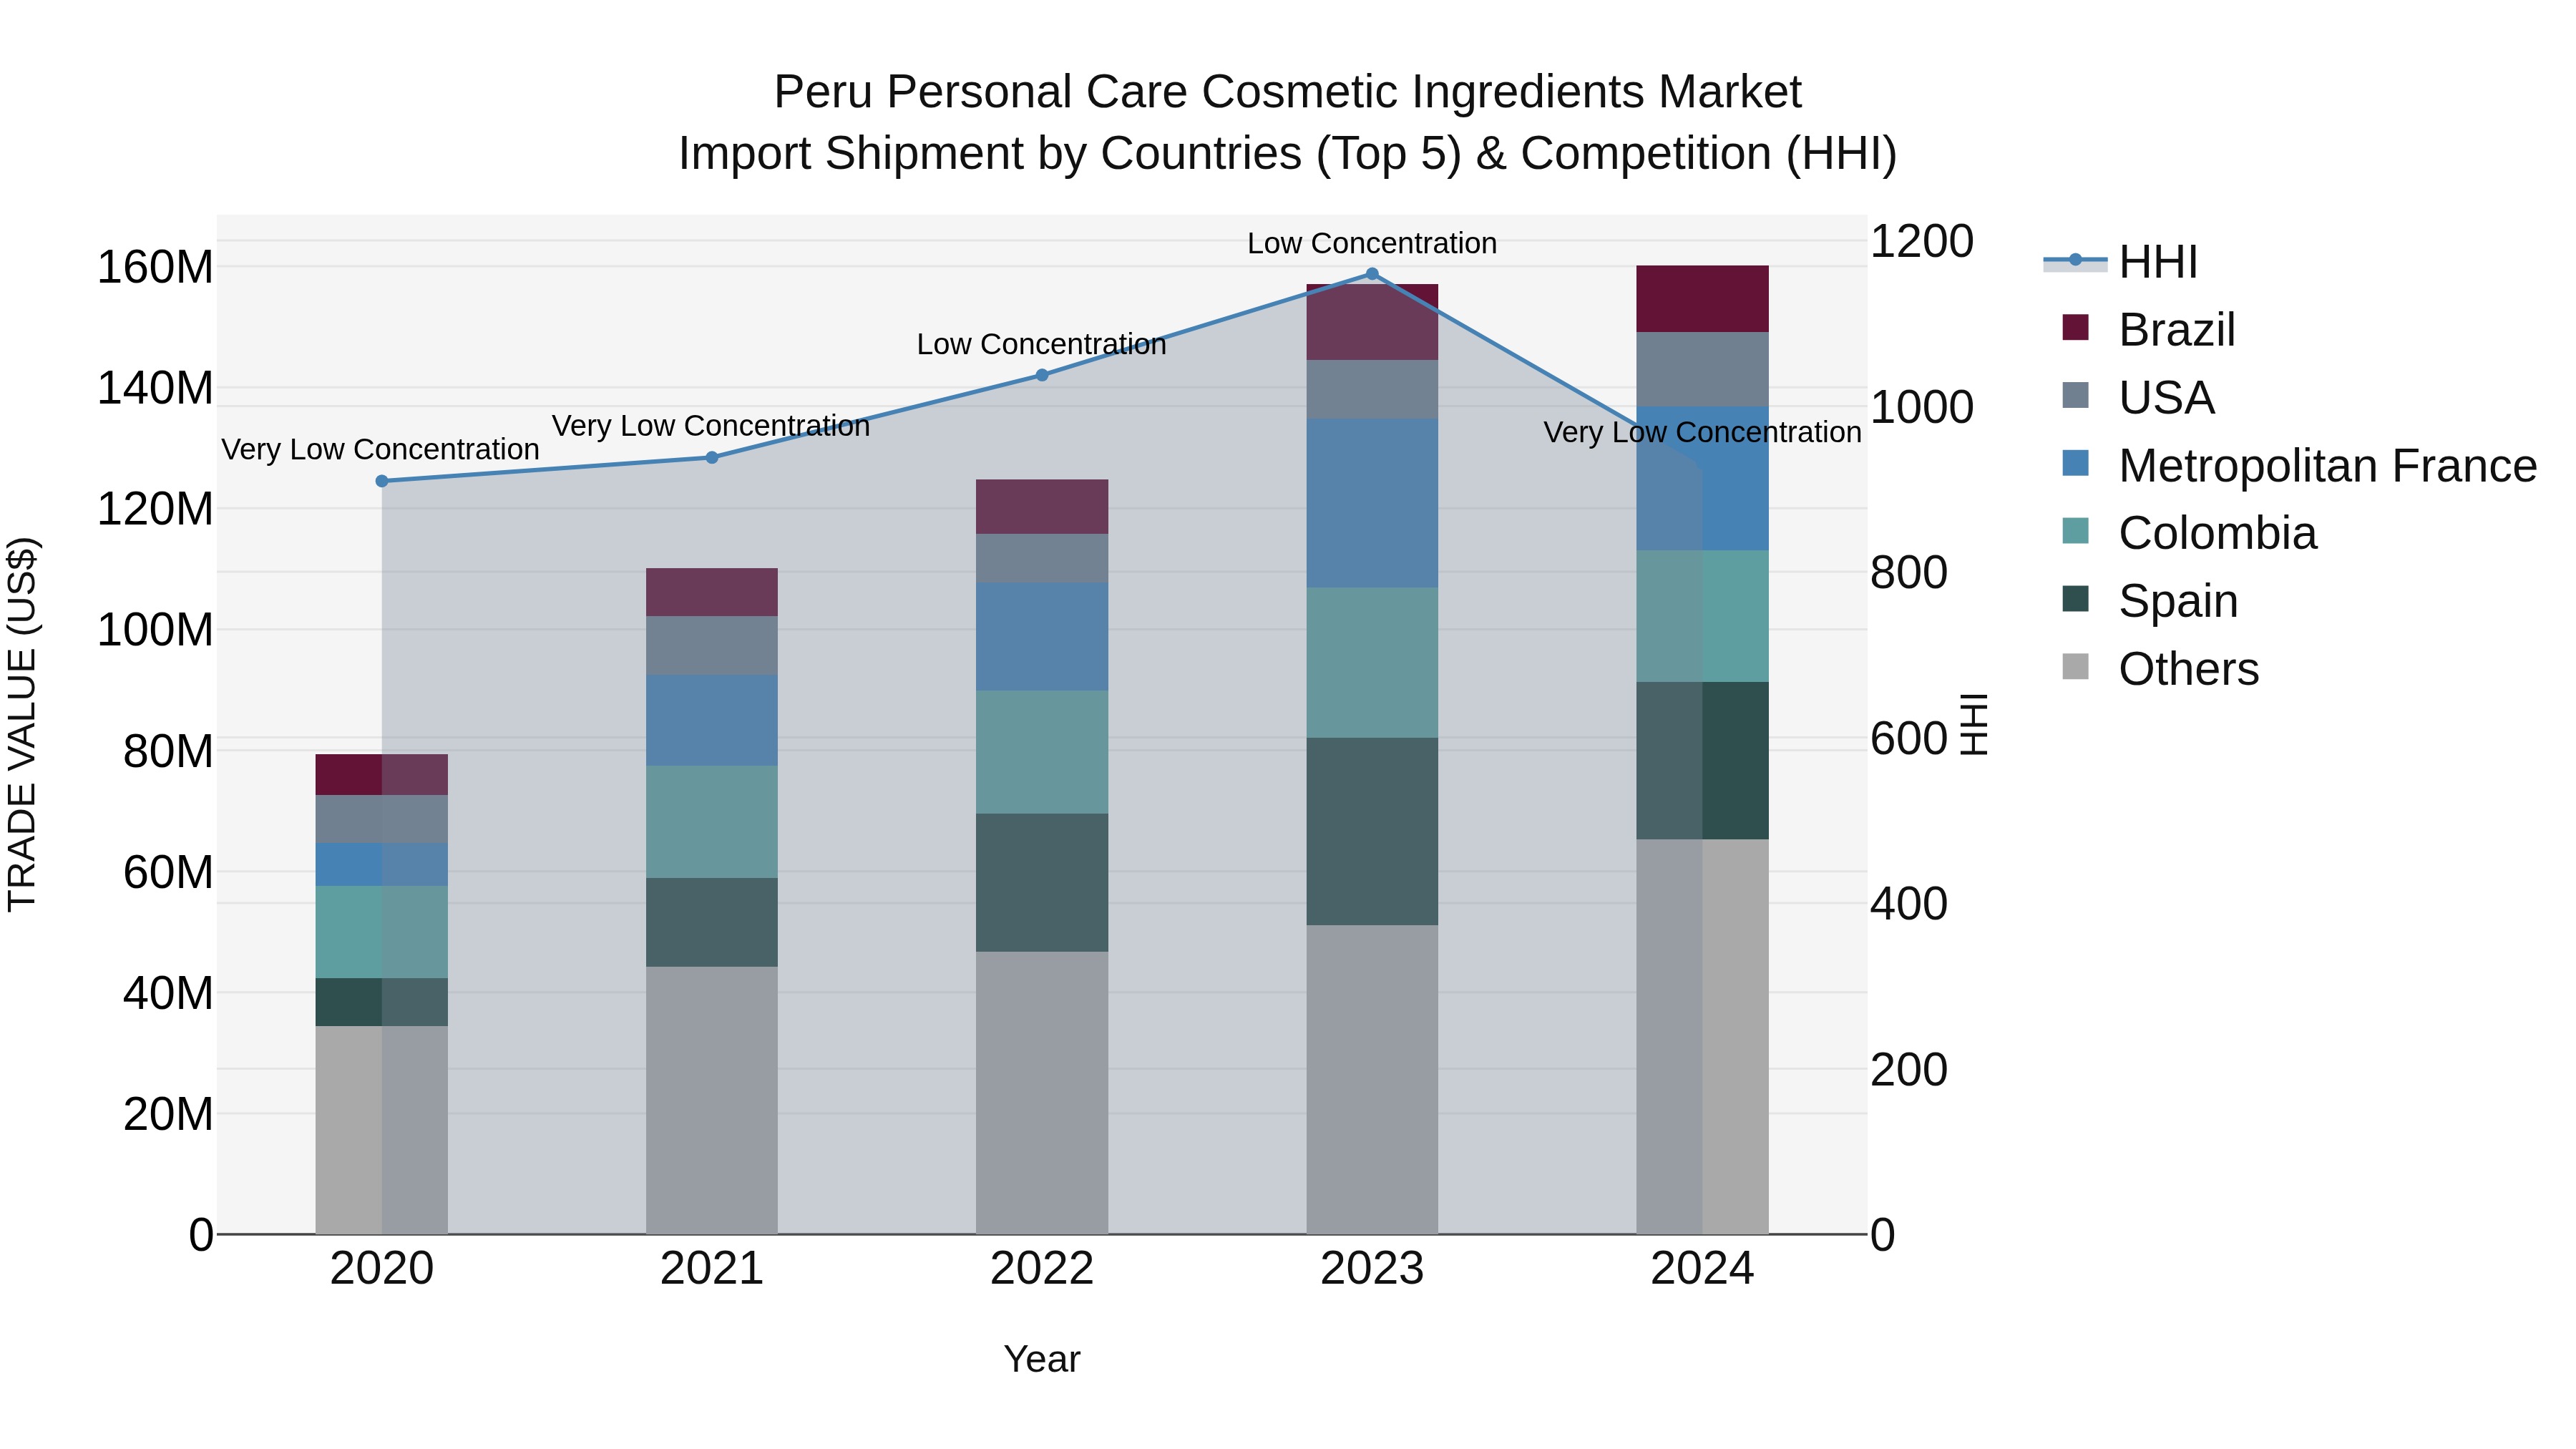
Peru Personal Care Cosmetic Ingredients Market Top 5 Importing Countries and Market Competition (HHI) Analysis
Peru`s personal care cosmetic ingredients import market continued to see diverse sourcing in 2024, with top exporters including Spain, Metropolitan France, Colombia, USA, and Mexico. The market exhibited very low concentration levels, indicating a competitive landscape with multiple players. The impressive compound annual growth rate (CAGR) of 19.18% from 2020 to 2024 highlights the sector`s robust expansion. Although the growth rate slightly slowed in 2024 to 1.91% compared to the previous year, the overall trend suggests a positive trajectory for the industry.
Key Highlights of the Report:
- Peru Personal Care Cosmetic Ingredients Market Outlook
- Market Size of Peru Personal Care Cosmetic Ingredients Market, 2025
- Forecast of Peru Personal Care Cosmetic Ingredients Market, 2032
- Historical Data and Forecast of Peru Personal Care Cosmetic Ingredients Revenues & Volume for the Period 2022 - 2032F
- Peru Personal Care Cosmetic Ingredients Market Trend Evolution
- Peru Personal Care Cosmetic Ingredients Market Drivers and Challenges
- Peru Personal Care Cosmetic Ingredients Price Trends
- Peru Personal Care Cosmetic Ingredients Porter's Five Forces
- Peru Personal Care Cosmetic Ingredients Industry Life Cycle
- Historical Data and Forecast of Peru Personal Care Cosmetic Ingredients Market Revenues & Volume By Ingredient Type for the Period 2022 - 2032F
- Historical Data and Forecast of Peru Personal Care Cosmetic Ingredients Market Revenues & Volume By Emollients for the Period 2022 - 2032F
- Historical Data and Forecast of Peru Personal Care Cosmetic Ingredients Market Revenues & Volume By Surfactants for the Period 2022 - 2032F
- Historical Data and Forecast of Peru Personal Care Cosmetic Ingredients Market Revenues & Volume By Preservatives for the Period 2022 - 2032F
- Historical Data and Forecast of Peru Personal Care Cosmetic Ingredients Market Revenues & Volume By UV Filters for the Period 2022 - 2032F
- Historical Data and Forecast of Peru Personal Care Cosmetic Ingredients Market Revenues & Volume By Antioxidants for the Period 2022 - 2032F
- Historical Data and Forecast of Peru Personal Care Cosmetic Ingredients Market Revenues & Volume By Function for the Period 2022 - 2032F
- Historical Data and Forecast of Peru Personal Care Cosmetic Ingredients Market Revenues & Volume By Skin Moisturization for the Period 2022 - 2032F
- Historical Data and Forecast of Peru Personal Care Cosmetic Ingredients Market Revenues & Volume By Cleansing for the Period 2022 - 2032F
- Historical Data and Forecast of Peru Personal Care Cosmetic Ingredients Market Revenues & Volume By Anti-Bacterial for the Period 2022 - 2032F
- Historical Data and Forecast of Peru Personal Care Cosmetic Ingredients Market Revenues & Volume By Sun Protection for the Period 2022 - 2032F
- Historical Data and Forecast of Peru Personal Care Cosmetic Ingredients Market Revenues & Volume By Anti-Aging for the Period 2022 - 2032F
- Historical Data and Forecast of Peru Personal Care Cosmetic Ingredients Market Revenues & Volume By Product Application for the Period 2022 - 2032F
- Historical Data and Forecast of Peru Personal Care Cosmetic Ingredients Market Revenues & Volume By Face Creams for the Period 2022 - 2032F
- Historical Data and Forecast of Peru Personal Care Cosmetic Ingredients Market Revenues & Volume By Body Washes for the Period 2022 - 2032F
- Historical Data and Forecast of Peru Personal Care Cosmetic Ingredients Market Revenues & Volume By Deodorants for the Period 2022 - 2032F
- Historical Data and Forecast of Peru Personal Care Cosmetic Ingredients Market Revenues & Volume By Sunscreens for the Period 2022 - 2032F
- Historical Data and Forecast of Peru Personal Care Cosmetic Ingredients Market Revenues & Volume By Serums for the Period 2022 - 2032F
- Historical Data and Forecast of Peru Personal Care Cosmetic Ingredients Market Revenues & Volume By Consumer Preference for the Period 2022 - 2032F
- Historical Data and Forecast of Peru Personal Care Cosmetic Ingredients Market Revenues & Volume By Organic for the Period 2022 - 2032F
- Historical Data and Forecast of Peru Personal Care Cosmetic Ingredients Market Revenues & Volume By Vegan for the Period 2022 - 2032F
- Historical Data and Forecast of Peru Personal Care Cosmetic Ingredients Market Revenues & Volume By Paraben-Free for the Period 2022 - 2032F
- Historical Data and Forecast of Peru Personal Care Cosmetic Ingredients Market Revenues & Volume By Natural for the Period 2022 - 2032F
- Historical Data and Forecast of Peru Personal Care Cosmetic Ingredients Market Revenues & Volume By Hypoallergenic for the Period 2022 - 2032F
- Historical Data and Forecast of Peru Personal Care Cosmetic Ingredients Market Revenues & Volume By Regulatory Approval for the Period 2022 - 2032F
- Historical Data and Forecast of Peru Personal Care Cosmetic Ingredients Market Revenues & Volume By FDA Approved for the Period 2022 - 2032F
- Historical Data and Forecast of Peru Personal Care Cosmetic Ingredients Market Revenues & Volume By EU Compliant for the Period 2022 - 2032F
- Historical Data and Forecast of Peru Personal Care Cosmetic Ingredients Market Revenues & Volume By ECOCERT Certified for the Period 2022 - 2032F
- Historical Data and Forecast of Peru Personal Care Cosmetic Ingredients Market Revenues & Volume By Dermatologist Recommended for the Period 2022 - 2032F
- Historical Data and Forecast of Peru Personal Care Cosmetic Ingredients Market Revenues & Volume By ISO Certified for the Period 2022 - 2032F
- Peru Personal Care Cosmetic Ingredients Import Export Trade Statistics
- Market Opportunity Assessment By Ingredient Type
- Market Opportunity Assessment By Function
- Market Opportunity Assessment By Product Application
- Market Opportunity Assessment By Consumer Preference
- Market Opportunity Assessment By Regulatory Approval
- Peru Personal Care Cosmetic Ingredients Top Companies Market Share
- Peru Personal Care Cosmetic Ingredients Competitive Benchmarking By Technical and Operational Parameters
- Peru Personal Care Cosmetic Ingredients Company Profiles
- Peru Personal Care Cosmetic Ingredients Key Strategic Recommendations
Frequently Asked Questions About the Market Study (FAQs):
6Wresearch actively monitors the Peru Personal Care Cosmetic Ingredients Market and publishes its comprehensive annual report, highlighting emerging trends, growth drivers, revenue analysis, and forecast outlook. Our insights help businesses to make data-backed strategic decisions with ongoing market dynamics. Our analysts track relevent industries related to the Peru Personal Care Cosmetic Ingredients Market, allowing our clients with actionable intelligence and reliable forecasts tailored to emerging regional needs.
Yes, we provide customisation as per your requirements. To learn more, feel free to contact us on sales@6wresearch.com
1 Executive Summary |
2 Introduction |
2.1 Key Highlights of the Report |
2.2 Report Description |
2.3 Market Scope & Segmentation |
2.4 Research Methodology |
2.5 Assumptions |
3 Peru Personal Care Cosmetic Ingredients Market Overview |
3.1 Peru Country Macro Economic Indicators |
3.2 Peru Personal Care Cosmetic Ingredients Market Revenues & Volume, 2022 & 2032F |
3.3 Peru Personal Care Cosmetic Ingredients Market - Industry Life Cycle |
3.4 Peru Personal Care Cosmetic Ingredients Market - Porter's Five Forces |
3.5 Peru Personal Care Cosmetic Ingredients Market Revenues & Volume Share, By Ingredient Type, 2022 & 2032F |
3.6 Peru Personal Care Cosmetic Ingredients Market Revenues & Volume Share, By Function, 2022 & 2032F |
3.7 Peru Personal Care Cosmetic Ingredients Market Revenues & Volume Share, By Product Application, 2022 & 2032F |
3.8 Peru Personal Care Cosmetic Ingredients Market Revenues & Volume Share, By Consumer Preference, 2022 & 2032F |
3.9 Peru Personal Care Cosmetic Ingredients Market Revenues & Volume Share, By Regulatory Approval, 2022 & 2032F |
4 Peru Personal Care Cosmetic Ingredients Market Dynamics |
4.1 Impact Analysis |
4.2 Market Drivers |
4.2.1 Growing consumer awareness and preference for natural and organic personal care products |
4.2.2 Increasing disposable income and changing lifestyles leading to higher demand for premium cosmetic ingredients |
4.2.3 Rising emphasis on personal grooming and appearance among the population in Peru |
4.3 Market Restraints |
4.3.1 Stringent regulatory requirements and standards for cosmetic ingredients in Peru |
4.3.2 Fluctuating prices of raw materials impacting the cost of production for cosmetic companies |
5 Peru Personal Care Cosmetic Ingredients Market Trends |
6 Peru Personal Care Cosmetic Ingredients Market, By Types |
6.1 Peru Personal Care Cosmetic Ingredients Market, By Ingredient Type |
6.1.1 Overview and Analysis |
6.1.2 Peru Personal Care Cosmetic Ingredients Market Revenues & Volume, By Ingredient Type, 2022 - 2032F |
6.1.3 Peru Personal Care Cosmetic Ingredients Market Revenues & Volume, By Emollients, 2022 - 2032F |
6.1.4 Peru Personal Care Cosmetic Ingredients Market Revenues & Volume, By Surfactants, 2022 - 2032F |
6.1.5 Peru Personal Care Cosmetic Ingredients Market Revenues & Volume, By Preservatives, 2022 - 2032F |
6.1.6 Peru Personal Care Cosmetic Ingredients Market Revenues & Volume, By UV Filters, 2022 - 2032F |
6.1.7 Peru Personal Care Cosmetic Ingredients Market Revenues & Volume, By Antioxidants, 2022 - 2032F |
6.2 Peru Personal Care Cosmetic Ingredients Market, By Function |
6.2.1 Overview and Analysis |
6.2.2 Peru Personal Care Cosmetic Ingredients Market Revenues & Volume, By Skin Moisturization, 2022 - 2032F |
6.2.3 Peru Personal Care Cosmetic Ingredients Market Revenues & Volume, By Cleansing, 2022 - 2032F |
6.2.4 Peru Personal Care Cosmetic Ingredients Market Revenues & Volume, By Anti-Bacterial, 2022 - 2032F |
6.2.5 Peru Personal Care Cosmetic Ingredients Market Revenues & Volume, By Sun Protection, 2022 - 2032F |
6.2.6 Peru Personal Care Cosmetic Ingredients Market Revenues & Volume, By Anti-Aging, 2022 - 2032F |
6.3 Peru Personal Care Cosmetic Ingredients Market, By Product Application |
6.3.1 Overview and Analysis |
6.3.2 Peru Personal Care Cosmetic Ingredients Market Revenues & Volume, By Face Creams, 2022 - 2032F |
6.3.3 Peru Personal Care Cosmetic Ingredients Market Revenues & Volume, By Body Washes, 2022 - 2032F |
6.3.4 Peru Personal Care Cosmetic Ingredients Market Revenues & Volume, By Deodorants, 2022 - 2032F |
6.3.5 Peru Personal Care Cosmetic Ingredients Market Revenues & Volume, By Sunscreens, 2022 - 2032F |
6.3.6 Peru Personal Care Cosmetic Ingredients Market Revenues & Volume, By Serums, 2022 - 2032F |
6.4 Peru Personal Care Cosmetic Ingredients Market, By Consumer Preference |
6.4.1 Overview and Analysis |
6.4.2 Peru Personal Care Cosmetic Ingredients Market Revenues & Volume, By Organic, 2022 - 2032F |
6.4.3 Peru Personal Care Cosmetic Ingredients Market Revenues & Volume, By Vegan, 2022 - 2032F |
6.4.4 Peru Personal Care Cosmetic Ingredients Market Revenues & Volume, By Paraben-Free, 2022 - 2032F |
6.4.5 Peru Personal Care Cosmetic Ingredients Market Revenues & Volume, By Natural, 2022 - 2032F |
6.4.6 Peru Personal Care Cosmetic Ingredients Market Revenues & Volume, By Hypoallergenic, 2022 - 2032F |
6.5 Peru Personal Care Cosmetic Ingredients Market, By Regulatory Approval |
6.5.1 Overview and Analysis |
6.5.2 Peru Personal Care Cosmetic Ingredients Market Revenues & Volume, By FDA Approved, 2022 - 2032F |
6.5.3 Peru Personal Care Cosmetic Ingredients Market Revenues & Volume, By EU Compliant, 2022 - 2032F |
6.5.4 Peru Personal Care Cosmetic Ingredients Market Revenues & Volume, By ECOCERT Certified, 2022 - 2032F |
6.5.5 Peru Personal Care Cosmetic Ingredients Market Revenues & Volume, By Dermatologist Recommended, 2022 - 2032F |
6.5.6 Peru Personal Care Cosmetic Ingredients Market Revenues & Volume, By ISO Certified, 2022 - 2032F |
7 Peru Personal Care Cosmetic Ingredients Market Import-Export Trade Statistics |
7.1 Peru Personal Care Cosmetic Ingredients Market Export to Major Countries |
7.2 Peru Personal Care Cosmetic Ingredients Market Imports from Major Countries |
8 Peru Personal Care Cosmetic Ingredients Market Key Performance Indicators |
8.1 Research and development investments in innovative cosmetic ingredients |
8.2 Number of new product launches incorporating advanced cosmetic ingredients |
8.3 Adoption rate of sustainable and environmentally friendly cosmetic ingredients in the market |
9 Peru Personal Care Cosmetic Ingredients Market - Opportunity Assessment |
9.1 Peru Personal Care Cosmetic Ingredients Market Opportunity Assessment, By Ingredient Type, 2022 & 2032F |
9.2 Peru Personal Care Cosmetic Ingredients Market Opportunity Assessment, By Function, 2022 & 2032F |
9.3 Peru Personal Care Cosmetic Ingredients Market Opportunity Assessment, By Product Application, 2022 & 2032F |
9.4 Peru Personal Care Cosmetic Ingredients Market Opportunity Assessment, By Consumer Preference, 2022 & 2032F |
9.5 Peru Personal Care Cosmetic Ingredients Market Opportunity Assessment, By Regulatory Approval, 2022 & 2032F |
10 Peru Personal Care Cosmetic Ingredients Market - Competitive Landscape |
10.1 Peru Personal Care Cosmetic Ingredients Market Revenue Share, By Companies, 2025 |
10.2 Peru Personal Care Cosmetic Ingredients Market Competitive Benchmarking, By Operating and Technical Parameters |
11 Company Profiles |
12 Recommendations |
13 Disclaimer |
Export potential assessment - trade Analytics for 2030
Export potential enables firms to identify high-growth global markets with greater confidence by combining advanced trade intelligence with a structured quantitative methodology. The framework analyzes emerging demand trends and country-level import patterns while integrating macroeconomic and trade datasets such as GDP and population forecasts, bilateral import–export flows, tariff structures, elasticity differentials between developed and developing economies, geographic distance, and import demand projections. Using weighted trade values from 2020–2024 as the base period to project country-to-country export potential for 2030, these inputs are operationalized through calculated drivers such as gravity model parameters, tariff impact factors, and projected GDP per-capita growth. Through an analysis of hidden potentials, demand hotspots, and market conditions that are most favorable to success, this method enables firms to focus on target countries, maximize returns, and global expansion with data, backed by accuracy.
By factoring in the projected importer demand gap that is currently unmet and could be potential opportunity, it identifies the potential for the Exporter (Country) among 190 countries, against the general trade analysis, which identifies the biggest importer or exporter.
To discover high-growth global markets and optimize your business strategy:
Click Here
Pricing
- Single User License$ 1,995
- Department License$ 2,400
- Site License$ 3,120
- Global License$ 3,795

Search
Thought Leadership and Analyst Meet


Our Clients
Latest Reports
- France Thermally Conductive Filler Dispersants Market (2026-2032) | Challenges, Restraints, Value, Share, Size, segmentation, Analysis, Trends, Investment Opportunities, Outlook, Pricing, Demand, Forecast, Revenue, Companies, Growth, Drivers, Strategy, Insights, Competition
- Egypt Thermally Conductive Filler Dispersants Market (2026-2032) | Competition, Forecast, Strategy, Value, Insights, Outlook, Investment Opportunities, Pricing, Demand, Share, segmentation, Drivers, Size, Companies, Restraints, Growth, Trends, Revenue, Challenges, Analysis
- Czech Republic Thermally Conductive Filler Dispersants Market (2026-2032) | Forecast, Pricing, Analysis, Drivers, Insights, Size, Demand, Growth, Challenges, segmentation, Competition, Outlook, Trends, Investment Opportunities, Companies, Strategy, Revenue, Share, Value, Restraints
- Colombia Thermally Conductive Filler Dispersants Market (2026-2032) | segmentation, Trends, Share, Drivers, Strategy, Companies, Demand, Insights, Size, Challenges, Value, Competition, Analysis, Growth, Revenue, Restraints, Forecast, Pricing, Outlook, Investment Opportunities
- China Thermally Conductive Filler Dispersants Market (2026-2032) | Restraints, Investment Opportunities, Pricing, Companies, Share, Size, Challenges, Trends, Outlook, Value, Analysis, Competition, Revenue, Drivers, Forecast, Demand, Insights, Growth, Strategy, segmentation
- Chile Thermally Conductive Filler Dispersants Market (2026-2032) | Investment Opportunities, Trends, Value, Restraints, Share, Companies, Forecast, segmentation, Pricing, Challenges, Demand, Size, Analysis, Drivers, Outlook, Growth, Competition, Strategy, Revenue, Insights
- Cambodia Thermally Conductive Filler Dispersants Market (2026-2032) | Analysis, Share, Outlook, Strategy, Pricing, Demand, Size, Growth, segmentation, Insights, Revenue, Forecast, Challenges, Competition, Companies, Investment Opportunities, Trends, Restraints, Value, Drivers
- Brazil Thermally Conductive Filler Dispersants Market (2026-2032) | Restraints, Forecast, Competition, Size, Revenue, Value, Investment Opportunities, Trends, Insights, Outlook, Growth, Analysis, Drivers, segmentation, Pricing, Challenges, Strategy, Share, Companies, Demand
- Bangladesh Thermally Conductive Filler Dispersants Market (2026-2032) | Restraints, Trends, Analysis, Competition, Insights, Forecast, Value, Investment Opportunities, Pricing, Share, Demand, Outlook, Revenue, segmentation, Companies, Drivers, Growth, Size, Challenges, Strategy
- Bahrain Thermally Conductive Filler Dispersants Market (2026-2032) | Trends, Outlook, Pricing, Demand, Value, Competition, Forecast, Growth, segmentation, Revenue, Companies, Analysis, Insights, Size, Drivers, Challenges, Strategy, Investment Opportunities, Share, Restraints
Industry Events and Analyst Meet

HIMTEX 2026

India Refining Summit 2026

India EV Show 2026

EV tech India Expo 2026

Auto Tech Asia 2026
Whitepaper
- Middle East & Africa Commercial Security Market Click here to view more.
- Middle East & Africa Fire Safety Systems & Equipment Market Click here to view more.
- GCC Drone Market Click here to view more.
- Middle East Lighting Fixture Market Click here to view more.
- GCC Physical & Perimeter Security Market Click here to view more.
6WResearch In News
- Doha a strategic location for EV manufacturing hub: IPA Qatar
- Demand for luxury TVs surging in the GCC, says Samsung
- Empowering Growth: The Thriving Journey of Bangladesh’s Cable Industry
- Demand for luxury TVs surging in the GCC, says Samsung
- Video call with a traditional healer? Once unthinkable, it’s now common in South Africa
- Intelligent Buildings To Smooth GCC’s Path To Net Zero