Peru Table Top Sweeteners Market (2025-2031) | Trends, Segmentation, Forecast, Competitive Landscape, Industry, Size & Revenue, Outlook, Share, Value, Analysis, Growth, Companies
Market Forecast By Type (Natural, Artificial), By Application (Dining Room, Family, Others) And Competitive Landscape
| Product Code: ETC8831371 | Publication Date: Sep 2024 | Updated Date: Nov 2025 | Product Type: Market Research Report | |
| Publisher: 6Wresearch | Author: Sachin Kumar Rai | No. of Pages: 75 | No. of Figures: 35 | No. of Tables: 20 |
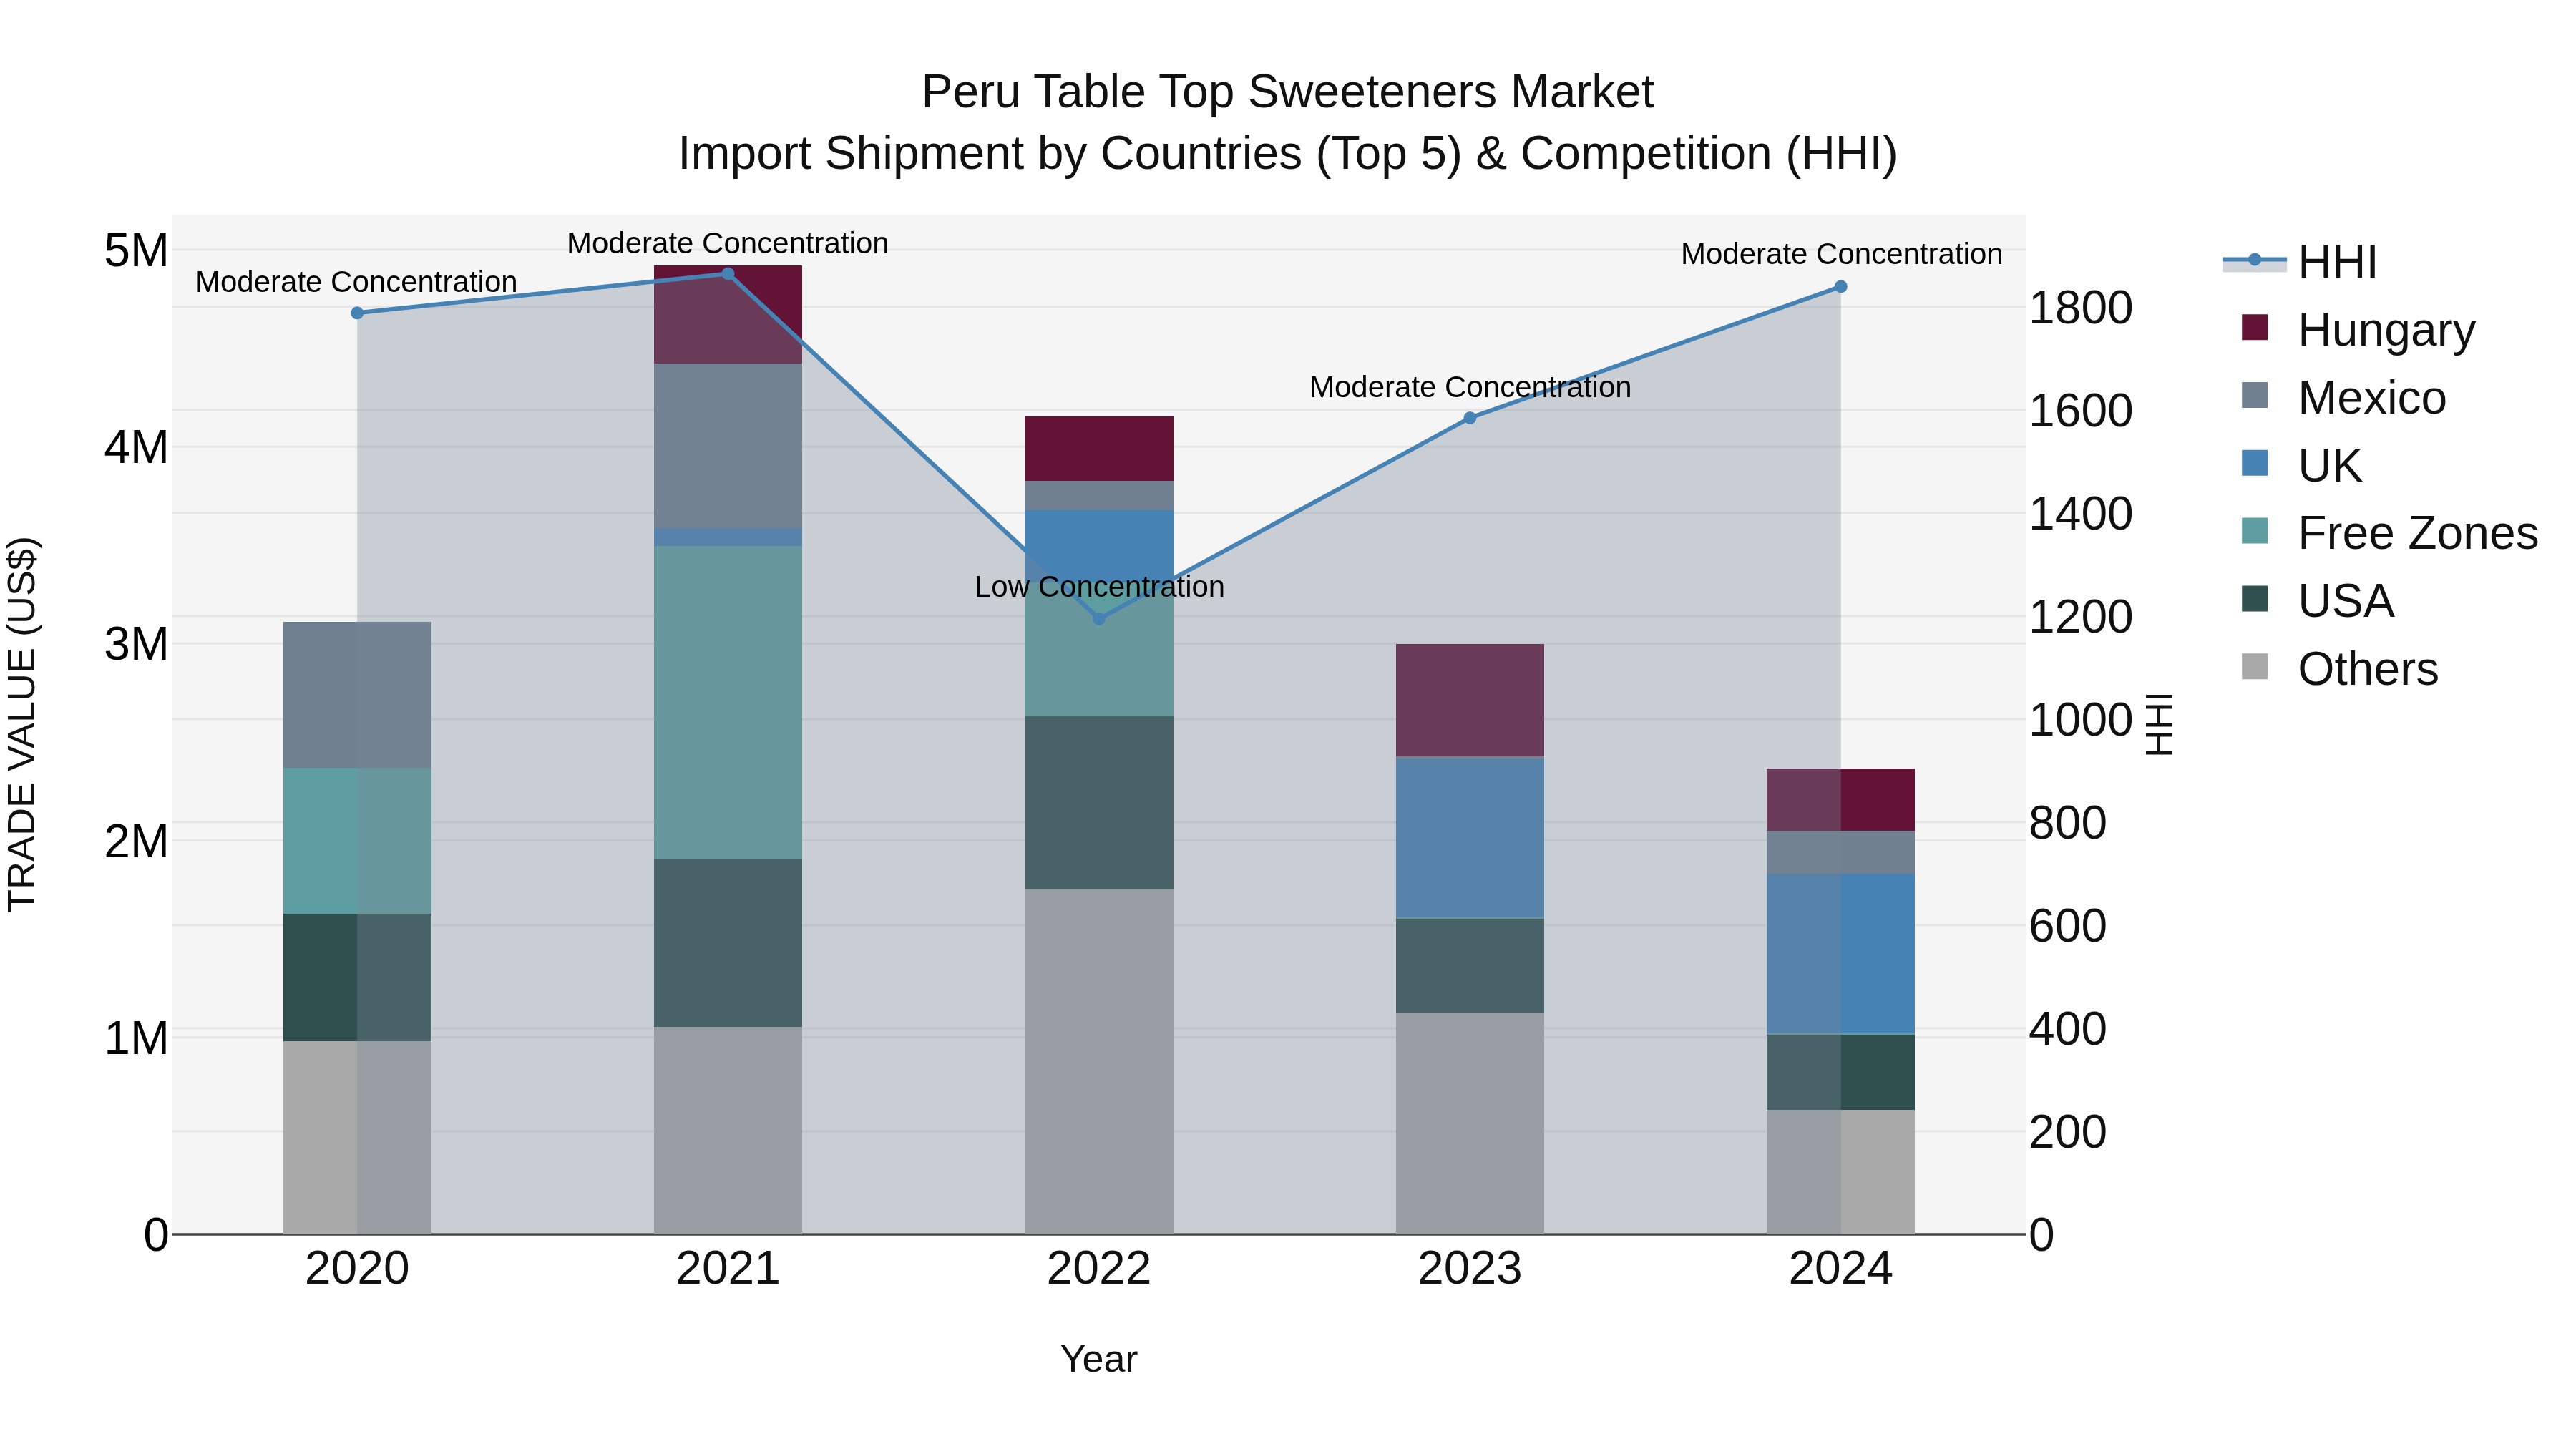
Peru Table Top Sweeteners Market Top 5 Importing Countries and Market Competition (HHI) Analysis
Peru`s table top sweeteners import market witnessed a decline in growth, with a CAGR of -6.61% from 2020 to 2024. In 2024, the top countries exporting to Peru were the UK, USA, Hungary, Germany, and Mexico. Despite a negative growth rate of -21.05% in 2023-24, the market maintained a moderate concentration with the Herfindahl-Hirschman Index (HHI). This data suggests a shifting landscape in the market dynamics, possibly influenced by changing consumer preferences or market conditions.
Peru Table Top Sweeteners Market Synopsis
The Peru Table Top Sweeteners Market is experiencing steady growth driven by increasing health awareness, rising diabetic population, and changing consumer preferences towards low-calorie sweeteners. Artificial sweeteners such as aspartame, sucralose, and stevia are gaining popularity due to their zero-calorie content and ability to mimic the taste of sugar. Market players are focusing on product innovation, packaging designs, and marketing strategies to attract a wider consumer base. The market is also witnessing a shift towards natural sweeteners like stevia, which are perceived as healthier alternatives to artificial sweeteners. Increased urbanization and a growing middle-class population are further fueling the demand for table top sweeteners in Peru. Overall, the market is poised for continued growth as consumers seek healthier and low-calorie options in their diets.
Peru Table Top Sweeteners Market Trends
The Peru Table Top Sweeteners Market is experiencing a growing trend towards natural and healthier sweetening options, driven by increasing consumer awareness of the health risks associated with traditional sugar consumption. This has led to a rising demand for alternative sweeteners such as stevia, monk fruit, and erythritol, which are perceived as better-for-you options. There is also a noticeable shift towards convenient and on-the-go packaging formats, catering to the busy lifestyles of modern consumers. With a growing focus on wellness and healthy living, there are significant opportunities for manufacturers to innovate and introduce new products that meet the evolving preferences of health-conscious Peruvian consumers. Additionally, expanding distribution channels and effective marketing strategies can help capitalize on the increasing demand for table top sweeteners in the country.
Peru Table Top Sweeteners Market Challenges
In the Peru Table Top Sweeteners Market, some key challenges faced include increasing health concerns related to artificial sweeteners, growing consumer preference for natural and organic sweeteners, and intense competition among key market players. With a rising focus on health and wellness, consumers are becoming more cautious about the potential negative effects of artificial sweeteners, leading to a shift towards natural alternatives such as stevia and monk fruit. Additionally, regulatory uncertainties and changing government policies can also impact the market dynamics. Companies operating in this market need to innovate and diversify their product offerings to cater to changing consumer preferences while also ensuring compliance with evolving regulations to stay competitive and sustain growth in the Peru Table Top Sweeteners Market.
Peru Table Top Sweeteners Market Investment Opportunities
The Peru Table Top Sweeteners Market is primarily driven by the increasing consumer awareness and concerns regarding health and wellness, leading to a shift towards lower calorie and natural sweetening alternatives. The rising prevalence of lifestyle-related diseases such as diabetes and obesity is also fueling the demand for table top sweeteners as consumers seek to reduce their sugar intake. Additionally, the growing popularity of convenience foods and beverages among urban populations is boosting the market growth as these products often use table top sweeteners as a sugar substitute. Product innovation and a wide range of sweetening options available in the market are further driving the growth of the table top sweeteners market in Peru.
Peru Table Top Sweeteners Market Government Polices
Government policies related to the Peru Table Top Sweeteners Market focus on regulating the use of artificial sweeteners to ensure consumer safety and promote public health. The Peruvian government has established maximum acceptable levels for sweeteners in various food products, including table-top sweeteners, to prevent excessive consumption. Additionally, labeling requirements mandate that manufacturers accurately disclose the type and quantity of sweeteners used in their products. The government also encourages the use of natural sweeteners such as stevia, which is native to Peru, to promote the country`s agricultural industry and reduce dependency on imported sweeteners. Overall, these policies aim to ensure transparency, quality, and safety in the Peru Table Top Sweeteners Market while promoting the consumption of healthier sweetener alternatives.
Peru Table Top Sweeteners Market Future Outlook
The future outlook for the Peru Table Top Sweeteners Market appears optimistic, driven by increasing health consciousness among consumers and a growing demand for low-calorie and natural sweetener alternatives. As the government continues to promote healthy eating habits and awareness about the adverse effects of excessive sugar consumption, there is a shift towards using table top sweeteners in various food and beverage products. Additionally, the rising prevalence of lifestyle-related diseases such as diabetes and obesity is further fueling the demand for sugar substitutes. Manufacturers are likely to introduce innovative products with clean label ingredients and unique flavor profiles to cater to evolving consumer preferences. Overall, the Peru Table Top Sweeteners Market is expected to witness steady growth in the coming years.
Key Highlights of the Report:
- Peru Table Top Sweeteners Market Outlook
- Market Size of Peru Table Top Sweeteners Market, 2024
- Forecast of Peru Table Top Sweeteners Market, 2031
- Historical Data and Forecast of Peru Table Top Sweeteners Revenues & Volume for the Period 2021- 2031
- Peru Table Top Sweeteners Market Trend Evolution
- Peru Table Top Sweeteners Market Drivers and Challenges
- Peru Table Top Sweeteners Price Trends
- Peru Table Top Sweeteners Porter's Five Forces
- Peru Table Top Sweeteners Industry Life Cycle
- Historical Data and Forecast of Peru Table Top Sweeteners Market Revenues & Volume By Type for the Period 2021- 2031
- Historical Data and Forecast of Peru Table Top Sweeteners Market Revenues & Volume By Natural for the Period 2021- 2031
- Historical Data and Forecast of Peru Table Top Sweeteners Market Revenues & Volume By Artificial for the Period 2021- 2031
- Historical Data and Forecast of Peru Table Top Sweeteners Market Revenues & Volume By Application for the Period 2021- 2031
- Historical Data and Forecast of Peru Table Top Sweeteners Market Revenues & Volume By Dining Room for the Period 2021- 2031
- Historical Data and Forecast of Peru Table Top Sweeteners Market Revenues & Volume By Family for the Period 2021- 2031
- Historical Data and Forecast of Peru Table Top Sweeteners Market Revenues & Volume By Others for the Period 2021- 2031
- Peru Table Top Sweeteners Import Export Trade Statistics
- Market Opportunity Assessment By Type
- Market Opportunity Assessment By Application
- Peru Table Top Sweeteners Top Companies Market Share
- Peru Table Top Sweeteners Competitive Benchmarking By Technical and Operational Parameters
- Peru Table Top Sweeteners Company Profiles
- Peru Table Top Sweeteners Key Strategic Recommendations
Frequently Asked Questions About the Market Study (FAQs):
6Wresearch actively monitors the Peru Table Top Sweeteners Market and publishes its comprehensive annual report, highlighting emerging trends, growth drivers, revenue analysis, and forecast outlook. Our insights help businesses to make data-backed strategic decisions with ongoing market dynamics. Our analysts track relevent industries related to the Peru Table Top Sweeteners Market, allowing our clients with actionable intelligence and reliable forecasts tailored to emerging regional needs.
Yes, we provide customisation as per your requirements. To learn more, feel free to contact us on sales@6wresearch.com
1 Executive Summary |
2 Introduction |
2.1 Key Highlights of the Report |
2.2 Report Description |
2.3 Market Scope & Segmentation |
2.4 Research Methodology |
2.5 Assumptions |
3 Peru Table Top Sweeteners Market Overview |
3.1 Peru Country Macro Economic Indicators |
3.2 Peru Table Top Sweeteners Market Revenues & Volume, 2021 & 2031F |
3.3 Peru Table Top Sweeteners Market - Industry Life Cycle |
3.4 Peru Table Top Sweeteners Market - Porter's Five Forces |
3.5 Peru Table Top Sweeteners Market Revenues & Volume Share, By Type, 2021 & 2031F |
3.6 Peru Table Top Sweeteners Market Revenues & Volume Share, By Application, 2021 & 2031F |
4 Peru Table Top Sweeteners Market Dynamics |
4.1 Impact Analysis |
4.2 Market Drivers |
4.2.1 Increasing health consciousness among consumers leading to a preference for low-calorie sweeteners. |
4.2.2 Growing prevalence of diabetes and obesity, driving demand for sugar alternatives. |
4.2.3 Rising disposable incomes in Peru, allowing consumers to afford premium table top sweeteners. |
4.3 Market Restraints |
4.3.1 Lack of awareness about the benefits and availability of table top sweeteners in the market. |
4.3.2 Price sensitivity among consumers, especially in lower-income segments. |
4.3.3 Regulatory challenges and restrictions on certain artificial sweeteners in the market. |
5 Peru Table Top Sweeteners Market Trends |
6 Peru Table Top Sweeteners Market, By Types |
6.1 Peru Table Top Sweeteners Market, By Type |
6.1.1 Overview and Analysis |
6.1.2 Peru Table Top Sweeteners Market Revenues & Volume, By Type, 2021- 2031F |
6.1.3 Peru Table Top Sweeteners Market Revenues & Volume, By Natural, 2021- 2031F |
6.1.4 Peru Table Top Sweeteners Market Revenues & Volume, By Artificial, 2021- 2031F |
6.2 Peru Table Top Sweeteners Market, By Application |
6.2.1 Overview and Analysis |
6.2.2 Peru Table Top Sweeteners Market Revenues & Volume, By Dining Room, 2021- 2031F |
6.2.3 Peru Table Top Sweeteners Market Revenues & Volume, By Family, 2021- 2031F |
6.2.4 Peru Table Top Sweeteners Market Revenues & Volume, By Others, 2021- 2031F |
7 Peru Table Top Sweeteners Market Import-Export Trade Statistics |
7.1 Peru Table Top Sweeteners Market Export to Major Countries |
7.2 Peru Table Top Sweeteners Market Imports from Major Countries |
8 Peru Table Top Sweeteners Market Key Performance Indicators |
8.1 Consumer awareness and perception surveys on table top sweeteners. |
8.2 Number of new product launches and innovations in the table top sweeteners market. |
8.3 Trends in usage of natural sweeteners versus artificial sweeteners in the market. |
8.4 Market penetration and adoption rates of table top sweeteners among different demographic segments. |
9 Peru Table Top Sweeteners Market - Opportunity Assessment |
9.1 Peru Table Top Sweeteners Market Opportunity Assessment, By Type, 2021 & 2031F |
9.2 Peru Table Top Sweeteners Market Opportunity Assessment, By Application, 2021 & 2031F |
10 Peru Table Top Sweeteners Market - Competitive Landscape |
10.1 Peru Table Top Sweeteners Market Revenue Share, By Companies, 2024 |
10.2 Peru Table Top Sweeteners Market Competitive Benchmarking, By Operating and Technical Parameters |
11 Company Profiles |
12 Recommendations |
13 Disclaimer |
Global Go To Market Strategy - 2030
Export potential enables firms to identify high-growth global markets with greater confidence by combining advanced trade intelligence with a structured quantitative methodology. The framework analyzes emerging demand trends and country-level import patterns while integrating macroeconomic and trade datasets such as GDP and population forecasts, bilateral import–export flows, tariff structures, elasticity differentials between developed and developing economies, geographic distance, and import demand projections. Using weighted trade values from 2020–2024 as the base period to project country-to-country export potential for 2030, these inputs are operationalized through calculated drivers such as gravity model parameters, tariff impact factors, and projected GDP per-capita growth. Through an analysis of hidden potentials, demand hotspots, and market conditions that are most favorable to success, this method enables firms to focus on target countries, maximize returns, and global expansion with data, backed by accuracy.
By factoring in the projected importer demand gap that is currently unmet and could be potential opportunity, it identifies the potential for the Exporter (Country) among 190 countries, against the general trade analysis, which identifies the biggest importer or exporter.
To discover high-growth global markets and optimize your business strategy:
Click Here
Pricing
- Single User License$ 1,995
- Department License$ 2,400
- Site License$ 3,120
- Global License$ 3,795

Leadership Perspectives from Industry Events
Search
Thought Leadership and Analyst Meet


Our Clients
6WResearch In News
- India Air Conditioner Market Set for Strong Rebound in 2026 After Weather-Led Correction and GST-Driven Recovery: 6Wresearch
- ADAS in India: How Automatic Emergency Braking, Blind Spot Detection & Driver Monitoring are Transforming Road Safety
- Doha a strategic location for EV manufacturing hub: IPA Qatar
- Demand for luxury TVs surging in the GCC, says Samsung
- Empowering Growth: The Thriving Journey of Bangladesh’s Cable Industry
- Demand for luxury TVs surging in the GCC, says Samsung
Latest Reports
- Poland Fire Protection Systems Market (2026-2032)
- Cape Verde Portable Hand-Thrown Extinguisher Market (2026-2032)
- Canada Portable Hand-Thrown Extinguisher Market (2026-2032)
- Cameroon Portable Hand-Thrown Extinguisher Market (2026-2032)
- Burundi Portable Hand-Thrown Extinguisher Market (2026-2032)
- Burkina Faso Portable Hand-Thrown Extinguisher Market (2026-2032)
- Bulgaria Portable Hand-Thrown Extinguisher Market (2026-2032)
- Brunei Portable Hand-Thrown Extinguisher Market (2026-2032)
- Botswana Portable Hand-Thrown Extinguisher Market (2026-2032)
- Bosnia and Herzegovina Portable Hand-Thrown Extinguisher Market (2026-2032)
Industry Events and Analyst Meet

HIMTEX 2026

India Refining Summit 2026

India EV Show 2026

EV tech India Expo 2026

Auto Tech Asia 2026
Whitepaper
- Middle East & Africa Commercial Security Market Click here to view more.
- Middle East & Africa Fire Safety Systems & Equipment Market Click here to view more.
- GCC Drone Market Click here to view more.
- Middle East Lighting Fixture Market Click here to view more.
- GCC Physical & Perimeter Security Market Click here to view more.