Philippines Cup Carriers Market (2025-2031) | Companies, Competitive Landscape, Analysis, Trends, Growth, Industry, Size & Revenue, Outlook, Share, Segmentation, Forecast, Value
Market Forecast By Material (Paper/Molded Fiber, Plastic, Others), By Number of Cups (1 to 2, 3 to 4, 5 to 6, Above 6), By End Use (Food Service Outlets, Institutional Food Services, Household Use) And Competitive Landscape
| Product Code: ETC8838975 | Publication Date: Sep 2024 | Updated Date: Nov 2025 | Product Type: Market Research Report | |
| Publisher: 6Wresearch | Author: Sumit Sagar | No. of Pages: 75 | No. of Figures: 35 | No. of Tables: 20 |
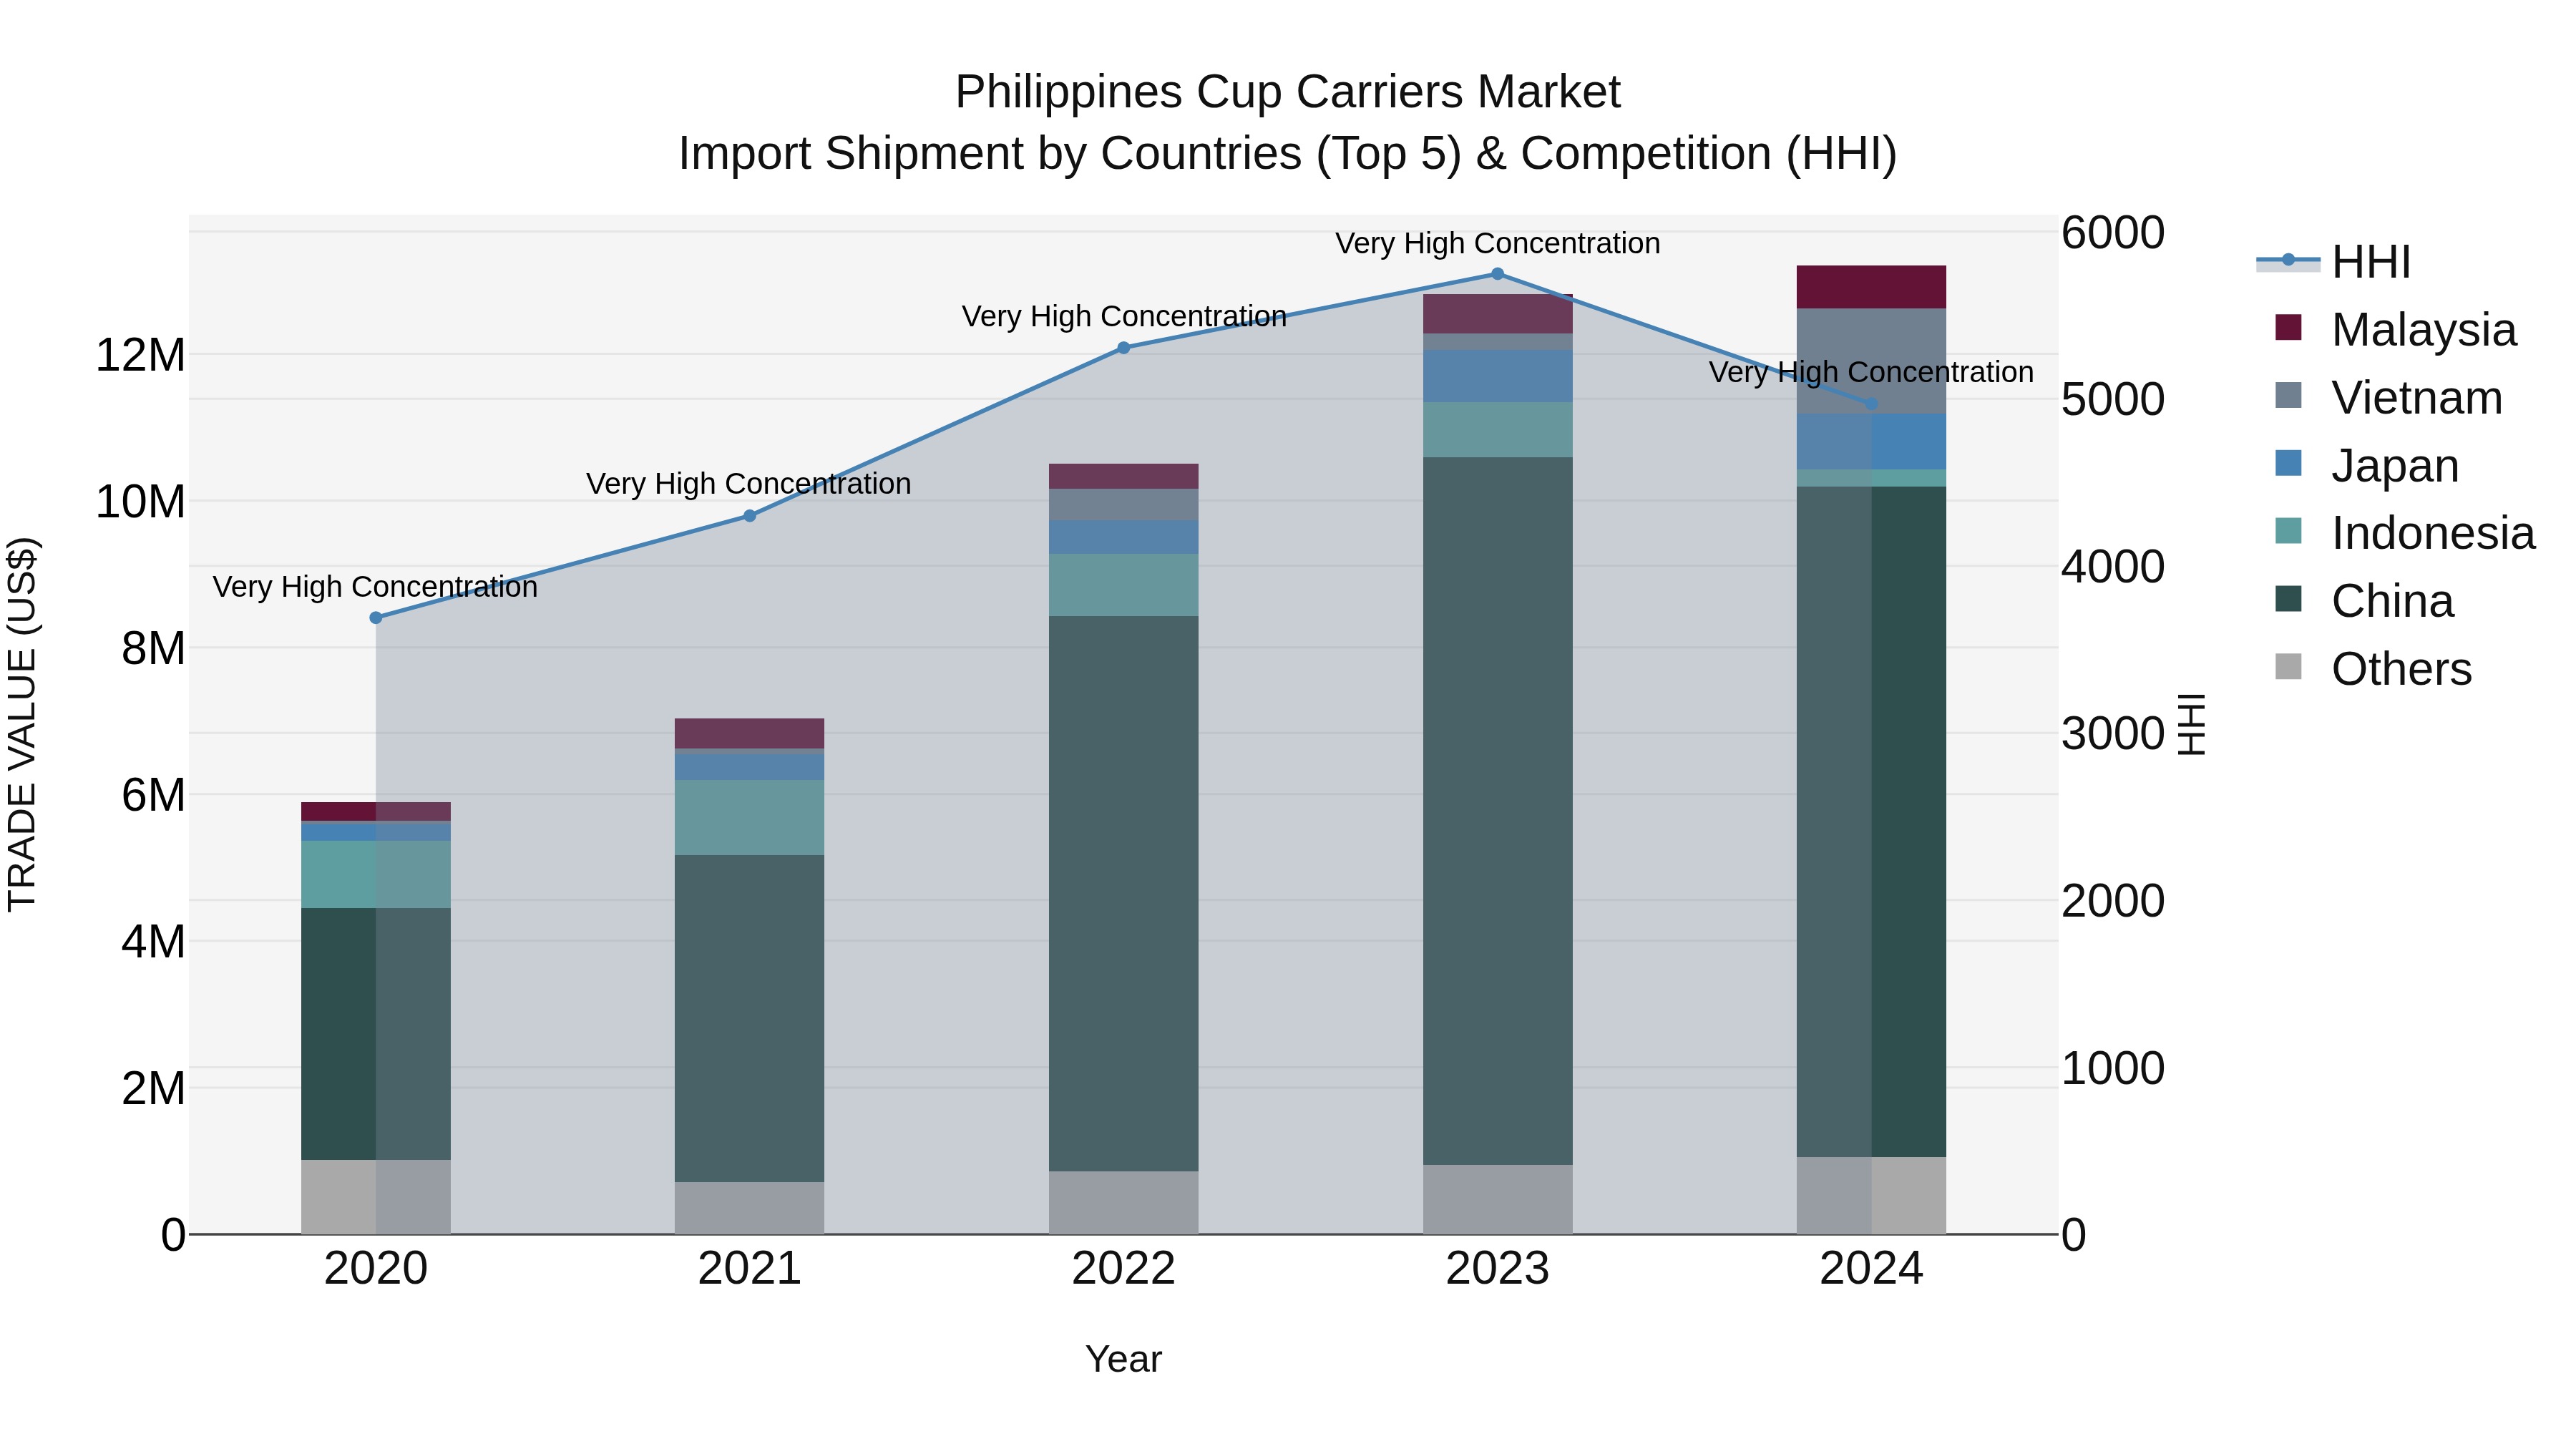
Philippines Cup Carriers Market Top 5 Importing Countries and Market Competition (HHI) Analysis
The Philippines cup carriers import market continued to witness strong growth in 2024, with top exporting countries including China, Vietnam, Japan, Malaysia, and Indonesia dominating the market. The high Herfindahl-Hirschman Index (HHI) indicates a concentrated market landscape, contributing to a competitive environment. With a notable compound annual growth rate (CAGR) of 22.34% from 2020 to 2024, the market is thriving. The modest growth rate of 3.01% from 2023 to 2024 suggests sustained expansion and opportunities for market players to capitalize on the growing demand for cup carriers in the Philippines.
Philippines Cup Carriers Market Synopsis
As takeaway beverages grow in popularity, especially among coffee chains and food delivery services, demand for eco-friendly and functional cup carriers is increasing. Both recycled paper and biodegradable variants are seeing traction, with several local manufacturers and packaging suppliers active in this space.
Trends of the market
The cup carriers market in the Philippines is growing in response to the expanding food delivery and takeaway culture, especially among coffee shops and fast-food chains. Sustainable and biodegradable materials are gaining preference as businesses and consumers seek eco-friendly alternatives. Custom branding is also driving demand for aesthetically pleasing and functional designs.
Challenges of the market
The cup carriers market is hindered by price-sensitive consumer behavior and limited adoption of sustainable materials. Many small food service operators prefer low-cost, non-biodegradable options due to cost constraints. Additionally, weak recycling infrastructure and lack of environmental regulations contribute to slow market transformation.
Investment opportunities in the Market
As the foodservice sector rebounds, theres a growing need for sustainable cup carriers. Investment in biodegradable or molded fiber carrier production presents a green packaging opportunity. Supplying fast food chains, cafes, and delivery services aligns with consumer demand for environmentally friendly alternatives.
Government Policy of the market
Manufacturers of cup carriers and disposable packaging are regulated under the Department of Trade and Industry (DTI) for product quality and compliance with industry standards. The environment-focused Department of Environment and Natural Resources (DENR) implements Extended Producers Responsibility (EPR) policies that promote recyclable or compostable carrier materials. Incentives are available for using sustainable alternatives under the Philippine Green Jobs Act.
Key Highlights of the Report:
- Philippines Cup Carriers Market Outlook
- Market Size of Philippines Cup Carriers Market, 2024
- Forecast of Philippines Cup Carriers Market, 2031
- Historical Data and Forecast of Philippines Cup Carriers Revenues & Volume for the Period 2021- 2031
- Philippines Cup Carriers Market Trend Evolution
- Philippines Cup Carriers Market Drivers and Challenges
- Philippines Cup Carriers Price Trends
- Philippines Cup Carriers Porter's Five Forces
- Philippines Cup Carriers Industry Life Cycle
- Historical Data and Forecast of Philippines Cup Carriers Market Revenues & Volume By Material for the Period 2021- 2031
- Historical Data and Forecast of Philippines Cup Carriers Market Revenues & Volume By Paper/Molded Fiber for the Period 2021- 2031
- Historical Data and Forecast of Philippines Cup Carriers Market Revenues & Volume By Plastic for the Period 2021- 2031
- Historical Data and Forecast of Philippines Cup Carriers Market Revenues & Volume By Others for the Period 2021- 2031
- Historical Data and Forecast of Philippines Cup Carriers Market Revenues & Volume By Number of Cups for the Period 2021- 2031
- Historical Data and Forecast of Philippines Cup Carriers Market Revenues & Volume By 1 to 2 for the Period 2021- 2031
- Historical Data and Forecast of Philippines Cup Carriers Market Revenues & Volume By 3 to 4 for the Period 2021- 2031
- Historical Data and Forecast of Philippines Cup Carriers Market Revenues & Volume By 5 to 6 for the Period 2021- 2031
- Historical Data and Forecast of Philippines Cup Carriers Market Revenues & Volume By Above 6 for the Period 2021- 2031
- Historical Data and Forecast of Philippines Cup Carriers Market Revenues & Volume By End Use for the Period 2021- 2031
- Historical Data and Forecast of Philippines Cup Carriers Market Revenues & Volume By Food Service Outlets for the Period 2021- 2031
- Historical Data and Forecast of Philippines Cup Carriers Market Revenues & Volume By Institutional Food Services for the Period 2021- 2031
- Historical Data and Forecast of Philippines Cup Carriers Market Revenues & Volume By Household Use for the Period 2021- 2031
- Philippines Cup Carriers Import Export Trade Statistics
- Market Opportunity Assessment By Material
- Market Opportunity Assessment By Number of Cups
- Market Opportunity Assessment By End Use
- Philippines Cup Carriers Top Companies Market Share
- Philippines Cup Carriers Competitive Benchmarking By Technical and Operational Parameters
- Philippines Cup Carriers Company Profiles
- Philippines Cup Carriers Key Strategic Recommendations
Frequently Asked Questions About the Market Study (FAQs):
6Wresearch actively monitors the Philippines Cup Carriers Market and publishes its comprehensive annual report, highlighting emerging trends, growth drivers, revenue analysis, and forecast outlook. Our insights help businesses to make data-backed strategic decisions with ongoing market dynamics. Our analysts track relevent industries related to the Philippines Cup Carriers Market, allowing our clients with actionable intelligence and reliable forecasts tailored to emerging regional needs.
Yes, we provide customisation as per your requirements. To learn more, feel free to contact us on sales@6wresearch.com
1 Executive Summary |
2 Introduction |
2.1 Key Highlights of the Report |
2.2 Report Description |
2.3 Market Scope & Segmentation |
2.4 Research Methodology |
2.5 Assumptions |
3 Philippines Cup Carriers Market Overview |
3.1 Philippines Country Macro Economic Indicators |
3.2 Philippines Cup Carriers Market Revenues & Volume, 2021 & 2031F |
3.3 Philippines Cup Carriers Market - Industry Life Cycle |
3.4 Philippines Cup Carriers Market - Porter's Five Forces |
3.5 Philippines Cup Carriers Market Revenues & Volume Share, By Material, 2021 & 2031F |
3.6 Philippines Cup Carriers Market Revenues & Volume Share, By Number of Cups, 2021 & 2031F |
3.7 Philippines Cup Carriers Market Revenues & Volume Share, By End Use, 2021 & 2031F |
4 Philippines Cup Carriers Market Dynamics |
4.1 Impact Analysis |
4.2 Market Drivers |
4.2.1 Increasing consumer preference for on-the-go food and beverages |
4.2.2 Growth in the food and beverage industry in the Philippines |
4.2.3 Rise in the number of food delivery services and outlets |
4.3 Market Restraints |
4.3.1 Competition from alternative packaging solutions like paper bags or eco-friendly options |
4.3.2 Fluctuations in raw material prices affecting production costs |
4.3.3 Regulatory challenges related to packaging materials and waste management |
5 Philippines Cup Carriers Market Trends |
6 Philippines Cup Carriers Market, By Types |
6.1 Philippines Cup Carriers Market, By Material |
6.1.1 Overview and Analysis |
6.1.2 Philippines Cup Carriers Market Revenues & Volume, By Material, 2021- 2031F |
6.1.3 Philippines Cup Carriers Market Revenues & Volume, By Paper/Molded Fiber, 2021- 2031F |
6.1.4 Philippines Cup Carriers Market Revenues & Volume, By Plastic, 2021- 2031F |
6.1.5 Philippines Cup Carriers Market Revenues & Volume, By Others, 2021- 2031F |
6.2 Philippines Cup Carriers Market, By Number of Cups |
6.2.1 Overview and Analysis |
6.2.2 Philippines Cup Carriers Market Revenues & Volume, By 1 to 2, 2021- 2031F |
6.2.3 Philippines Cup Carriers Market Revenues & Volume, By 3 to 4, 2021- 2031F |
6.2.4 Philippines Cup Carriers Market Revenues & Volume, By 5 to 6, 2021- 2031F |
6.2.5 Philippines Cup Carriers Market Revenues & Volume, By Above 6, 2021- 2031F |
6.3 Philippines Cup Carriers Market, By End Use |
6.3.1 Overview and Analysis |
6.3.2 Philippines Cup Carriers Market Revenues & Volume, By Food Service Outlets, 2021- 2031F |
6.3.3 Philippines Cup Carriers Market Revenues & Volume, By Institutional Food Services, 2021- 2031F |
6.3.4 Philippines Cup Carriers Market Revenues & Volume, By Household Use, 2021- 2031F |
7 Philippines Cup Carriers Market Import-Export Trade Statistics |
7.1 Philippines Cup Carriers Market Export to Major Countries |
7.2 Philippines Cup Carriers Market Imports from Major Countries |
8 Philippines Cup Carriers Market Key Performance Indicators |
8.1 Average number of food delivery orders per month in the Philippines |
8.2 Percentage of food and beverage companies using cup carriers for their products |
8.3 Consumer satisfaction ratings for food and beverage packaging convenience |
9 Philippines Cup Carriers Market - Opportunity Assessment |
9.1 Philippines Cup Carriers Market Opportunity Assessment, By Material, 2021 & 2031F |
9.2 Philippines Cup Carriers Market Opportunity Assessment, By Number of Cups, 2021 & 2031F |
9.3 Philippines Cup Carriers Market Opportunity Assessment, By End Use, 2021 & 2031F |
10 Philippines Cup Carriers Market - Competitive Landscape |
10.1 Philippines Cup Carriers Market Revenue Share, By Companies, 2024 |
10.2 Philippines Cup Carriers Market Competitive Benchmarking, By Operating and Technical Parameters |
11 Company Profiles |
12 Recommendations |
13 Disclaimer |
Global Go To Market Strategy - 2030
Export potential enables firms to identify high-growth global markets with greater confidence by combining advanced trade intelligence with a structured quantitative methodology. The framework analyzes emerging demand trends and country-level import patterns while integrating macroeconomic and trade datasets such as GDP and population forecasts, bilateral import–export flows, tariff structures, elasticity differentials between developed and developing economies, geographic distance, and import demand projections. Using weighted trade values from 2020–2024 as the base period to project country-to-country export potential for 2030, these inputs are operationalized through calculated drivers such as gravity model parameters, tariff impact factors, and projected GDP per-capita growth. Through an analysis of hidden potentials, demand hotspots, and market conditions that are most favorable to success, this method enables firms to focus on target countries, maximize returns, and global expansion with data, backed by accuracy.
By factoring in the projected importer demand gap that is currently unmet and could be potential opportunity, it identifies the potential for the Exporter (Country) among 190 countries, against the general trade analysis, which identifies the biggest importer or exporter.
To discover high-growth global markets and optimize your business strategy:
Click Here
Pricing
- Single User License$ 1,995
- Department License$ 2,400
- Site License$ 3,120
- Global License$ 3,795

Leadership Perspectives from Industry Events
Search
Thought Leadership and Analyst Meet


Our Clients
6WResearch In News
- Doha a strategic location for EV manufacturing hub: IPA Qatar
- Demand for luxury TVs surging in the GCC, says Samsung
- Empowering Growth: The Thriving Journey of Bangladesh’s Cable Industry
- Demand for luxury TVs surging in the GCC, says Samsung
- Video call with a traditional healer? Once unthinkable, it’s now common in South Africa
- Intelligent Buildings To Smooth GCC’s Path To Net Zero
Latest Reports
- New Zealand Aseptic Manufacturing Market (2026-2032)
- Netherlands Aseptic Manufacturing Market (2026-2032)
- Nauru Aseptic Manufacturing Market (2026-2032)
- Namibia Aseptic Manufacturing Market (2026-2032)
- Mozambique Aseptic Manufacturing Market (2026-2032)
- Montenegro Aseptic Manufacturing Market (2026-2032)
- Mongolia Aseptic Manufacturing Market (2026-2032)
- Monaco Aseptic Manufacturing Market (2026-2032)
- Micronesia Aseptic Manufacturing Market (2026-2032)
- Mauritius Aseptic Manufacturing Market (2026-2032)
Industry Events and Analyst Meet

HIMTEX 2026

India Refining Summit 2026

India EV Show 2026

EV tech India Expo 2026

Auto Tech Asia 2026
Whitepaper
- Middle East & Africa Commercial Security Market Click here to view more.
- Middle East & Africa Fire Safety Systems & Equipment Market Click here to view more.
- GCC Drone Market Click here to view more.
- Middle East Lighting Fixture Market Click here to view more.
- GCC Physical & Perimeter Security Market Click here to view more.