Philippines Fluid Loss Additive Market (2025-2031) | Competitive Landscape, Analysis, Growth, Trends, Segmentation, Companies, Outlook, Share, Industry, Value, Forecast, Size & Revenue
Market Forecast By Type (Synthetic, Natural, Synthetically Modified Natural), By Application (Drilling Fluid, Cement Slurry) And Competitive Landscape
| Product Code: ETC8841440 | Publication Date: Sep 2024 | Updated Date: Nov 2025 | Product Type: Market Research Report | |
| Publisher: 6Wresearch | Author: Sumit Sagar | No. of Pages: 75 | No. of Figures: 35 | No. of Tables: 20 |
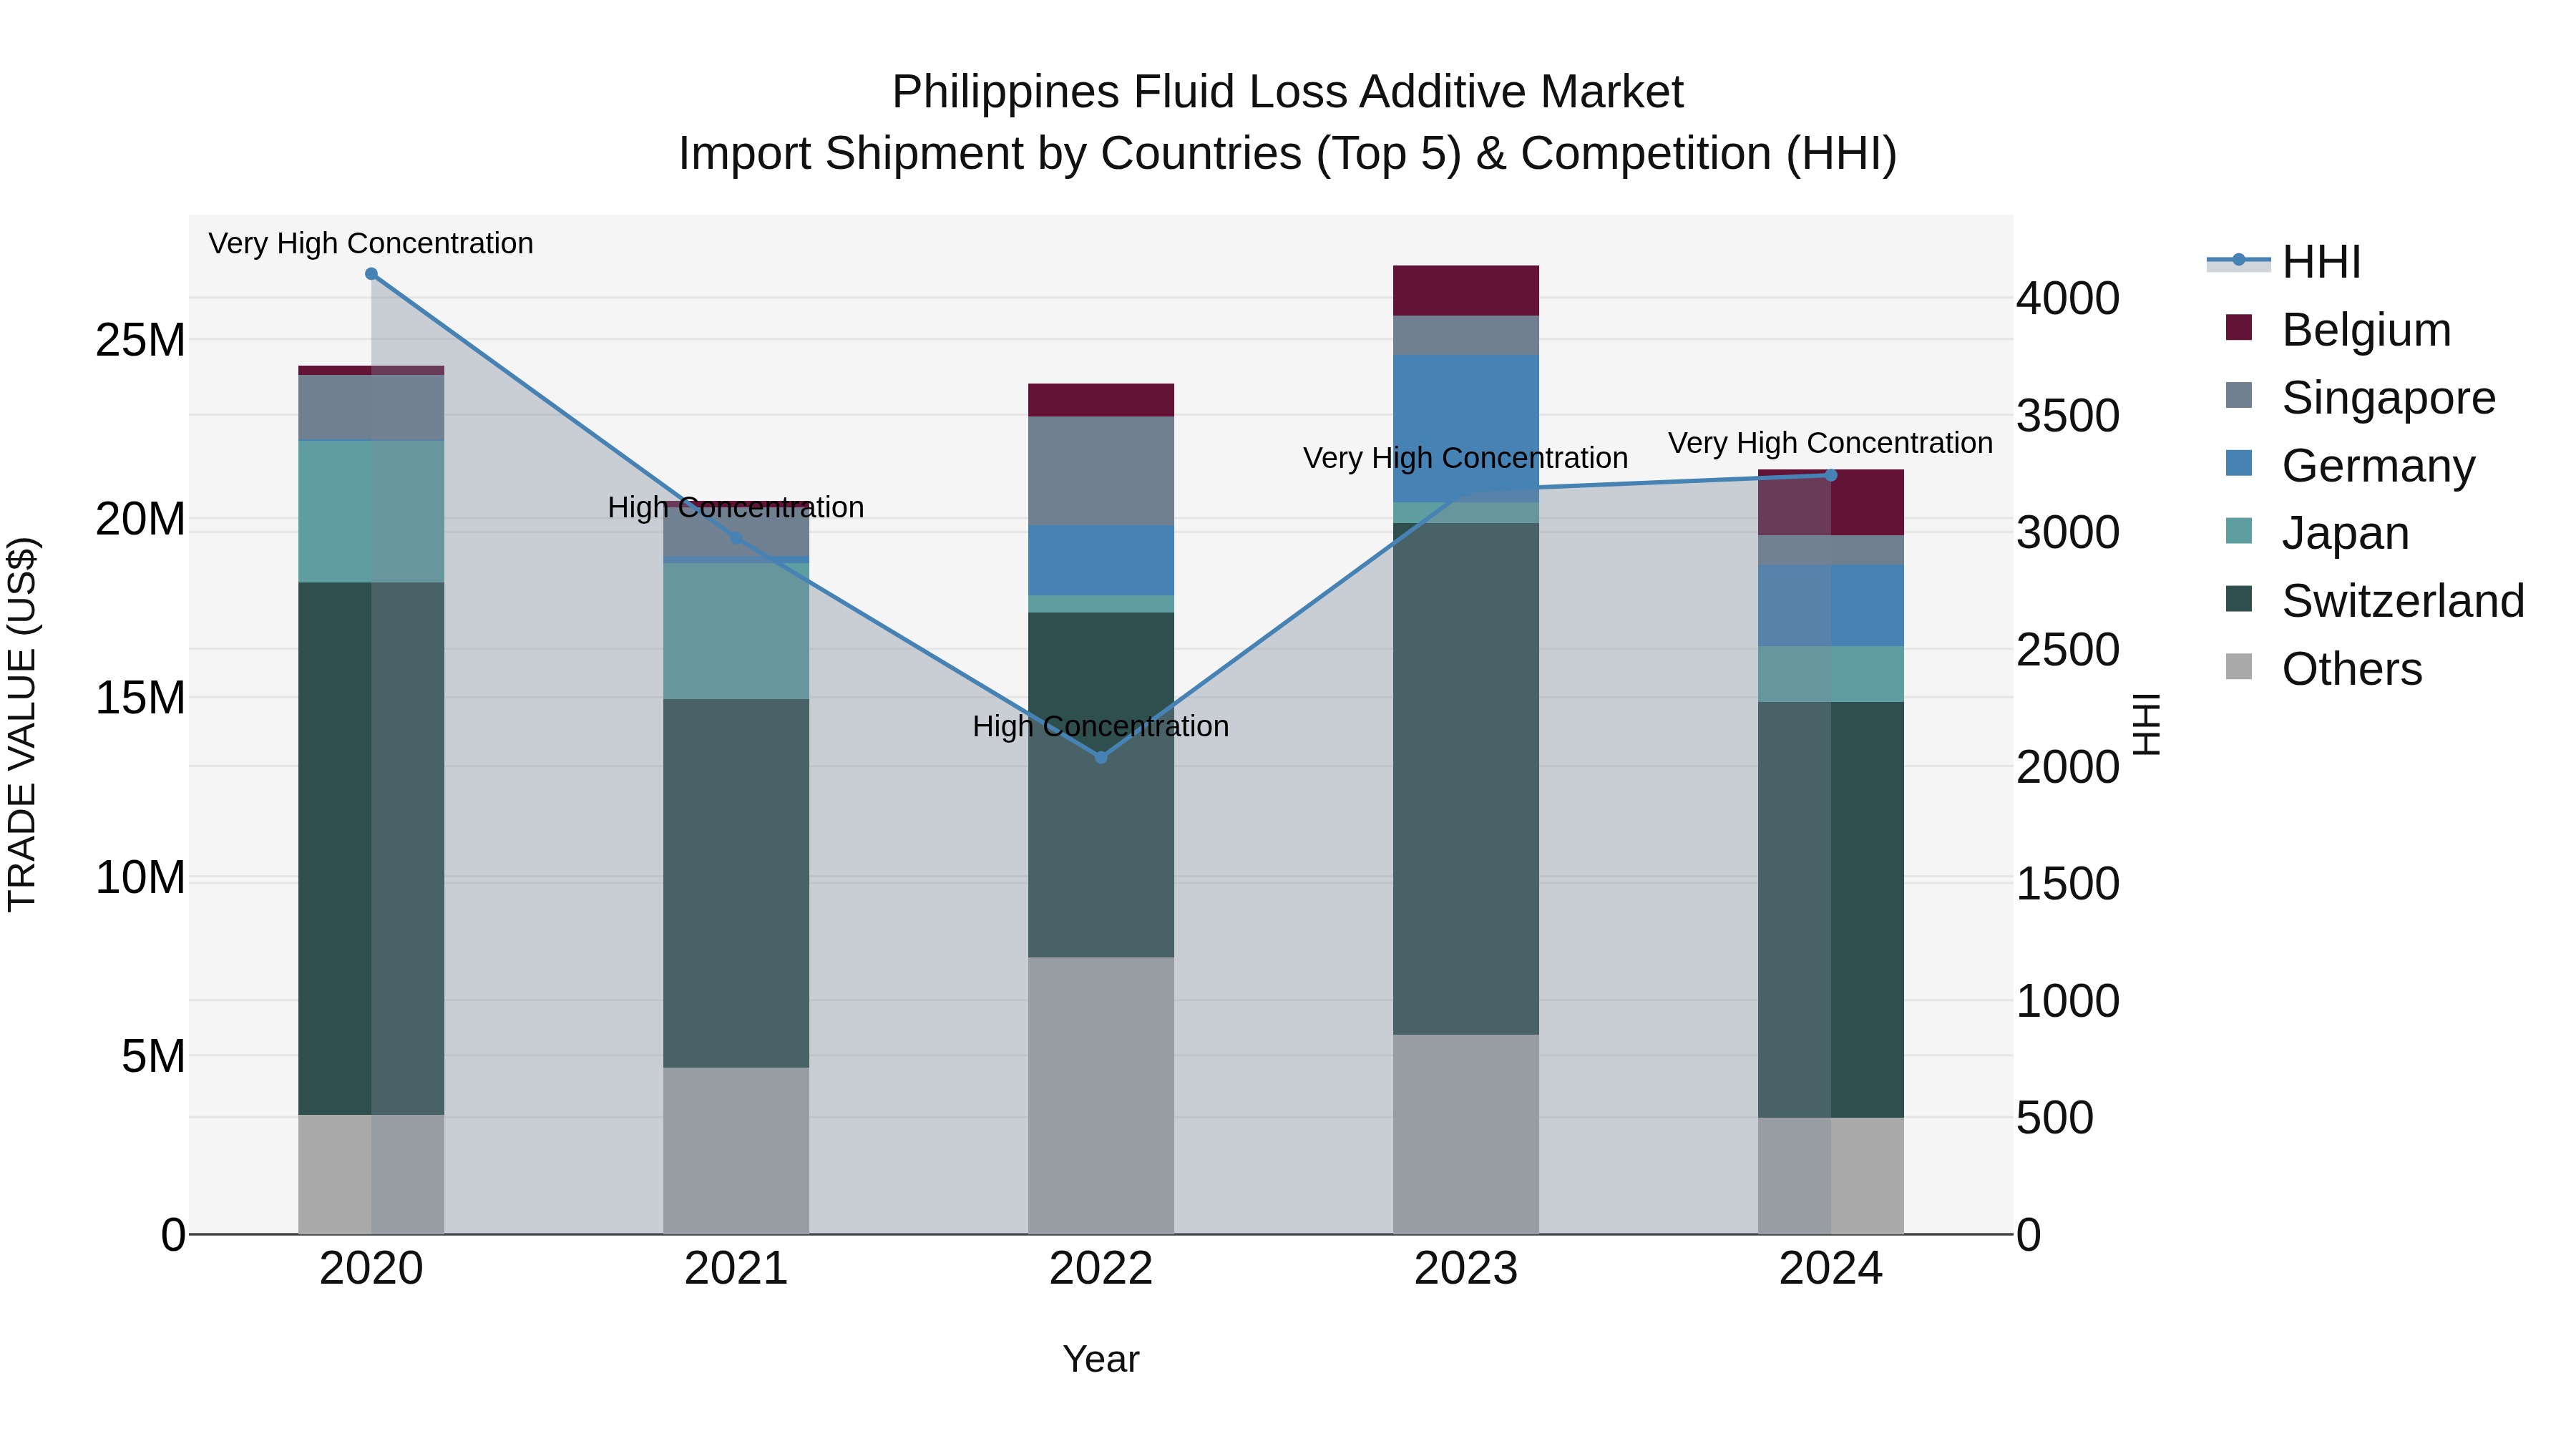
Philippines Fluid Loss Additive Market Top 5 Importing Countries and Market Competition (HHI) Analysis
In 2024, the Philippines saw a decline in fluid loss additive import shipments with a negative CAGR of -3.12% from 2020 to 2024. Despite the top exporting countries to the Philippines being Switzerland, Germany, Belgium, Japan, and the USA, the market remained highly concentrated with a high Herfindahl-Hirschman Index (HHI). The growth rate from 2023 to 2024 further decreased by -21.04%, indicating a challenging year for the industry. It will be important to monitor these trends closely to understand the factors impacting the fluid loss additive market in the Philippines.
Philippines Fluid Loss Additive Market Synopsis
The fluid loss additive market is essential to the country`s oil and gas and geothermal drilling industries. These additives prevent the loss of drilling fluids into porous formations, thereby enhancing wellbore stability and efficiency. As the Philippines continues to explore energy self-sufficiency through offshore and onshore resources, demand for these additives is expected to remain strong.
Trends of the market
The fluid loss additive market in the Philippines is closely tied to the growing oil and gas exploration and drilling sectors. Fluid loss additives are crucial in preventing fluid loss during drilling operations, ensuring efficient and effective extraction. The increasing number of exploration projects, along with advancements in drilling technology, is driving demand for specialized fluid additives that enhance performance and reduce operational costs, especially in offshore drilling.
Challenges of the market
The Fluid Loss Additive market in the Philippines faces challenges stemming from the volatile prices of raw materials used in manufacturing additives. As global supply chains fluctuate, local manufacturers may experience significant price hikes, which impact their profitability. Moreover, the adoption of fluid loss additives in various industries, such as construction and oil exploration, remains relatively low, mainly due to a lack of awareness about the performance benefits of these additives. Additionally, there is often insufficient regulatory oversight, which can lead to quality control issues with locally produced additives.
Investment opportunities in the Market
In the Philippines, the fluid loss additive market is crucial for industries such as oil and gas, where these additives help to control fluid loss during drilling operations. As drilling activities increase, there is a significant opportunity to invest in advanced fluid loss additives that offer better performance in extreme conditions. Companies that focus on eco-friendly additives or those that enhance the efficiency of drilling operations are likely to find a competitive edge in this growing market.
Government Policy of the market
The fluid loss additive market in the Philippines is significant within the oil and gas industry, where drilling operations require materials that minimize fluid loss. Government oversight ensures that such additives comply with environmental safety standards and do not contaminate soil or groundwater. Policies also encourage the use of more eco-friendly additives and promote research into advanced formulations to improve drilling efficiency while protecting the environment.
Key Highlights of the Report:
- Philippines Fluid Loss Additive Market Outlook
- Market Size of Philippines Fluid Loss Additive Market, 2024
- Forecast of Philippines Fluid Loss Additive Market, 2031
- Historical Data and Forecast of Philippines Fluid Loss Additive Revenues & Volume for the Period 2021- 2031
- Philippines Fluid Loss Additive Market Trend Evolution
- Philippines Fluid Loss Additive Market Drivers and Challenges
- Philippines Fluid Loss Additive Price Trends
- Philippines Fluid Loss Additive Porter's Five Forces
- Philippines Fluid Loss Additive Industry Life Cycle
- Historical Data and Forecast of Philippines Fluid Loss Additive Market Revenues & Volume By Type for the Period 2021- 2031
- Historical Data and Forecast of Philippines Fluid Loss Additive Market Revenues & Volume By Synthetic for the Period 2021- 2031
- Historical Data and Forecast of Philippines Fluid Loss Additive Market Revenues & Volume By Natural for the Period 2021- 2031
- Historical Data and Forecast of Philippines Fluid Loss Additive Market Revenues & Volume By Synthetically Modified Natural for the Period 2021- 2031
- Historical Data and Forecast of Philippines Fluid Loss Additive Market Revenues & Volume By Application for the Period 2021- 2031
- Historical Data and Forecast of Philippines Fluid Loss Additive Market Revenues & Volume By Drilling Fluid for the Period 2021- 2031
- Historical Data and Forecast of Philippines Fluid Loss Additive Market Revenues & Volume By Cement Slurry for the Period 2021- 2031
- Philippines Fluid Loss Additive Import Export Trade Statistics
- Market Opportunity Assessment By Type
- Market Opportunity Assessment By Application
- Philippines Fluid Loss Additive Top Companies Market Share
- Philippines Fluid Loss Additive Competitive Benchmarking By Technical and Operational Parameters
- Philippines Fluid Loss Additive Company Profiles
- Philippines Fluid Loss Additive Key Strategic Recommendations
Frequently Asked Questions About the Market Study (FAQs):
6Wresearch actively monitors the Philippines Fluid Loss Additive Market and publishes its comprehensive annual report, highlighting emerging trends, growth drivers, revenue analysis, and forecast outlook. Our insights help businesses to make data-backed strategic decisions with ongoing market dynamics. Our analysts track relevent industries related to the Philippines Fluid Loss Additive Market, allowing our clients with actionable intelligence and reliable forecasts tailored to emerging regional needs.
Yes, we provide customisation as per your requirements. To learn more, feel free to contact us on sales@6wresearch.com
1 Executive Summary |
2 Introduction |
2.1 Key Highlights of the Report |
2.2 Report Description |
2.3 Market Scope & Segmentation |
2.4 Research Methodology |
2.5 Assumptions |
3 Philippines Fluid Loss Additive Market Overview |
3.1 Philippines Country Macro Economic Indicators |
3.2 Philippines Fluid Loss Additive Market Revenues & Volume, 2021 & 2031F |
3.3 Philippines Fluid Loss Additive Market - Industry Life Cycle |
3.4 Philippines Fluid Loss Additive Market - Porter's Five Forces |
3.5 Philippines Fluid Loss Additive Market Revenues & Volume Share, By Type, 2021 & 2031F |
3.6 Philippines Fluid Loss Additive Market Revenues & Volume Share, By Application, 2021 & 2031F |
4 Philippines Fluid Loss Additive Market Dynamics |
4.1 Impact Analysis |
4.2 Market Drivers |
4.3 Market Restraints |
5 Philippines Fluid Loss Additive Market Trends |
6 Philippines Fluid Loss Additive Market, By Types |
6.1 Philippines Fluid Loss Additive Market, By Type |
6.1.1 Overview and Analysis |
6.1.2 Philippines Fluid Loss Additive Market Revenues & Volume, By Type, 2021- 2031F |
6.1.3 Philippines Fluid Loss Additive Market Revenues & Volume, By Synthetic, 2021- 2031F |
6.1.4 Philippines Fluid Loss Additive Market Revenues & Volume, By Natural, 2021- 2031F |
6.1.5 Philippines Fluid Loss Additive Market Revenues & Volume, By Synthetically Modified Natural, 2021- 2031F |
6.2 Philippines Fluid Loss Additive Market, By Application |
6.2.1 Overview and Analysis |
6.2.2 Philippines Fluid Loss Additive Market Revenues & Volume, By Drilling Fluid, 2021- 2031F |
6.2.3 Philippines Fluid Loss Additive Market Revenues & Volume, By Cement Slurry, 2021- 2031F |
7 Philippines Fluid Loss Additive Market Import-Export Trade Statistics |
7.1 Philippines Fluid Loss Additive Market Export to Major Countries |
7.2 Philippines Fluid Loss Additive Market Imports from Major Countries |
8 Philippines Fluid Loss Additive Market Key Performance Indicators |
9 Philippines Fluid Loss Additive Market - Opportunity Assessment |
9.1 Philippines Fluid Loss Additive Market Opportunity Assessment, By Type, 2021 & 2031F |
9.2 Philippines Fluid Loss Additive Market Opportunity Assessment, By Application, 2021 & 2031F |
10 Philippines Fluid Loss Additive Market - Competitive Landscape |
10.1 Philippines Fluid Loss Additive Market Revenue Share, By Companies, 2024 |
10.2 Philippines Fluid Loss Additive Market Competitive Benchmarking, By Operating and Technical Parameters |
11 Company Profiles |
12 Recommendations |
13 Disclaimer |
Export potential assessment - trade Analytics for 2030
Export potential enables firms to identify high-growth global markets with greater confidence by combining advanced trade intelligence with a structured quantitative methodology. The framework analyzes emerging demand trends and country-level import patterns while integrating macroeconomic and trade datasets such as GDP and population forecasts, bilateral import–export flows, tariff structures, elasticity differentials between developed and developing economies, geographic distance, and import demand projections. Using weighted trade values from 2020–2024 as the base period to project country-to-country export potential for 2030, these inputs are operationalized through calculated drivers such as gravity model parameters, tariff impact factors, and projected GDP per-capita growth. Through an analysis of hidden potentials, demand hotspots, and market conditions that are most favorable to success, this method enables firms to focus on target countries, maximize returns, and global expansion with data, backed by accuracy.
By factoring in the projected importer demand gap that is currently unmet and could be potential opportunity, it identifies the potential for the Exporter (Country) among 190 countries, against the general trade analysis, which identifies the biggest importer or exporter.
To discover high-growth global markets and optimize your business strategy:
Click Here
Pricing
- Single User License$ 1,995
- Department License$ 2,400
- Site License$ 3,120
- Global License$ 3,795

Search
Thought Leadership and Analyst Meet


Our Clients
Latest Reports
- Taiwan Food Delivery Platform Market (2026-2032) | Companies, Outlook, Analysis, Trends, Value, Revenue, Segmentation, Share, Forecast, Competitive Landscape, Growth, Size & Forecast
- United Kingdom (UK) Long-term Care Insurance Market (2026-2032) | Growth, Share, Consumer Insights, Drivers, Opportunities, Competition, Pricing Analysis, Segments, Restraints, Companies, Competitive, Value, Outlook, Size, Demand, Analysis, Challenges, Strategic Insights, Investment Trends, Revenue, Trends, Supply, Forecast
- United Kingdom (UK) Long Term Care Market (2026-2032) | Companies, Outlook, Analysis, Trends, Value, Revenue, Segmentation, Share, Forecast, Competitive Landscape, Growth, Size & Forecast
- Iraq Insulation and Waterproofing Market (2026-2032) | Outlook, Drivers, Growth, Size, Share, Industry, Revenue, Trends, Demand, Competitive, Strategic Insights, Opportunities, Segments, Companies, Challenges, Strategy, Consumer Insights, Analysis, Investment Trends, Value, Segmentation, Forecast, Restraints
- India Switchgear Market Outlook (2026-2032) | Size, Share, Trends, Growth, Revenue, Forecast, Analysis, Value, Outlook
- Pakistan Contraceptive Implants Market (2025-2031) | Demand, Growth, Size, Share, Industry, Pricing Analysis, Competitive, Strategic Insights, Strategy, Consumer Insights, Analysis, Investment Trends, Opportunities, Revenue, Segments, Value, Segmentation, Supply, Forecast, Restraints, Outlook, Competition, Drivers, Trends, Companies, Challenges
- Sri Lanka Packaging Market (2026-2032) | Outlook, Competition, Drivers, Trends, Demand, Pricing Analysis, Competitive, Strategic Insights, Companies, Challenges, Strategy, Consumer Insights, Analysis, Investment Trends, Opportunities, Growth, Size, Share, Industry, Revenue, Segments, Value, Segmentation, Supply, Forecast, Restraints
- India Kids Watches Market (2026-2032) | Strategy, Consumer Insights, Analysis, Investment Trends, Opportunities, Growth, Size, Share, Industry, Revenue, Segments, Value, Segmentation, Supply, Forecast, Restraints, Outlook, Competition, Drivers, Trends, Demand, Pricing Analysis, Competitive, Strategic Insights, Companies, Challenges
- Saudi Arabia Core Assurance Service Market (2025-2031) | Strategy, Consumer Insights, Analysis, Investment Trends, Opportunities, Growth, Size, Share, Industry, Revenue, Segments, Value, Segmentation, Supply, Forecast, Restraints, Outlook, Competition, Drivers, Trends, Demand, Pricing Analysis, Competitive, Strategic Insights, Companies, Challenges
- Romania Uninterruptible Power Supply (UPS) Market (2026-2032) | Industry, Analysis, Revenue, Size, Forecast, Outlook, Value, Trends, Share, Growth & Companies
Industry Events and Analyst Meet

India EV Show 2026

EV tech India Expo 2026

Auto Tech Asia 2026

Battery Tech India 2026

Smart Production Solutions Guangzhou 2026
Whitepaper
- Middle East & Africa Commercial Security Market Click here to view more.
- Middle East & Africa Fire Safety Systems & Equipment Market Click here to view more.
- GCC Drone Market Click here to view more.
- Middle East Lighting Fixture Market Click here to view more.
- GCC Physical & Perimeter Security Market Click here to view more.
6WResearch In News
- Doha a strategic location for EV manufacturing hub: IPA Qatar
- Demand for luxury TVs surging in the GCC, says Samsung
- Empowering Growth: The Thriving Journey of Bangladesh’s Cable Industry
- Demand for luxury TVs surging in the GCC, says Samsung
- Video call with a traditional healer? Once unthinkable, it’s now common in South Africa
- Intelligent Buildings To Smooth GCC’s Path To Net Zero