Philippines Non-Dairy Toppings Market (2025-2031) | Share, Competitive Landscape, Value, Analysis, Industry, Forecast, Outlook, Companies, Size & Revenue, Growth, Trends, Segmentation
Market Forecast By Type (Whip Cream, Pouring Cream, Spooning, Others), By Form (Liquid, Powder, Frozen), By Base Ingredient (Soy Milk, Vegetable Oil, Almond Milk, Coconut Milk, Others), By Application (Bakery, Confectionery, Processed Fruits, Frozen Desserts, Beverage, Others), By Distribution Channel (Specialty Food Stores, E-Commerce, Modern Stores, Others) And Competitive Landscape
| Product Code: ETC8846802 | Publication Date: Sep 2024 | Updated Date: Nov 2025 | Product Type: Market Research Report | |
| Publisher: 6Wresearch | Author: Shubham Deep | No. of Pages: 75 | No. of Figures: 35 | No. of Tables: 20 |
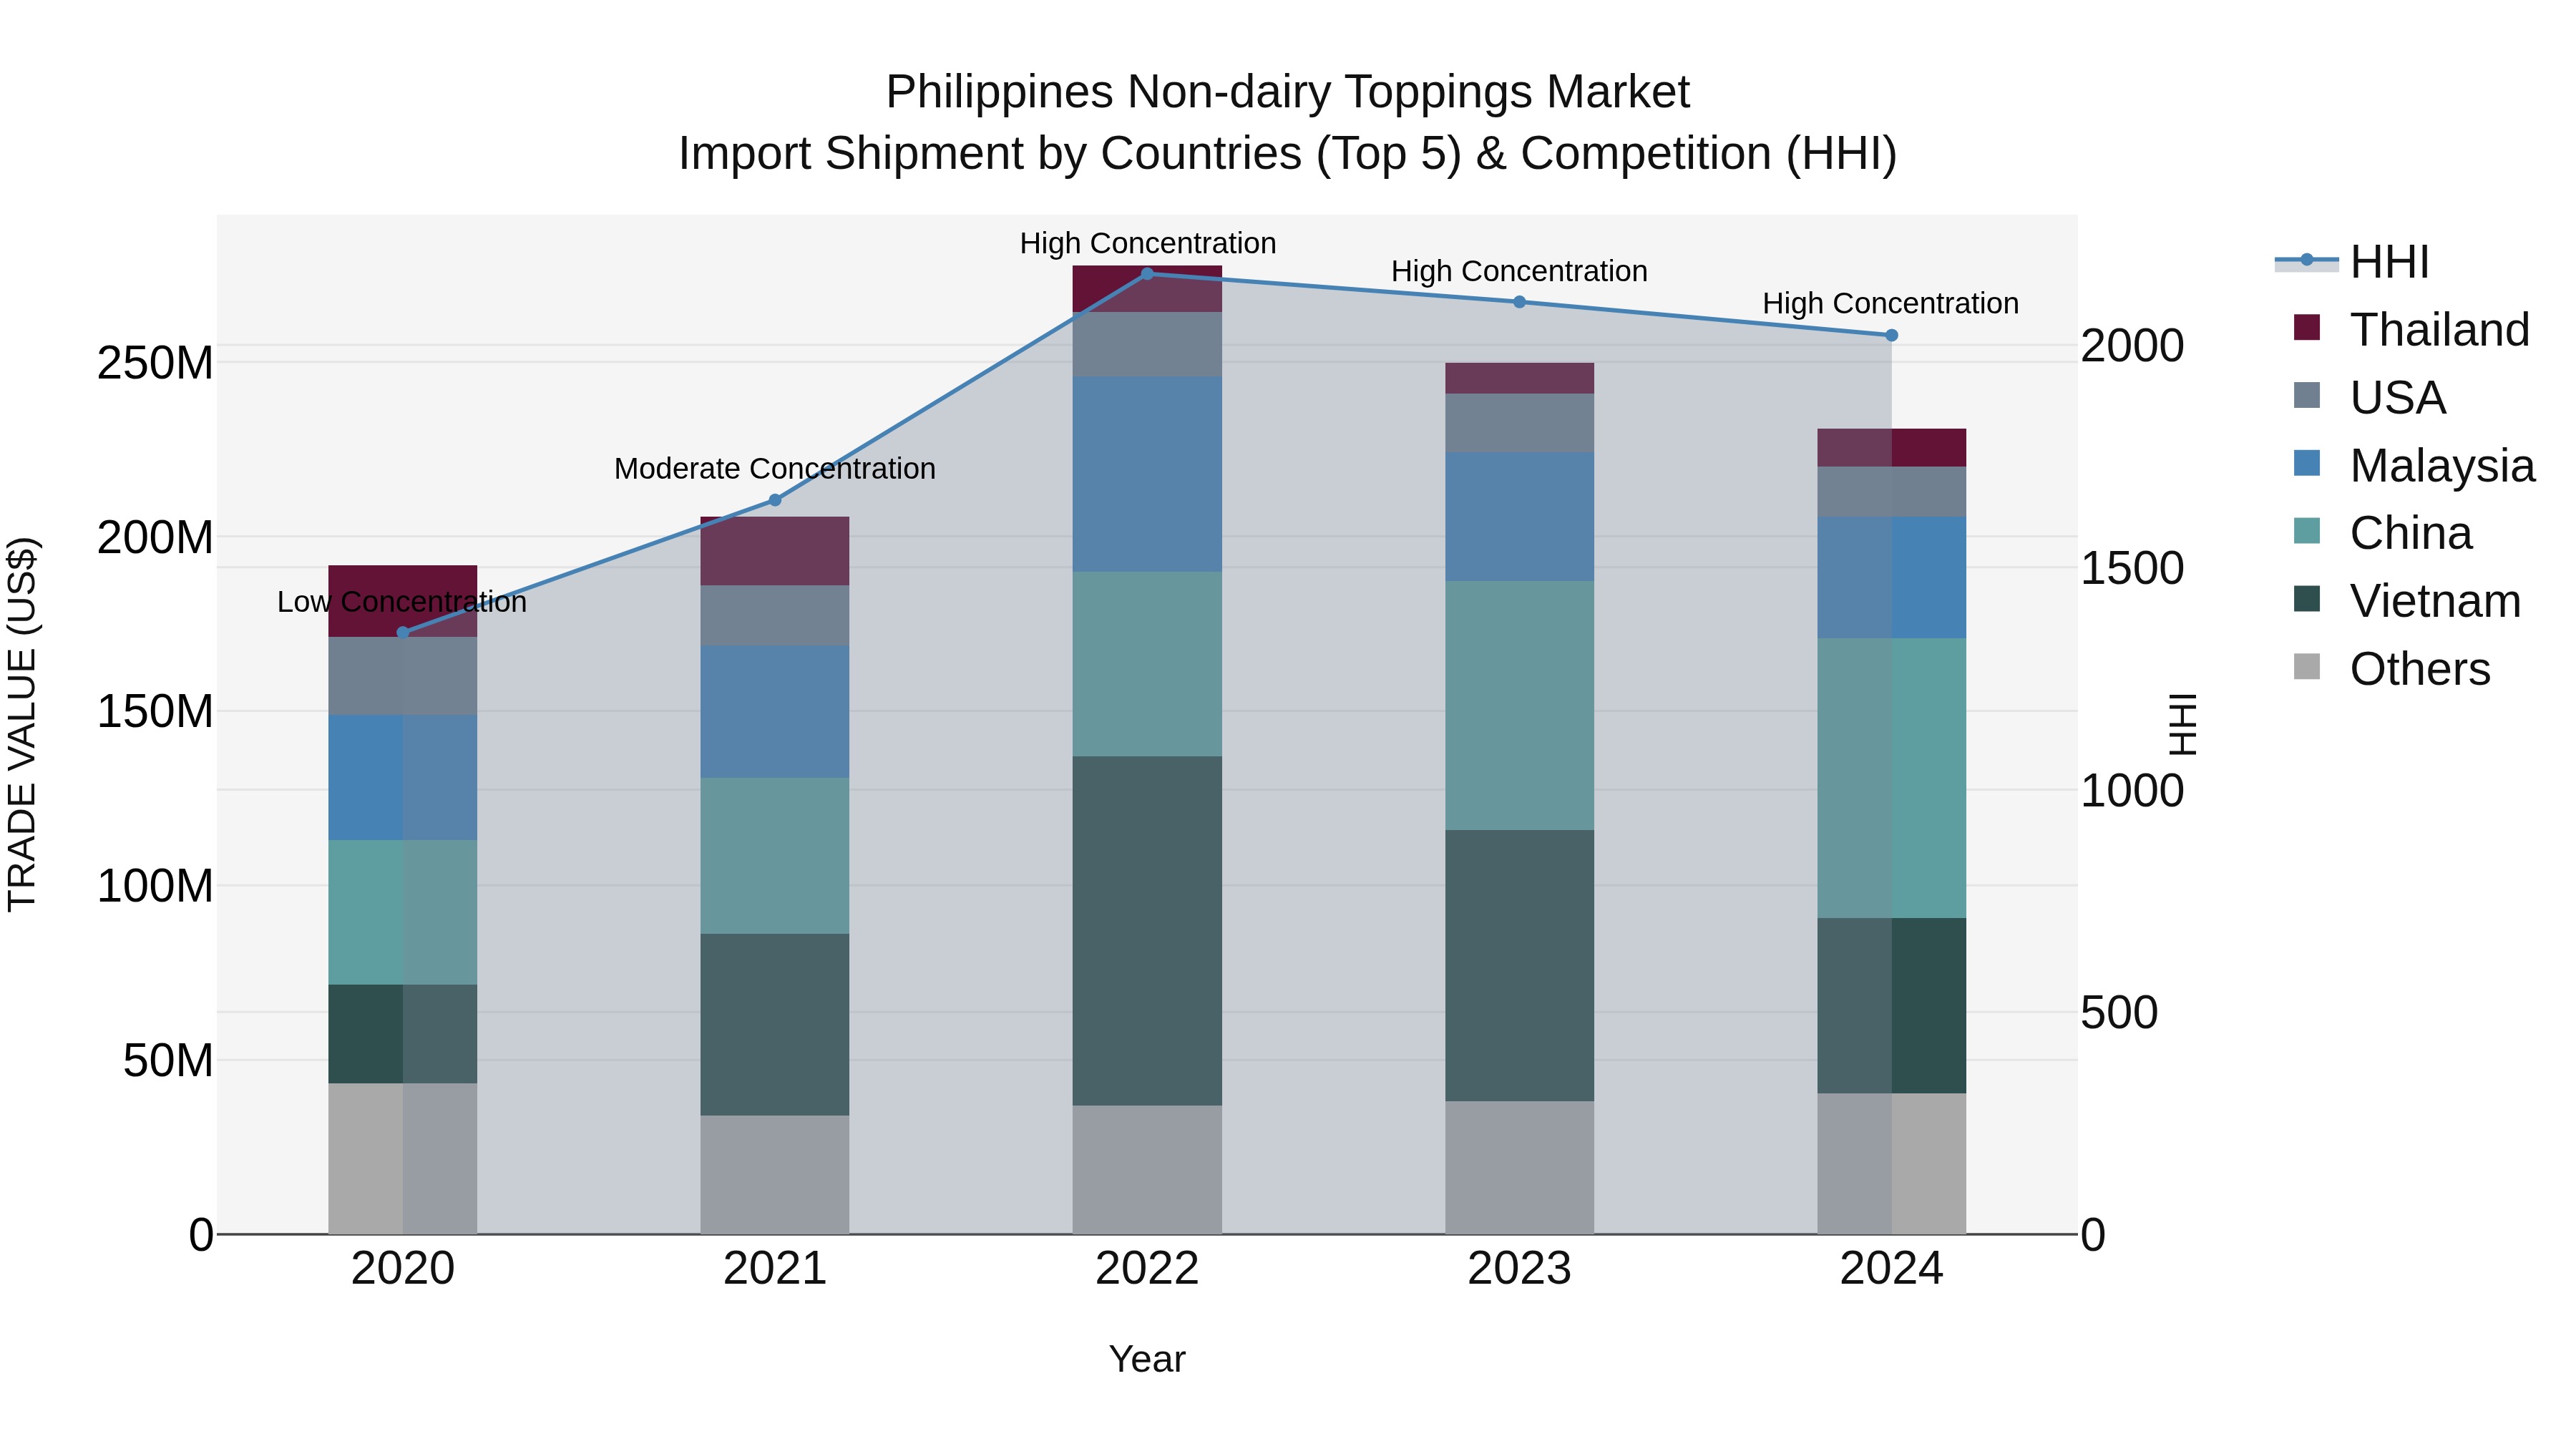
Philippines Non Dairy Toppings Market Top 5 Importing Countries and Market Competition (HHI) Analysis
Despite a slight decline in growth rate in 2024, the Philippines continues to see a steady increase in non-dairy toppings import shipments. The top exporting countries to the Philippines remain consistent, with China, Vietnam, Malaysia, Indonesia, and the USA leading the way. The high Herfindahl-Hirschman Index (HHI) indicates a concentrated market, while the moderate compound annual growth rate (CAGR) of 4.76% from 2020-2024 suggests sustained expansion. Overall, the Philippines` reliance on these key exporting countries reflects the country`s growing demand for non-dairy toppings in the market.
Philippines Non-Dairy Toppings Market Overview
The non-dairy toppings market in the Philippines caters to the growing demand for plant-based alternatives to traditional dairy toppings such as whipped cream, cheese shreds, and butter. These toppings, made from coconut, soy, or almond-based ingredients, are particularly popular in desserts, coffees, and savory dishes. As consumer preferences shift toward vegan and lactose-free options, the market is expanding, with innovative product offerings designed to mimic the taste and texture of their dairy counterparts.
Drivers of the market
The non-dairy toppings market in the Philippines benefits from the increasing preference for plant-based diets and lactose-free alternatives. Non-dairy creamers, whipped creams, and other toppings derived from coconut, soy, and almond milks are gaining traction, particularly in the hospitality and food service industries. The growing popularity of vegan desserts, smoothies, and beverages has led to a rise in demand for non-dairy toppings. Furthermore, the versatility of these non-dairy toppings in terms of flavor and texture is a major driving force behind the market`s growth.
Challenges of the market
The Philippines non-dairy toppings market encounters challenges related to product stability, shelf life, and cost. Non-dairy toppings, especially those made from plant-based ingredients, often require specific storage conditions to maintain their texture and quality. This increases logistical challenges and costs for retailers. Additionally, consumer awareness about non-dairy toppings remains relatively low, slowing adoption in both household and commercial settings.
Investment opportunities in the Market
The demand for plant-based alternatives in the food industry provides investment opportunities in non-dairy toppings. Investors can explore manufacturing plant-based whipped creams, cheese shreds, and dessert toppings. Developing innovative formulations to match traditional dairy-based products can attract a larger consumer base. Partnerships with bakeries, cafes, and quick-service restaurants can provide a stable market for these products, while retail expansion in supermarkets and online platforms can drive further growth.
Government Policy of the market
Government initiatives promoting plant-based alternatives and sustainable food production support the non-dairy toppings market. The FDA mandates strict compliance with food labeling and safety standards to protect consumers. The Department of Trade and Industry (DTI) offers support for SMEs producing dairy-free toppings, including financial grants and market access assistance. The government also encourages investments in food processing technologies that enhance the quality and shelf life of non-dairy toppings.
Key Highlights of the Report:
- Philippines Non-Dairy Toppings Market Outlook
- Market Size of Philippines Non-Dairy Toppings Market, 2024
- Forecast of Philippines Non-Dairy Toppings Market, 2031
- Historical Data and Forecast of Philippines Non-Dairy Toppings Revenues & Volume for the Period 2021- 2031
- Philippines Non-Dairy Toppings Market Trend Evolution
- Philippines Non-Dairy Toppings Market Drivers and Challenges
- Philippines Non-Dairy Toppings Price Trends
- Philippines Non-Dairy Toppings Porter's Five Forces
- Philippines Non-Dairy Toppings Industry Life Cycle
- Historical Data and Forecast of Philippines Non-Dairy Toppings Market Revenues & Volume By Type for the Period 2021- 2031
- Historical Data and Forecast of Philippines Non-Dairy Toppings Market Revenues & Volume By Whip Cream for the Period 2021- 2031
- Historical Data and Forecast of Philippines Non-Dairy Toppings Market Revenues & Volume By Pouring Cream for the Period 2021- 2031
- Historical Data and Forecast of Philippines Non-Dairy Toppings Market Revenues & Volume By Spooning for the Period 2021- 2031
- Historical Data and Forecast of Philippines Non-Dairy Toppings Market Revenues & Volume By Others for the Period 2021- 2031
- Historical Data and Forecast of Philippines Non-Dairy Toppings Market Revenues & Volume By Form for the Period 2021- 2031
- Historical Data and Forecast of Philippines Non-Dairy Toppings Market Revenues & Volume By Liquid for the Period 2021- 2031
- Historical Data and Forecast of Philippines Non-Dairy Toppings Market Revenues & Volume By Powder for the Period 2021- 2031
- Historical Data and Forecast of Philippines Non-Dairy Toppings Market Revenues & Volume By Frozen for the Period 2021- 2031
- Historical Data and Forecast of Philippines Non-Dairy Toppings Market Revenues & Volume By Base Ingredient for the Period 2021- 2031
- Historical Data and Forecast of Philippines Non-Dairy Toppings Market Revenues & Volume By Soy Milk for the Period 2021- 2031
- Historical Data and Forecast of Philippines Non-Dairy Toppings Market Revenues & Volume By Vegetable Oil, for the Period 2021- 2031
- Historical Data and Forecast of Philippines Non-Dairy Toppings Market Revenues & Volume By Almond Milk for the Period 2021- 2031
- Historical Data and Forecast of Philippines Non-Dairy Toppings Market Revenues & Volume By Coconut Milk for the Period 2021- 2031
- Historical Data and Forecast of Philippines Non-Dairy Toppings Market Revenues & Volume By Others for the Period 2021- 2031
- Historical Data and Forecast of Philippines Non-Dairy Toppings Market Revenues & Volume By Application for the Period 2021- 2031
- Historical Data and Forecast of Philippines Non-Dairy Toppings Market Revenues & Volume By Bakery for the Period 2021- 2031
- Historical Data and Forecast of Philippines Non-Dairy Toppings Market Revenues & Volume By Confectionery for the Period 2021- 2031
- Historical Data and Forecast of Philippines Non-Dairy Toppings Market Revenues & Volume By Processed Fruits for the Period 2021- 2031
- Historical Data and Forecast of Philippines Non-Dairy Toppings Market Revenues & Volume By Frozen Desserts for the Period 2021- 2031
- Historical Data and Forecast of Philippines Non-Dairy Toppings Market Revenues & Volume By Beverage for the Period 2021- 2031
- Historical Data and Forecast of Philippines Non-Dairy Toppings Market Revenues & Volume By Others for the Period 2021- 2031
- Historical Data and Forecast of Philippines Non-Dairy Toppings Market Revenues & Volume By Distribution Channel for the Period 2021- 2031
- Historical Data and Forecast of Philippines Non-Dairy Toppings Market Revenues & Volume By Specialty Food Stores for the Period 2021- 2031
- Historical Data and Forecast of Philippines Non-Dairy Toppings Market Revenues & Volume By E-Commerce for the Period 2021- 2031
- Historical Data and Forecast of Philippines Non-Dairy Toppings Market Revenues & Volume By Modern Stores for the Period 2021- 2031
- Historical Data and Forecast of Philippines Non-Dairy Toppings Market Revenues & Volume By Others for the Period 2021- 2031
- Philippines Non-Dairy Toppings Import Export Trade Statistics
- Market Opportunity Assessment By Type
- Market Opportunity Assessment By Form
- Market Opportunity Assessment By Base Ingredient
- Market Opportunity Assessment By Application
- Market Opportunity Assessment By Distribution Channel
- Philippines Non-Dairy Toppings Top Companies Market Share
- Philippines Non-Dairy Toppings Competitive Benchmarking By Technical and Operational Parameters
- Philippines Non-Dairy Toppings Company Profiles
- Philippines Non-Dairy Toppings Key Strategic Recommendations
Frequently Asked Questions About the Market Study (FAQs):
6Wresearch actively monitors the Philippines Non-Dairy Toppings Market and publishes its comprehensive annual report, highlighting emerging trends, growth drivers, revenue analysis, and forecast outlook. Our insights help businesses to make data-backed strategic decisions with ongoing market dynamics. Our analysts track relevent industries related to the Philippines Non-Dairy Toppings Market, allowing our clients with actionable intelligence and reliable forecasts tailored to emerging regional needs.
Yes, we provide customisation as per your requirements. To learn more, feel free to contact us on sales@6wresearch.com
1 Executive Summary |
2 Introduction |
2.1 Key Highlights of the Report |
2.2 Report Description |
2.3 Market Scope & Segmentation |
2.4 Research Methodology |
2.5 Assumptions |
3 Philippines Non-Dairy Toppings Market Overview |
3.1 Philippines Country Macro Economic Indicators |
3.2 Philippines Non-Dairy Toppings Market Revenues & Volume, 2021 & 2031F |
3.3 Philippines Non-Dairy Toppings Market - Industry Life Cycle |
3.4 Philippines Non-Dairy Toppings Market - Porter's Five Forces |
3.5 Philippines Non-Dairy Toppings Market Revenues & Volume Share, By Type, 2021 & 2031F |
3.6 Philippines Non-Dairy Toppings Market Revenues & Volume Share, By Form, 2021 & 2031F |
3.7 Philippines Non-Dairy Toppings Market Revenues & Volume Share, By Base Ingredient, 2021 & 2031F |
3.8 Philippines Non-Dairy Toppings Market Revenues & Volume Share, By Application, 2021 & 2031F |
3.9 Philippines Non-Dairy Toppings Market Revenues & Volume Share, By Distribution Channel, 2021 & 2031F |
4 Philippines Non-Dairy Toppings Market Dynamics |
4.1 Impact Analysis |
4.2 Market Drivers |
4.2.1 Increasing health consciousness and demand for plant-based alternatives |
4.2.2 Growing vegan and lactose-intolerant population in the Philippines |
4.2.3 Rising disposable income leading to higher spending on premium non-dairy toppings |
4.3 Market Restraints |
4.3.1 Limited awareness and availability of non-dairy alternatives in certain regions |
4.3.2 Higher cost of non-dairy toppings compared to traditional dairy products |
4.3.3 Challenges in replicating the taste and texture of dairy toppings in non-dairy alternatives |
5 Philippines Non-Dairy Toppings Market Trends |
6 Philippines Non-Dairy Toppings Market, By Types |
6.1 Philippines Non-Dairy Toppings Market, By Type |
6.1.1 Overview and Analysis |
6.1.2 Philippines Non-Dairy Toppings Market Revenues & Volume, By Type, 2021- 2031F |
6.1.3 Philippines Non-Dairy Toppings Market Revenues & Volume, By Whip Cream, 2021- 2031F |
6.1.4 Philippines Non-Dairy Toppings Market Revenues & Volume, By Pouring Cream, 2021- 2031F |
6.1.5 Philippines Non-Dairy Toppings Market Revenues & Volume, By Spooning, 2021- 2031F |
6.1.6 Philippines Non-Dairy Toppings Market Revenues & Volume, By Others, 2021- 2031F |
6.2 Philippines Non-Dairy Toppings Market, By Form |
6.2.1 Overview and Analysis |
6.2.2 Philippines Non-Dairy Toppings Market Revenues & Volume, By Liquid, 2021- 2031F |
6.2.3 Philippines Non-Dairy Toppings Market Revenues & Volume, By Powder, 2021- 2031F |
6.2.4 Philippines Non-Dairy Toppings Market Revenues & Volume, By Frozen, 2021- 2031F |
6.3 Philippines Non-Dairy Toppings Market, By Base Ingredient |
6.3.1 Overview and Analysis |
6.3.2 Philippines Non-Dairy Toppings Market Revenues & Volume, By Soy Milk, 2021- 2031F |
6.3.3 Philippines Non-Dairy Toppings Market Revenues & Volume, By Vegetable Oil,, 2021- 2031F |
6.3.4 Philippines Non-Dairy Toppings Market Revenues & Volume, By Almond Milk, 2021- 2031F |
6.3.5 Philippines Non-Dairy Toppings Market Revenues & Volume, By Coconut Milk, 2021- 2031F |
6.3.6 Philippines Non-Dairy Toppings Market Revenues & Volume, By Others, 2021- 2031F |
6.4 Philippines Non-Dairy Toppings Market, By Application |
6.4.1 Overview and Analysis |
6.4.2 Philippines Non-Dairy Toppings Market Revenues & Volume, By Bakery, 2021- 2031F |
6.4.3 Philippines Non-Dairy Toppings Market Revenues & Volume, By Confectionery, 2021- 2031F |
6.4.4 Philippines Non-Dairy Toppings Market Revenues & Volume, By Processed Fruits, 2021- 2031F |
6.4.5 Philippines Non-Dairy Toppings Market Revenues & Volume, By Frozen Desserts, 2021- 2031F |
6.4.6 Philippines Non-Dairy Toppings Market Revenues & Volume, By Beverage, 2021- 2031F |
6.4.7 Philippines Non-Dairy Toppings Market Revenues & Volume, By Others, 2021- 2031F |
6.5 Philippines Non-Dairy Toppings Market, By Distribution Channel |
6.5.1 Overview and Analysis |
6.5.2 Philippines Non-Dairy Toppings Market Revenues & Volume, By Specialty Food Stores, 2021- 2031F |
6.5.3 Philippines Non-Dairy Toppings Market Revenues & Volume, By E-Commerce, 2021- 2031F |
6.5.4 Philippines Non-Dairy Toppings Market Revenues & Volume, By Modern Stores, 2021- 2031F |
6.5.5 Philippines Non-Dairy Toppings Market Revenues & Volume, By Others, 2021- 2031F |
7 Philippines Non-Dairy Toppings Market Import-Export Trade Statistics |
7.1 Philippines Non-Dairy Toppings Market Export to Major Countries |
7.2 Philippines Non-Dairy Toppings Market Imports from Major Countries |
8 Philippines Non-Dairy Toppings Market Key Performance Indicators |
8.1 Number of new product launches and innovations in the non-dairy toppings market |
8.2 Percentage increase in per capita consumption of non-dairy toppings |
8.3 Growth in the number of specialty stores and cafes offering non-dairy topping options |
9 Philippines Non-Dairy Toppings Market - Opportunity Assessment |
9.1 Philippines Non-Dairy Toppings Market Opportunity Assessment, By Type, 2021 & 2031F |
9.2 Philippines Non-Dairy Toppings Market Opportunity Assessment, By Form, 2021 & 2031F |
9.3 Philippines Non-Dairy Toppings Market Opportunity Assessment, By Base Ingredient, 2021 & 2031F |
9.4 Philippines Non-Dairy Toppings Market Opportunity Assessment, By Application, 2021 & 2031F |
9.5 Philippines Non-Dairy Toppings Market Opportunity Assessment, By Distribution Channel, 2021 & 2031F |
10 Philippines Non-Dairy Toppings Market - Competitive Landscape |
10.1 Philippines Non-Dairy Toppings Market Revenue Share, By Companies, 2024 |
10.2 Philippines Non-Dairy Toppings Market Competitive Benchmarking, By Operating and Technical Parameters |
11 Company Profiles |
12 Recommendations |
13 Disclaimer |
Global Go To Market Strategy - 2030
Export potential enables firms to identify high-growth global markets with greater confidence by combining advanced trade intelligence with a structured quantitative methodology. The framework analyzes emerging demand trends and country-level import patterns while integrating macroeconomic and trade datasets such as GDP and population forecasts, bilateral import–export flows, tariff structures, elasticity differentials between developed and developing economies, geographic distance, and import demand projections. Using weighted trade values from 2020–2024 as the base period to project country-to-country export potential for 2030, these inputs are operationalized through calculated drivers such as gravity model parameters, tariff impact factors, and projected GDP per-capita growth. Through an analysis of hidden potentials, demand hotspots, and market conditions that are most favorable to success, this method enables firms to focus on target countries, maximize returns, and global expansion with data, backed by accuracy.
By factoring in the projected importer demand gap that is currently unmet and could be potential opportunity, it identifies the potential for the Exporter (Country) among 190 countries, against the general trade analysis, which identifies the biggest importer or exporter.
To discover high-growth global markets and optimize your business strategy:
Click Here
Pricing
- Single User License$ 1,995
- Department License$ 2,400
- Site License$ 3,120
- Global License$ 3,795

Leadership Perspectives from Industry Events
Search
Thought Leadership and Analyst Meet


Our Clients
6WResearch In News
- India Export Attractiveness Tracker 2026
- India Air Conditioner Market Set for Strong Rebound in 2026 After Weather-Led Correction and GST-Driven Recovery: 6Wresearch
- ADAS in India: How Automatic Emergency Braking, Blind Spot Detection & Driver Monitoring are Transforming Road Safety
- Doha a strategic location for EV manufacturing hub: IPA Qatar
- Demand for luxury TVs surging in the GCC, says Samsung
- Empowering Growth: The Thriving Journey of Bangladesh’s Cable Industry
Latest Reports
- Nicaragua RPG Gaming Market (2026-2032)
- New Zealand RPG Gaming Market (2026-2032)
- Netherlands RPG Gaming Market (2026-2032)
- Nauru RPG Gaming Market (2026-2032)
- Namibia RPG Gaming Market (2026-2032)
- Mozambique RPG Gaming Market (2026-2032)
- Montenegro RPG Gaming Market (2026-2032)
- Mongolia RPG Gaming Market (2026-2032)
- Monaco RPG Gaming Market (2026-2032)
- Micronesia RPG Gaming Market (2026-2032)
Industry Events and Analyst Meet

EV India Expo 2026

HIMTEX 2026

India Refining Summit 2026

India EV Show 2026

EV tech India Expo 2026
Whitepaper
- Middle East & Africa Commercial Security Market Click here to view more.
- Middle East & Africa Fire Safety Systems & Equipment Market Click here to view more.
- GCC Drone Market Click here to view more.
- Middle East Lighting Fixture Market Click here to view more.
- GCC Physical & Perimeter Security Market Click here to view more.