Philippines Portion Cup Market (2025-2031) | Share, Growth, Industry, Companies, Analysis, Forecast, Trends, Competitive Landscape, Segmentation, Size & Revenue, Value, Outlook
Market Forecast By Capacity (Less than 1 Oz, 1-2 Oz, 3-4 Oz, 5-6 Oz, Above 6 Oz), By Application (Barbeque Sauce, Tomato Sauce, Guacamole, Humus, Soups, Ice cream, Others) And Competitive Landscape
| Product Code: ETC8849410 | Publication Date: Sep 2024 | Updated Date: Nov 2025 | Product Type: Market Research Report | |
| Publisher: 6Wresearch | Author: Shubham Deep | No. of Pages: 75 | No. of Figures: 35 | No. of Tables: 20 |
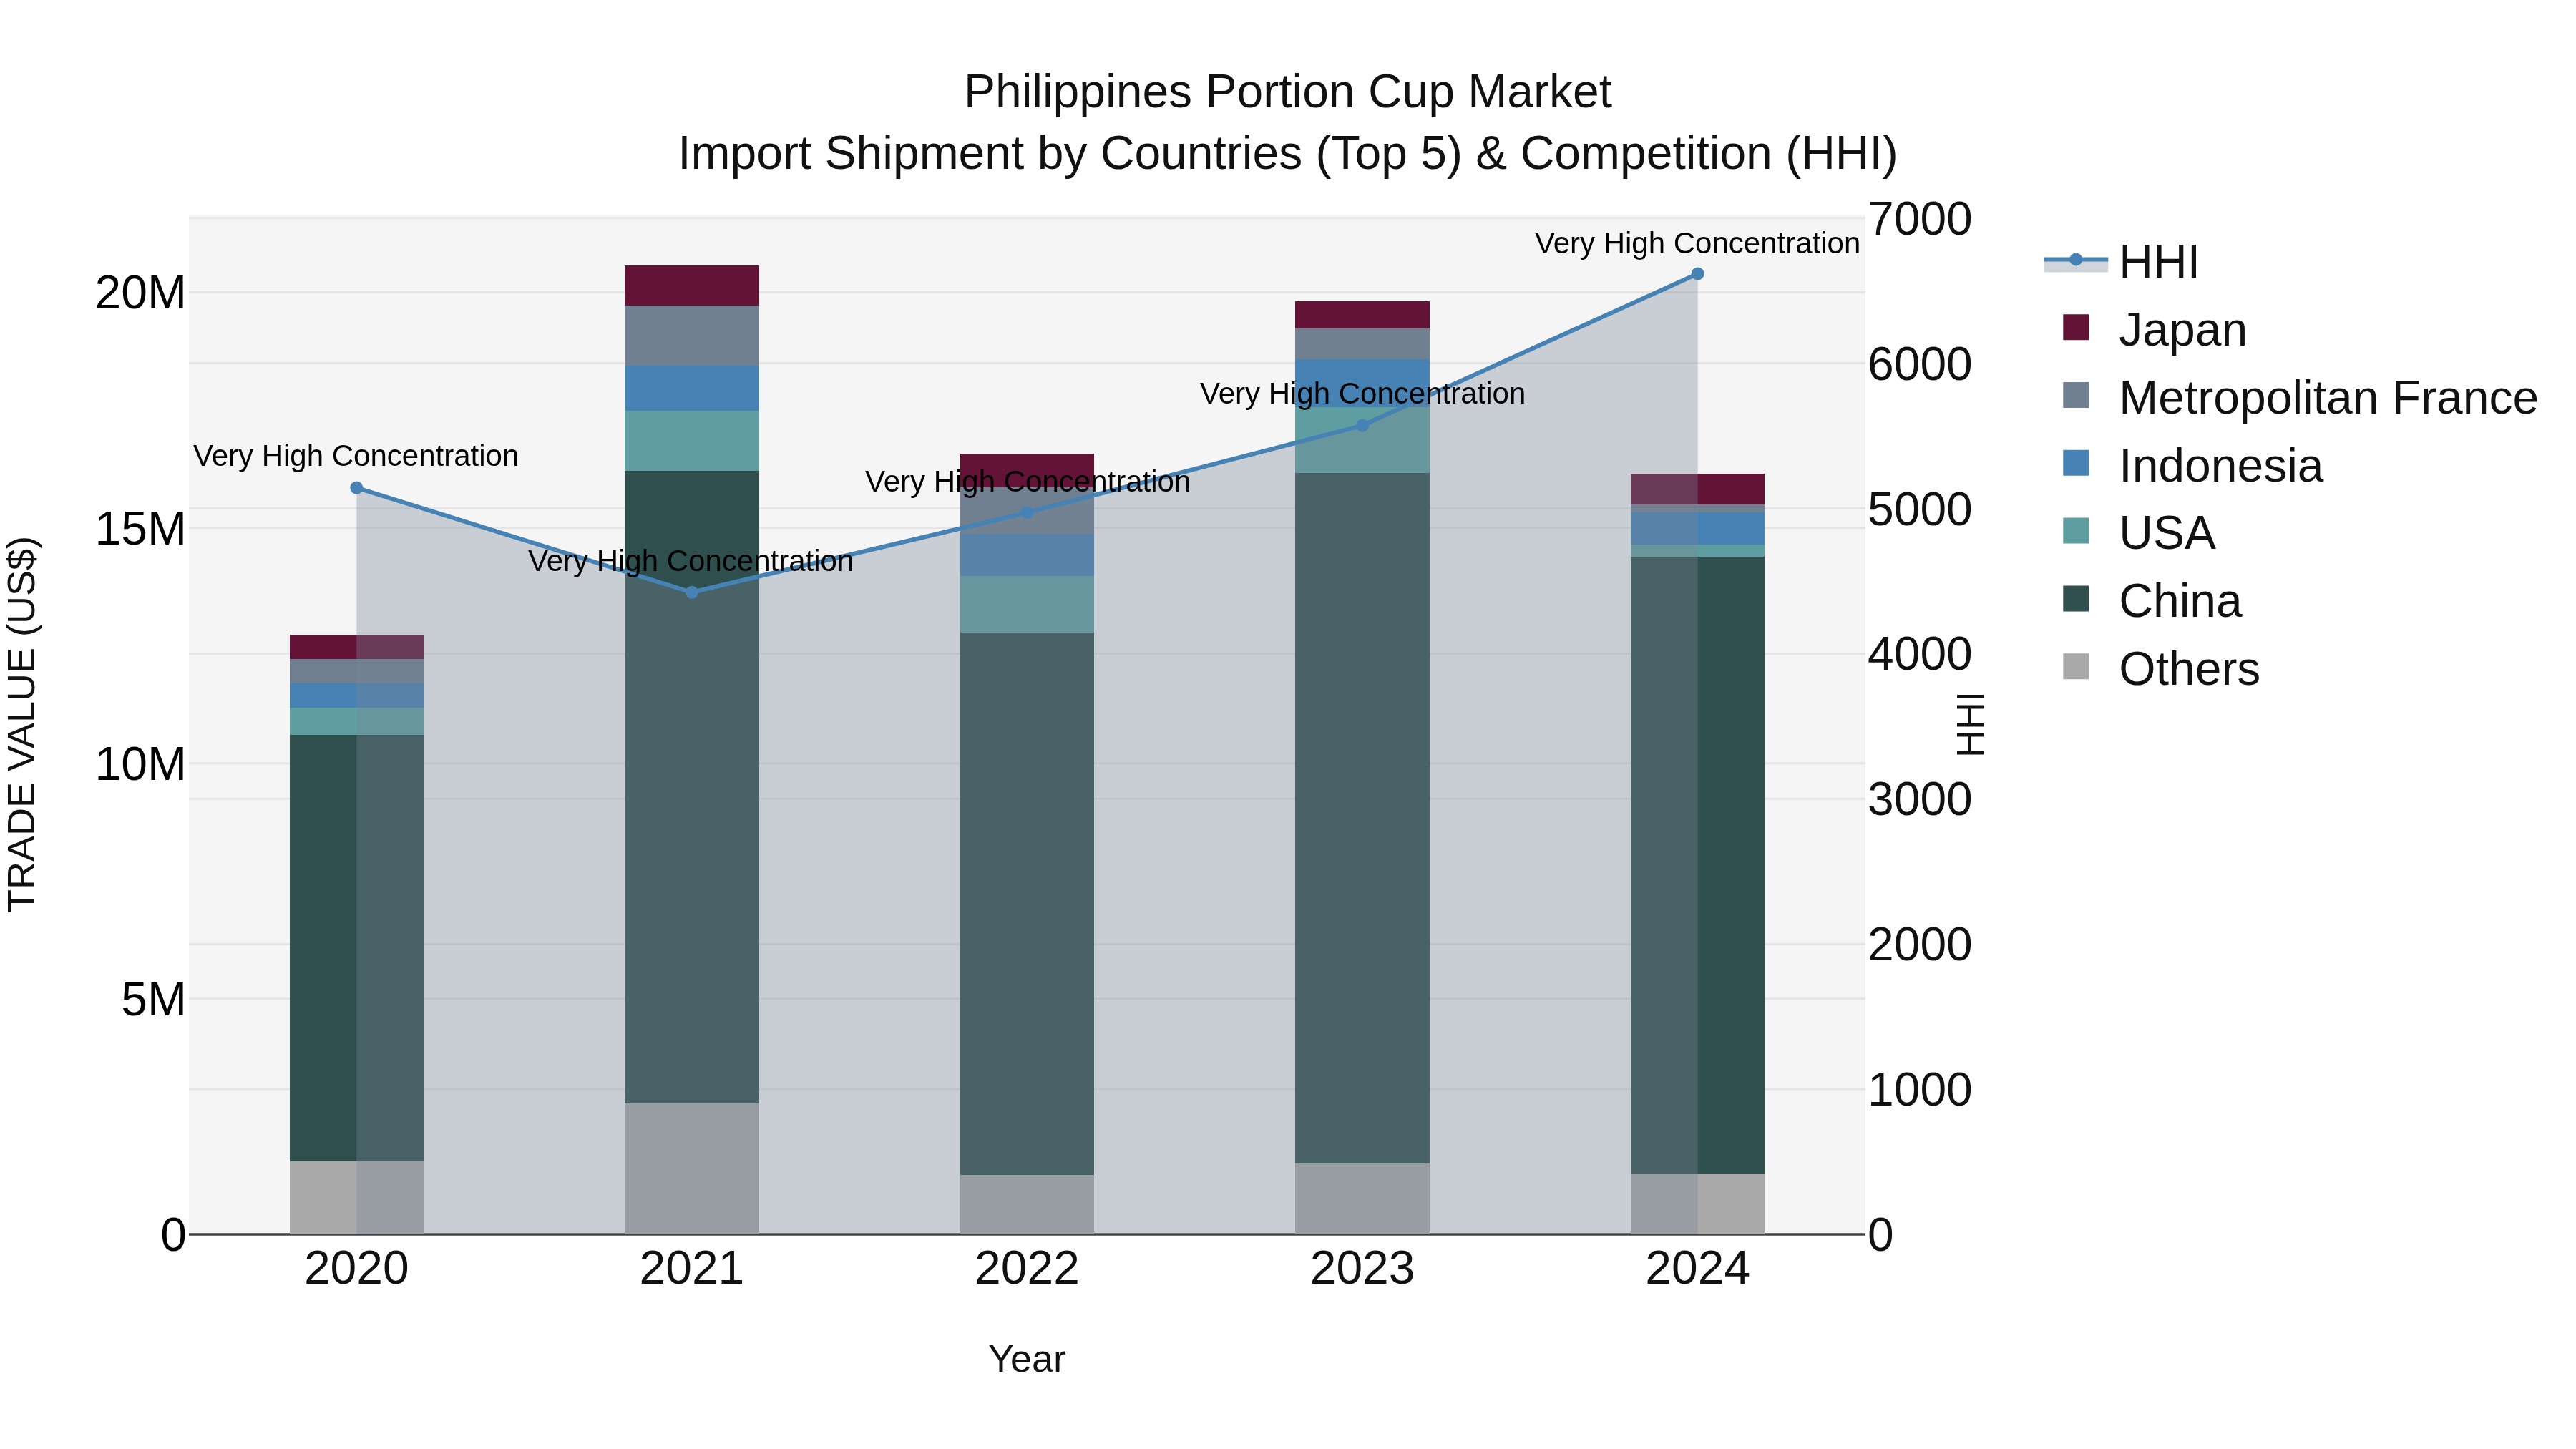
Philippines Portion Cup Market Top 5 Importing Countries and Market Competition (HHI) Analysis
In 2024, the Philippines continued to attract portion cup import shipments mainly from China, Indonesia, Japan, USA, and South Korea. Despite a high concentration with the Herfindahl-Hirschman Index (HHI), the market showed steady growth with a Compound Annual Growth Rate (CAGR) of 6.12% from 2020 to 2024. However, there was a notable decline in growth rate from 2023 to 2024 at -18.48%, indicating potential shifts in the market dynamics or external factors influencing the import trends in the portion cup segment.
Philippines Portion Cup Market Overview
The portion cup market in the Philippines is driven by the growing food and beverage industry, particularly in fast food, catering, and takeaway services. The rising trend of portion control for health-conscious consumers and the need for convenient packaging solutions are influencing market demand. The increasing use of biodegradable and sustainable portion cups aligns with the countrys environmental initiatives, further shaping the market landscape. Additionally, e-commerce platforms and bulk purchasing by restaurants are boosting sales.
Drivers of the market
The expansion of the foodservice industry and the growing demand for takeaway and delivery services are the primary drivers of the portion cup market in the Philippines. The rising consumer preference for convenience and hygiene has increased the use of portion cups for sauces, condiments, and dressings in restaurants and fast-food chains. Additionally, sustainability concerns have led to innovations in eco-friendly and biodegradable portion cups, further driving market growth. The increasing adoption of portion-controlled packaging in the food industry, particularly in catering and quick-service restaurants, is also contributing to the market`s expansion.
Challenges of the market
The Philippines portion cup market faces challenges related to environmental sustainability, as single-use plastic portion cups contribute to plastic waste. While eco-friendly alternatives are available, they often come at a higher cost, deterring adoption among budget-conscious foodservice providers. Additionally, fluctuations in raw material prices, such as plastic and biodegradable materials, impact production costs and pricing. The lack of recycling infrastructure further complicates efforts to promote sustainable portion cup solutions, while competition from alternative packaging options also limits market expansion.
Investment opportunities in the Market
The portion cup market is an attractive investment sector due to the growth of the foodservice industry and consumer preference for convenient packaging. Setting up a manufacturing facility for eco-friendly and biodegradable portion cups can align with sustainability trends and attract businesses seeking green packaging solutions. Collaboration with fast-food chains, catering companies, and online food delivery services can drive bulk sales. Investing in automated production technology can improve cost efficiency and scalability.
Government Policy of the market
The industrial tire market is influenced by policies regulating the importation and manufacturing of heavy-duty tires. The government mandates tire quality and safety standards to ensure compliance with industry regulations. Environmental policies promoting tire recycling and sustainable waste management encourage investment in eco-friendly tire solutions. Trade agreements and tariff policies also affect pricing and availability, shaping the competitive landscape for local and international players.
Key Highlights of the Report:
- Philippines Portion Cup Market Outlook
- Market Size of Philippines Portion Cup Market, 2024
- Forecast of Philippines Portion Cup Market, 2031
- Historical Data and Forecast of Philippines Portion Cup Revenues & Volume for the Period 2021- 2031
- Philippines Portion Cup Market Trend Evolution
- Philippines Portion Cup Market Drivers and Challenges
- Philippines Portion Cup Price Trends
- Philippines Portion Cup Porter's Five Forces
- Philippines Portion Cup Industry Life Cycle
- Historical Data and Forecast of Philippines Portion Cup Market Revenues & Volume By Capacity for the Period 2021- 2031
- Historical Data and Forecast of Philippines Portion Cup Market Revenues & Volume By Less than 1 Oz for the Period 2021- 2031
- Historical Data and Forecast of Philippines Portion Cup Market Revenues & Volume By 1-2 Oz for the Period 2021- 2031
- Historical Data and Forecast of Philippines Portion Cup Market Revenues & Volume By 3-4 Oz for the Period 2021- 2031
- Historical Data and Forecast of Philippines Portion Cup Market Revenues & Volume By 5-6 Oz for the Period 2021- 2031
- Historical Data and Forecast of Philippines Portion Cup Market Revenues & Volume By Above 6 Oz for the Period 2021- 2031
- Historical Data and Forecast of Philippines Portion Cup Market Revenues & Volume By Application for the Period 2021- 2031
- Historical Data and Forecast of Philippines Portion Cup Market Revenues & Volume By Barbeque Sauce for the Period 2021- 2031
- Historical Data and Forecast of Philippines Portion Cup Market Revenues & Volume By Tomato Sauce for the Period 2021- 2031
- Historical Data and Forecast of Philippines Portion Cup Market Revenues & Volume By Guacamole for the Period 2021- 2031
- Historical Data and Forecast of Philippines Portion Cup Market Revenues & Volume By Humus for the Period 2021- 2031
- Historical Data and Forecast of Philippines Portion Cup Market Revenues & Volume By Soups for the Period 2021- 2031
- Historical Data and Forecast of Philippines Portion Cup Market Revenues & Volume By Ice cream for the Period 2021- 2031
- Historical Data and Forecast of Philippines Portion Cup Market Revenues & Volume By Others for the Period 2021- 2031
- Philippines Portion Cup Import Export Trade Statistics
- Market Opportunity Assessment By Capacity
- Market Opportunity Assessment By Application
- Philippines Portion Cup Top Companies Market Share
- Philippines Portion Cup Competitive Benchmarking By Technical and Operational Parameters
- Philippines Portion Cup Company Profiles
- Philippines Portion Cup Key Strategic Recommendations
Frequently Asked Questions About the Market Study (FAQs):
6Wresearch actively monitors the Philippines Portion Cup Market and publishes its comprehensive annual report, highlighting emerging trends, growth drivers, revenue analysis, and forecast outlook. Our insights help businesses to make data-backed strategic decisions with ongoing market dynamics. Our analysts track relevent industries related to the Philippines Portion Cup Market, allowing our clients with actionable intelligence and reliable forecasts tailored to emerging regional needs.
Yes, we provide customisation as per your requirements. To learn more, feel free to contact us on sales@6wresearch.com
1 Executive Summary |
2 Introduction |
2.1 Key Highlights of the Report |
2.2 Report Description |
2.3 Market Scope & Segmentation |
2.4 Research Methodology |
2.5 Assumptions |
3 Philippines Portion Cup Market Overview |
3.1 Philippines Country Macro Economic Indicators |
3.2 Philippines Portion Cup Market Revenues & Volume, 2021 & 2031F |
3.3 Philippines Portion Cup Market - Industry Life Cycle |
3.4 Philippines Portion Cup Market - Porter's Five Forces |
3.5 Philippines Portion Cup Market Revenues & Volume Share, By Capacity, 2021 & 2031F |
3.6 Philippines Portion Cup Market Revenues & Volume Share, By Application, 2021 & 2031F |
4 Philippines Portion Cup Market Dynamics |
4.1 Impact Analysis |
4.2 Market Drivers |
4.2.1 Increasing demand for convenience and on-the-go food consumption |
4.2.2 Growing popularity of food delivery services and takeout options |
4.2.3 Rising disposable incomes and changing lifestyles in the Philippines |
4.3 Market Restraints |
4.3.1 Environmental concerns related to single-use plastic portion cups |
4.3.2 Competition from alternative packaging solutions such as reusable containers or biodegradable options |
5 Philippines Portion Cup Market Trends |
6 Philippines Portion Cup Market, By Types |
6.1 Philippines Portion Cup Market, By Capacity |
6.1.1 Overview and Analysis |
6.1.2 Philippines Portion Cup Market Revenues & Volume, By Capacity, 2021- 2031F |
6.1.3 Philippines Portion Cup Market Revenues & Volume, By Less than 1 Oz, 2021- 2031F |
6.1.4 Philippines Portion Cup Market Revenues & Volume, By 1-2 Oz, 2021- 2031F |
6.1.5 Philippines Portion Cup Market Revenues & Volume, By 3-4 Oz, 2021- 2031F |
6.1.6 Philippines Portion Cup Market Revenues & Volume, By 5-6 Oz, 2021- 2031F |
6.1.7 Philippines Portion Cup Market Revenues & Volume, By Above 6 Oz, 2021- 2031F |
6.2 Philippines Portion Cup Market, By Application |
6.2.1 Overview and Analysis |
6.2.2 Philippines Portion Cup Market Revenues & Volume, By Barbeque Sauce, 2021- 2031F |
6.2.3 Philippines Portion Cup Market Revenues & Volume, By Tomato Sauce, 2021- 2031F |
6.2.4 Philippines Portion Cup Market Revenues & Volume, By Guacamole, 2021- 2031F |
6.2.5 Philippines Portion Cup Market Revenues & Volume, By Humus, 2021- 2031F |
6.2.6 Philippines Portion Cup Market Revenues & Volume, By Soups, 2021- 2031F |
6.2.7 Philippines Portion Cup Market Revenues & Volume, By Ice cream, 2021- 2031F |
7 Philippines Portion Cup Market Import-Export Trade Statistics |
7.1 Philippines Portion Cup Market Export to Major Countries |
7.2 Philippines Portion Cup Market Imports from Major Countries |
8 Philippines Portion Cup Market Key Performance Indicators |
8.1 Percentage increase in the adoption of portion cups by food service providers |
8.2 Number of new product launches and innovations in portion cup designs |
8.3 Growth in the usage of portion cups for various food and beverage applications |
8.4 Customer satisfaction levels with the convenience and functionality of portion cups |
9 Philippines Portion Cup Market - Opportunity Assessment |
9.1 Philippines Portion Cup Market Opportunity Assessment, By Capacity, 2021 & 2031F |
9.2 Philippines Portion Cup Market Opportunity Assessment, By Application, 2021 & 2031F |
10 Philippines Portion Cup Market - Competitive Landscape |
10.1 Philippines Portion Cup Market Revenue Share, By Companies, 2024 |
10.2 Philippines Portion Cup Market Competitive Benchmarking, By Operating and Technical Parameters |
11 Company Profiles |
12 Recommendations |
13 Disclaimer |
Export potential assessment - trade Analytics for 2030
Export potential enables firms to identify high-growth global markets with greater confidence by combining advanced trade intelligence with a structured quantitative methodology. The framework analyzes emerging demand trends and country-level import patterns while integrating macroeconomic and trade datasets such as GDP and population forecasts, bilateral import–export flows, tariff structures, elasticity differentials between developed and developing economies, geographic distance, and import demand projections. Using weighted trade values from 2020–2024 as the base period to project country-to-country export potential for 2030, these inputs are operationalized through calculated drivers such as gravity model parameters, tariff impact factors, and projected GDP per-capita growth. Through an analysis of hidden potentials, demand hotspots, and market conditions that are most favorable to success, this method enables firms to focus on target countries, maximize returns, and global expansion with data, backed by accuracy.
By factoring in the projected importer demand gap that is currently unmet and could be potential opportunity, it identifies the potential for the Exporter (Country) among 190 countries, against the general trade analysis, which identifies the biggest importer or exporter.
To discover high-growth global markets and optimize your business strategy:
Click Here
Pricing
- Single User License$ 1,995
- Department License$ 2,400
- Site License$ 3,120
- Global License$ 3,795

Search
Thought Leadership and Analyst Meet


Our Clients
Latest Reports
- France Thermally Conductive Filler Dispersants Market (2026-2032) | Challenges, Restraints, Value, Share, Size, segmentation, Analysis, Trends, Investment Opportunities, Outlook, Pricing, Demand, Forecast, Revenue, Companies, Growth, Drivers, Strategy, Insights, Competition
- Egypt Thermally Conductive Filler Dispersants Market (2026-2032) | Competition, Forecast, Strategy, Value, Insights, Outlook, Investment Opportunities, Pricing, Demand, Share, segmentation, Drivers, Size, Companies, Restraints, Growth, Trends, Revenue, Challenges, Analysis
- Czech Republic Thermally Conductive Filler Dispersants Market (2026-2032) | Forecast, Pricing, Analysis, Drivers, Insights, Size, Demand, Growth, Challenges, segmentation, Competition, Outlook, Trends, Investment Opportunities, Companies, Strategy, Revenue, Share, Value, Restraints
- Colombia Thermally Conductive Filler Dispersants Market (2026-2032) | segmentation, Trends, Share, Drivers, Strategy, Companies, Demand, Insights, Size, Challenges, Value, Competition, Analysis, Growth, Revenue, Restraints, Forecast, Pricing, Outlook, Investment Opportunities
- China Thermally Conductive Filler Dispersants Market (2026-2032) | Restraints, Investment Opportunities, Pricing, Companies, Share, Size, Challenges, Trends, Outlook, Value, Analysis, Competition, Revenue, Drivers, Forecast, Demand, Insights, Growth, Strategy, segmentation
- Chile Thermally Conductive Filler Dispersants Market (2026-2032) | Investment Opportunities, Trends, Value, Restraints, Share, Companies, Forecast, segmentation, Pricing, Challenges, Demand, Size, Analysis, Drivers, Outlook, Growth, Competition, Strategy, Revenue, Insights
- Cambodia Thermally Conductive Filler Dispersants Market (2026-2032) | Analysis, Share, Outlook, Strategy, Pricing, Demand, Size, Growth, segmentation, Insights, Revenue, Forecast, Challenges, Competition, Companies, Investment Opportunities, Trends, Restraints, Value, Drivers
- Brazil Thermally Conductive Filler Dispersants Market (2026-2032) | Restraints, Forecast, Competition, Size, Revenue, Value, Investment Opportunities, Trends, Insights, Outlook, Growth, Analysis, Drivers, segmentation, Pricing, Challenges, Strategy, Share, Companies, Demand
- Bangladesh Thermally Conductive Filler Dispersants Market (2026-2032) | Restraints, Trends, Analysis, Competition, Insights, Forecast, Value, Investment Opportunities, Pricing, Share, Demand, Outlook, Revenue, segmentation, Companies, Drivers, Growth, Size, Challenges, Strategy
- Bahrain Thermally Conductive Filler Dispersants Market (2026-2032) | Trends, Outlook, Pricing, Demand, Value, Competition, Forecast, Growth, segmentation, Revenue, Companies, Analysis, Insights, Size, Drivers, Challenges, Strategy, Investment Opportunities, Share, Restraints
Industry Events and Analyst Meet

HIMTEX 2026

India Refining Summit 2026

India EV Show 2026

EV tech India Expo 2026

Auto Tech Asia 2026
Whitepaper
- Middle East & Africa Commercial Security Market Click here to view more.
- Middle East & Africa Fire Safety Systems & Equipment Market Click here to view more.
- GCC Drone Market Click here to view more.
- Middle East Lighting Fixture Market Click here to view more.
- GCC Physical & Perimeter Security Market Click here to view more.
6WResearch In News
- Doha a strategic location for EV manufacturing hub: IPA Qatar
- Demand for luxury TVs surging in the GCC, says Samsung
- Empowering Growth: The Thriving Journey of Bangladesh’s Cable Industry
- Demand for luxury TVs surging in the GCC, says Samsung
- Video call with a traditional healer? Once unthinkable, it’s now common in South Africa
- Intelligent Buildings To Smooth GCC’s Path To Net Zero