Poland Alginate Dressing Market (2026-2032) | Competitive Landscape, Trends, Value, Segmentation, Analysis, Share, Size & Revenue, Companies, Outlook, Forecast, Growth, Industry
Market Forecast By Type (Antimicrobial, Non-antimicrobial), By Application (Acute Wounds, Chronic Wounds), By End-use (Hospitals, Specialty Clinics, Home Healthcare, Others) And Competitive Landscape
| Product Code: ETC8855932 | Publication Date: Sep 2024 | Updated Date: Apr 2026 | Product Type: Market Research Report | |
| Publisher: 6Wresearch | Author: Sumit Sagar | No. of Pages: 75 | No. of Figures: 35 | No. of Tables: 20 |
Poland Alginate Dressing Market Size (2020-2030)
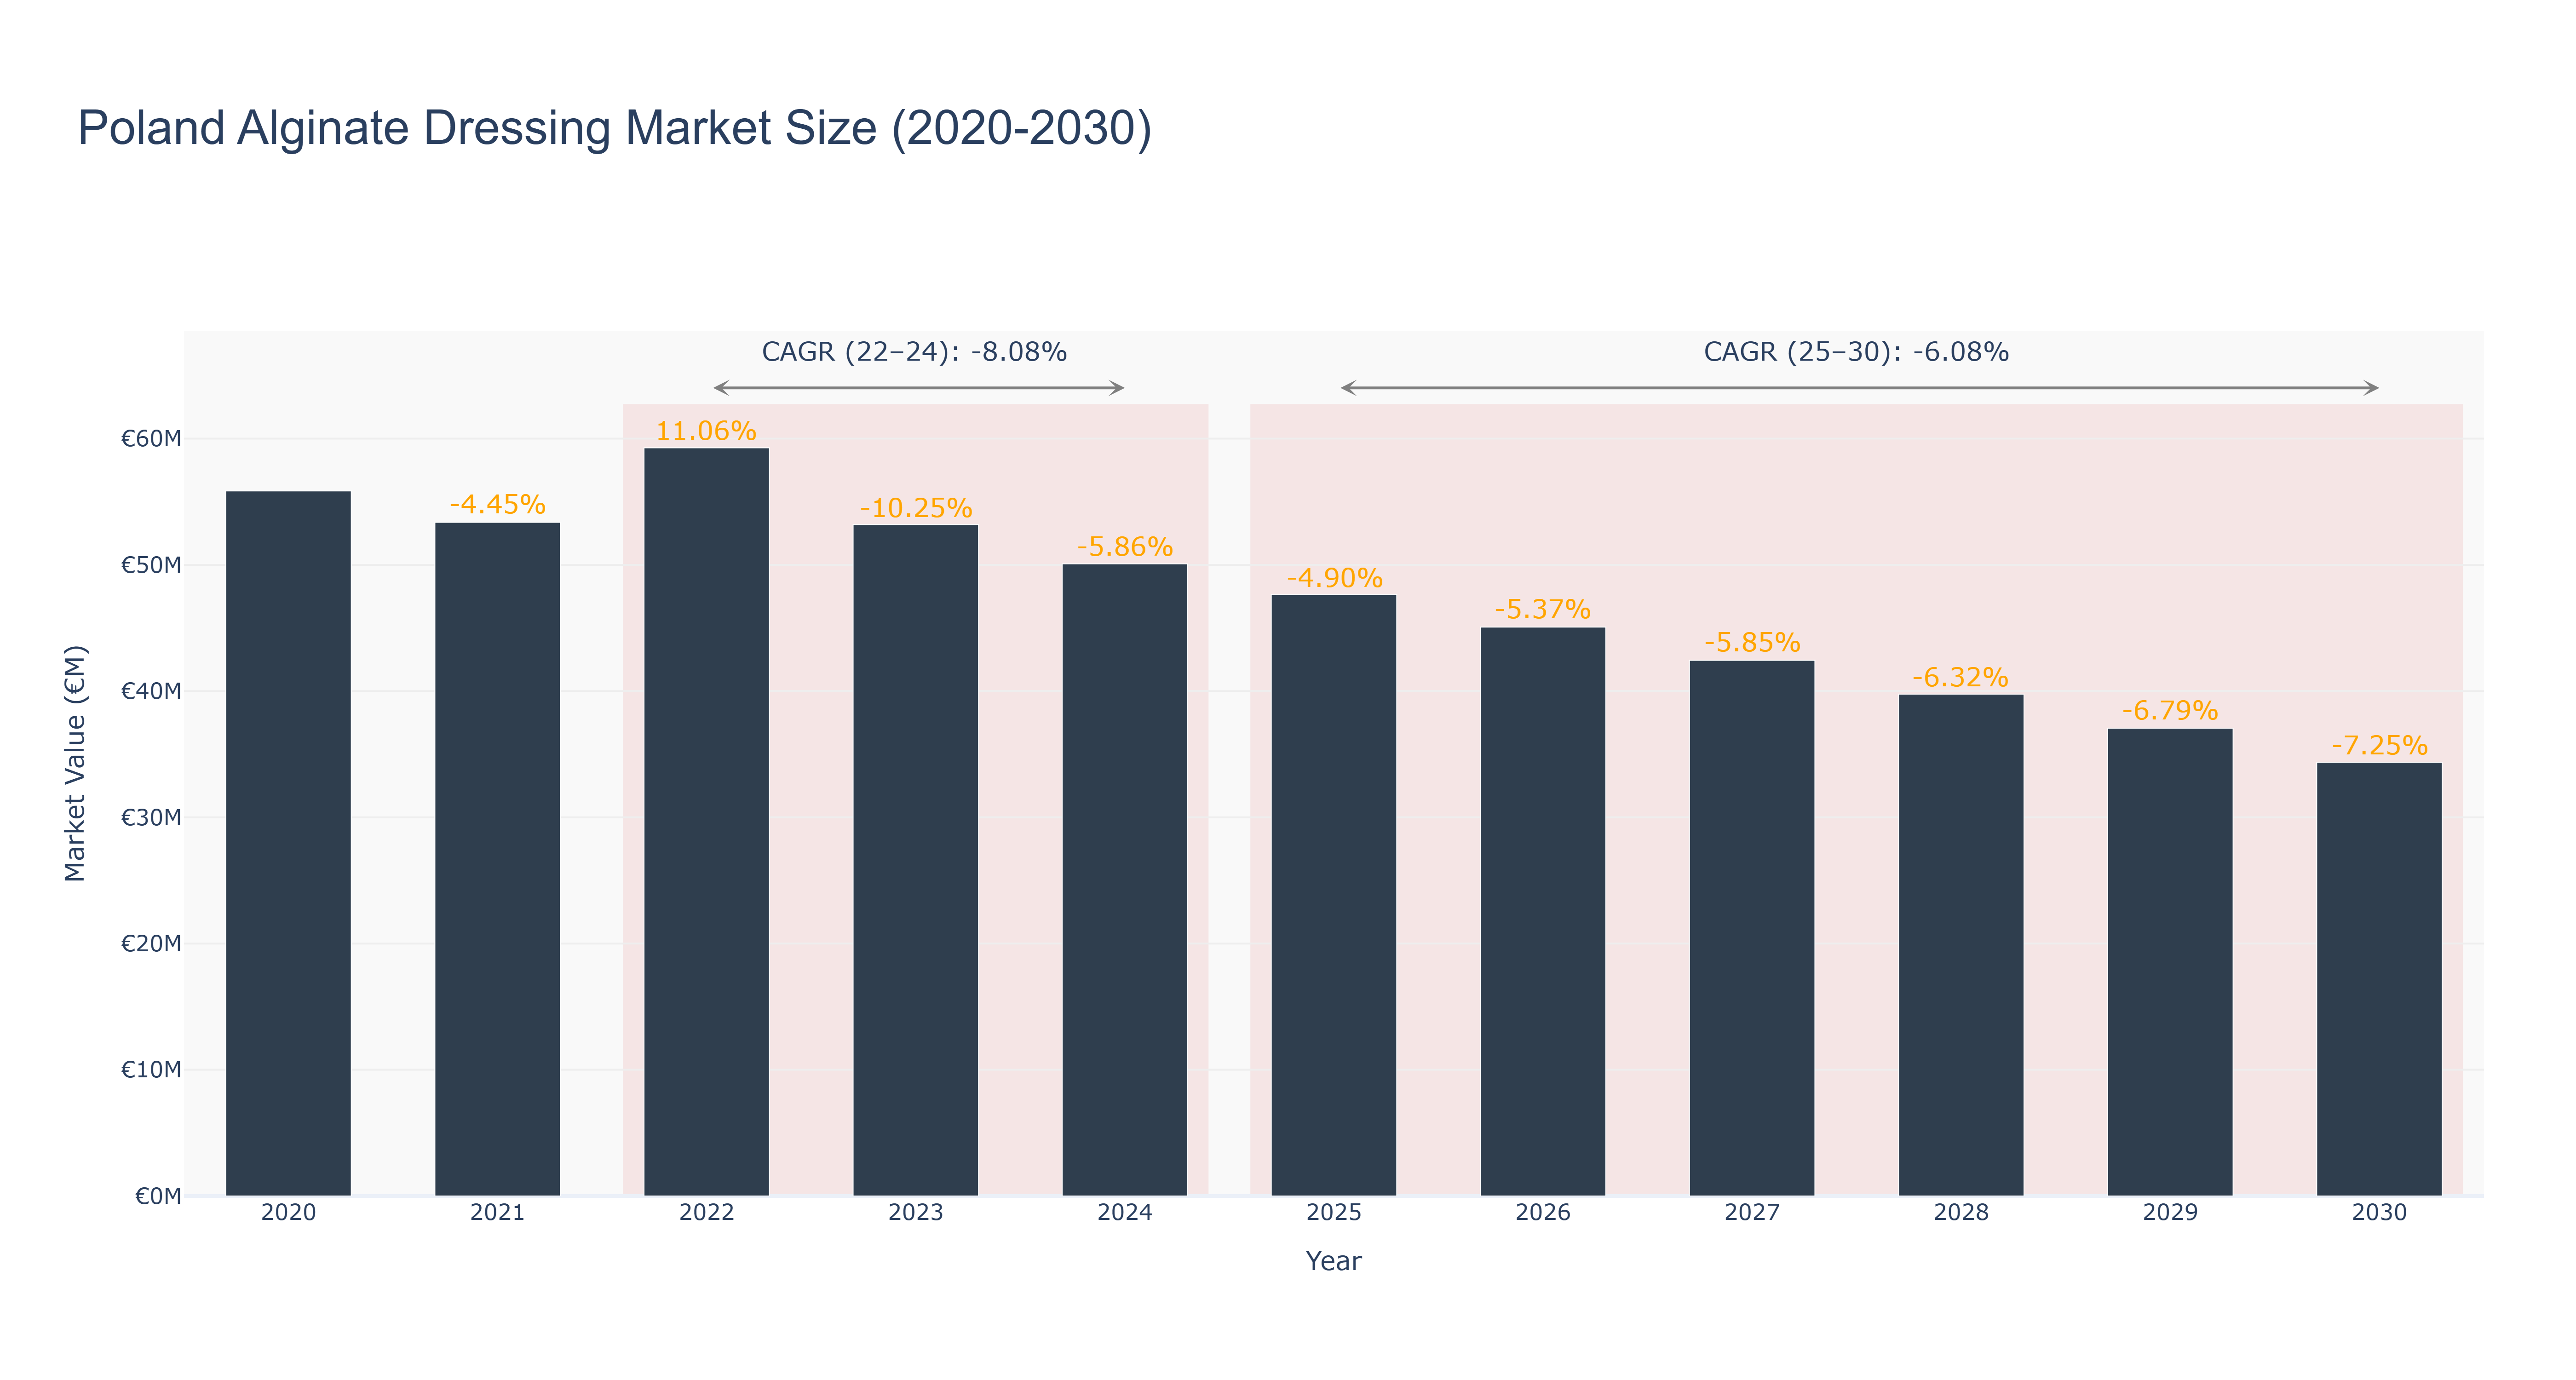
The Poland Alginate Dressing Market experienced a peak market size of €59.27 million in 2022, followed by a decline to €50.08 million in 2024. The market is forecasted to continue shrinking, with an expected size of €34.37 million in 2030. The CAGR for the period 2022-24 was -8.08%, while for 2025-30, it is projected to be -6.08%. The downward trend can be attributed to factors such as increased competition, pricing pressures, and evolving consumer preferences towards alternative products. Despite the current challenges, upcoming developments in the market include collaborations with healthcare providers to improve product distribution channels and innovative product launches focusing on advanced wound care solutions. These initiatives aim to revitalize the market and drive growth in the coming years. Industry drivers include advancements in wound care technologies, increasing prevalence of chronic wounds, and rising healthcare expenditure in Poland.
Poland Alginate Dressing Market: Production & Trade Performance (2019-2025)
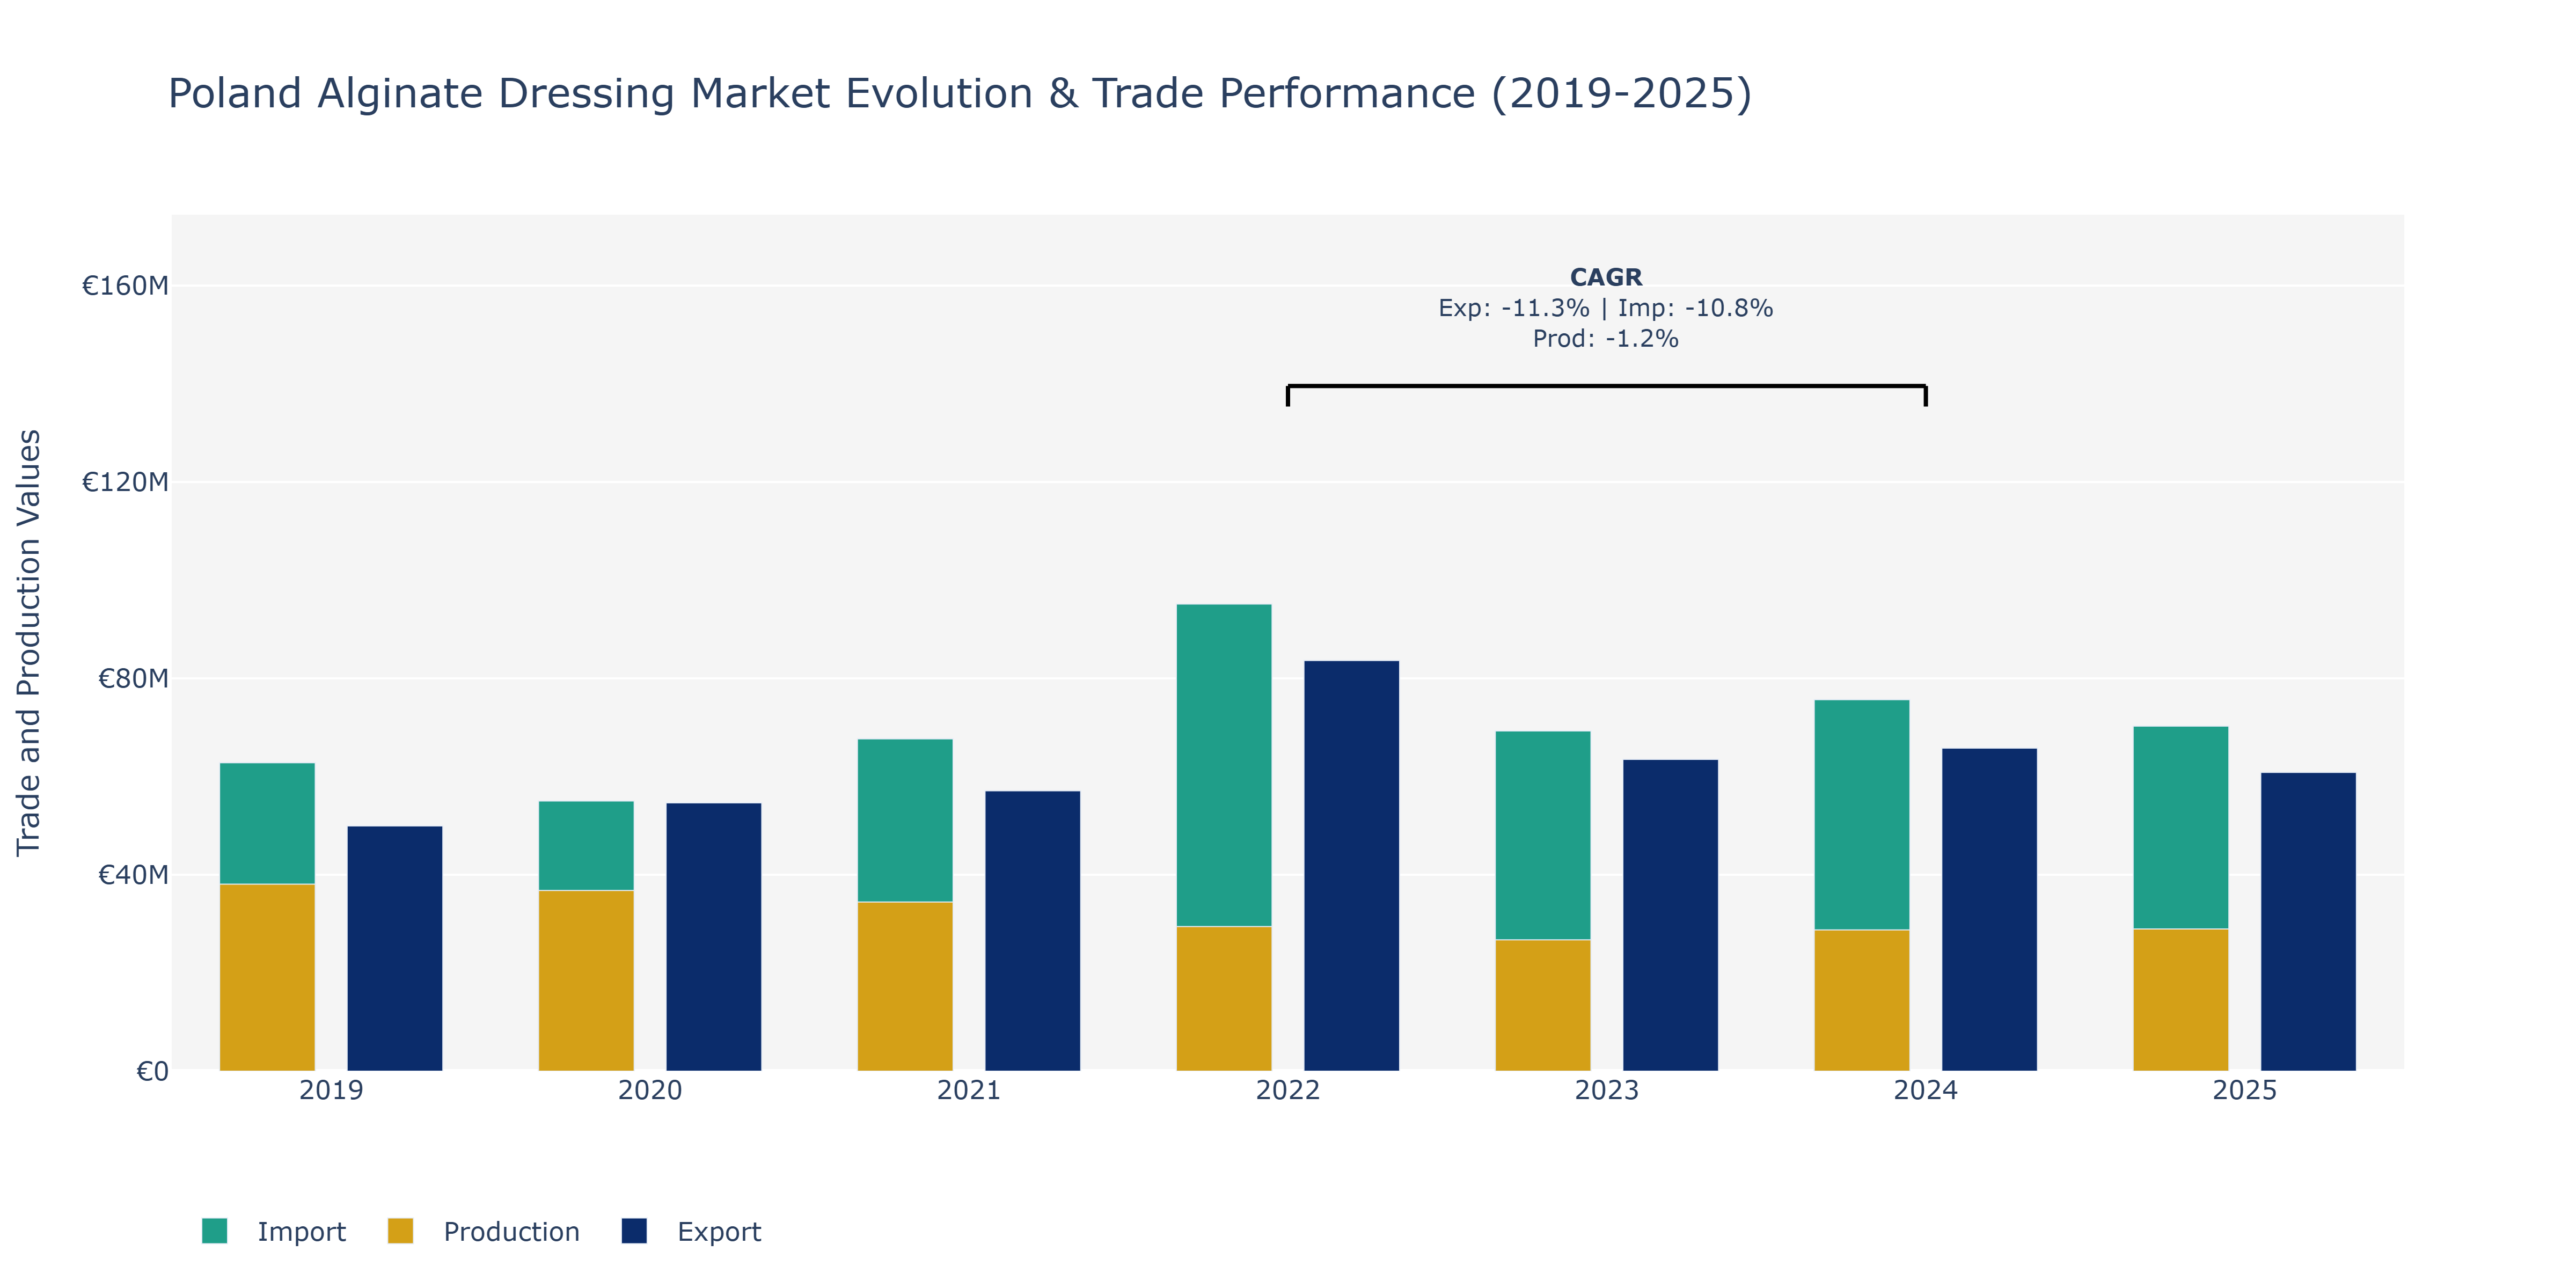
Between 2019 and 2025, Poland's Alginate Dressing Market witnessed varying trends in exports, imports, and production. Exports showed fluctuations, with a peak in 2022 at approximately €83.64 million, followed by a decline to €60.85 million in 2025. Imports also fluctuated, reaching a high of €95.14 million in 2022 and stabilizing around €70.27 million in 2025. Production experienced a slight decline from €38.08 million in 2019 to €28.96 million in 2025. The market's export growth could be attributed to increased demand from international markets due to product quality and competitive pricing. Import fluctuations might be influenced by changes in global alginate dressing prices and domestic consumption patterns. The decrease in production could be linked to evolving consumer preferences towards alternative medical products. To maintain market competitiveness, stakeholders could focus on enhancing product innovation and optimizing supply chain management to adapt to changing market dynamics.
Key Highlights of the Report:
- Poland Alginate Dressing Market Outlook
- Market Size of Poland Alginate Dressing Market, 2025
- Forecast of Poland Alginate Dressing Market, 2032
- Historical Data and Forecast of Poland Alginate Dressing Revenues & Volume for the Period 2022-2032F
- Poland Alginate Dressing Market Trend Evolution
- Poland Alginate Dressing Market Drivers and Challenges
- Poland Alginate Dressing Price Trends
- Poland Alginate Dressing Porter's Five Forces
- Poland Alginate Dressing Industry Life Cycle
- Historical Data and Forecast of Poland Alginate Dressing Market Revenues & Volume By Type for the Period 2022-2032F
- Historical Data and Forecast of Poland Alginate Dressing Market Revenues & Volume By Antimicrobial for the Period 2022-2032F
- Historical Data and Forecast of Poland Alginate Dressing Market Revenues & Volume By Non-antimicrobial for the Period 2022-2032F
- Historical Data and Forecast of Poland Alginate Dressing Market Revenues & Volume By Application for the Period 2022-2032F
- Historical Data and Forecast of Poland Alginate Dressing Market Revenues & Volume By Acute Wounds for the Period 2022-2032F
- Historical Data and Forecast of Poland Alginate Dressing Market Revenues & Volume By Chronic Wounds for the Period 2022-2032F
- Historical Data and Forecast of Poland Alginate Dressing Market Revenues & Volume By End-use for the Period 2022-2032F
- Historical Data and Forecast of Poland Alginate Dressing Market Revenues & Volume By Hospitals for the Period 2022-2032F
- Historical Data and Forecast of Poland Alginate Dressing Market Revenues & Volume By Specialty Clinics for the Period 2022-2032F
- Historical Data and Forecast of Poland Alginate Dressing Market Revenues & Volume By Home Healthcare for the Period 2022-2032F
- Historical Data and Forecast of Poland Alginate Dressing Market Revenues & Volume By Others for the Period 2022-2032F
- Poland Alginate Dressing Import Export Trade Statistics
- Market Opportunity Assessment By Type
- Market Opportunity Assessment By Application
- Market Opportunity Assessment By End-use
- Poland Alginate Dressing Top Companies Market Share
- Poland Alginate Dressing Competitive Benchmarking By Technical and Operational Parameters
- Poland Alginate Dressing Company Profiles
- Poland Alginate Dressing Key Strategic Recommendations
Frequently Asked Questions About the Market Study (FAQs):
6Wresearch actively monitors the Poland Alginate Dressing Market and publishes its comprehensive annual report, highlighting emerging trends, growth drivers, revenue analysis, and forecast outlook. Our insights help businesses to make data-backed strategic decisions with ongoing market dynamics. Our analysts track relevent industries related to the Poland Alginate Dressing Market, allowing our clients with actionable intelligence and reliable forecasts tailored to emerging regional needs.
Yes, we provide customisation as per your requirements. To learn more, feel free to contact us on sales@6wresearch.com
1 Executive Summary |
2 Introduction |
2.1 Key Highlights of the Report |
2.2 Report Description |
2.3 Market Scope & Segmentation |
2.4 Research Methodology |
2.5 Assumptions |
3 Poland Alginate Dressing Market Overview |
3.1 Poland Country Macro Economic Indicators |
3.2 Poland Alginate Dressing Market Revenues & Volume, 2022 & 2032F |
3.3 Poland Alginate Dressing Market - Industry Life Cycle |
3.4 Poland Alginate Dressing Market - Porter's Five Forces |
3.5 Poland Alginate Dressing Market Revenues & Volume Share, By Type, 2022 & 2032F |
3.6 Poland Alginate Dressing Market Revenues & Volume Share, By Application, 2022 & 2032F |
3.7 Poland Alginate Dressing Market Revenues & Volume Share, By End-use, 2022 & 2032F |
4 Poland Alginate Dressing Market Dynamics |
4.1 Impact Analysis |
4.2 Market Drivers |
4.2.1 Increasing prevalence of chronic wounds and diabetic foot ulcers in Poland |
4.2.2 Growing adoption of advanced wound care products in the healthcare sector |
4.2.3 Rising geriatric population leading to higher demand for alginate dressings |
4.3 Market Restraints |
4.3.1 High cost associated with alginate dressings compared to traditional wound care products |
4.3.2 Limited awareness about the benefits of alginate dressings among patients and healthcare providers |
5 Poland Alginate Dressing Market Trends |
6 Poland Alginate Dressing Market, By Types |
6.1 Poland Alginate Dressing Market, By Type |
6.1.1 Overview and Analysis |
6.1.2 Poland Alginate Dressing Market Revenues & Volume, By Type, 2022-2032F |
6.1.3 Poland Alginate Dressing Market Revenues & Volume, By Antimicrobial, 2022-2032F |
6.1.4 Poland Alginate Dressing Market Revenues & Volume, By Non-antimicrobial, 2022-2032F |
6.2 Poland Alginate Dressing Market, By Application |
6.2.1 Overview and Analysis |
6.2.2 Poland Alginate Dressing Market Revenues & Volume, By Acute Wounds, 2022-2032F |
6.2.3 Poland Alginate Dressing Market Revenues & Volume, By Chronic Wounds, 2022-2032F |
6.3 Poland Alginate Dressing Market, By End-use |
6.3.1 Overview and Analysis |
6.3.2 Poland Alginate Dressing Market Revenues & Volume, By Hospitals, 2022-2032F |
6.3.3 Poland Alginate Dressing Market Revenues & Volume, By Specialty Clinics, 2022-2032F |
6.3.4 Poland Alginate Dressing Market Revenues & Volume, By Home Healthcare, 2022-2032F |
6.3.5 Poland Alginate Dressing Market Revenues & Volume, By Others, 2022-2032F |
7 Poland Alginate Dressing Market Import-Export Trade Statistics |
7.1 Poland Alginate Dressing Market Export to Major Countries |
7.2 Poland Alginate Dressing Market Imports from Major Countries |
8 Poland Alginate Dressing Market Key Performance Indicators |
8.1 Number of healthcare facilities using alginate dressings in Poland |
8.2 Percentage increase in the adoption rate of alginate dressings over time |
8.3 Average length of time taken for wound healing with alginate dressings |
9 Poland Alginate Dressing Market - Opportunity Assessment |
9.1 Poland Alginate Dressing Market Opportunity Assessment, By Type, 2022 & 2032F |
9.2 Poland Alginate Dressing Market Opportunity Assessment, By Application, 2022 & 2032F |
9.3 Poland Alginate Dressing Market Opportunity Assessment, By End-use, 2022 & 2032F |
10 Poland Alginate Dressing Market - Competitive Landscape |
10.1 Poland Alginate Dressing Market Revenue Share, By Companies, 2025 |
10.2 Poland Alginate Dressing Market Competitive Benchmarking, By Operating and Technical Parameters |
11 Company Profiles |
12 Recommendations |
13 Disclaimer |
Global Go To Market Strategy - 2030
Export potential enables firms to identify high-growth global markets with greater confidence by combining advanced trade intelligence with a structured quantitative methodology. The framework analyzes emerging demand trends and country-level import patterns while integrating macroeconomic and trade datasets such as GDP and population forecasts, bilateral import–export flows, tariff structures, elasticity differentials between developed and developing economies, geographic distance, and import demand projections. Using weighted trade values from 2020–2024 as the base period to project country-to-country export potential for 2030, these inputs are operationalized through calculated drivers such as gravity model parameters, tariff impact factors, and projected GDP per-capita growth. Through an analysis of hidden potentials, demand hotspots, and market conditions that are most favorable to success, this method enables firms to focus on target countries, maximize returns, and global expansion with data, backed by accuracy.
By factoring in the projected importer demand gap that is currently unmet and could be potential opportunity, it identifies the potential for the Exporter (Country) among 190 countries, against the general trade analysis, which identifies the biggest importer or exporter.
To discover high-growth global markets and optimize your business strategy:
Click Here
Pricing
- Single User License$ 1,995
- Department License$ 2,400
- Site License$ 3,120
- Global License$ 3,795

Leadership Perspectives from Industry Events
Search
Thought Leadership and Analyst Meet


Our Clients
6WResearch In News
- India Air Conditioner Market Set for Strong Rebound in 2026 After Weather-Led Correction and GST-Driven Recovery: 6Wresearch
- ADAS in India: How Automatic Emergency Braking, Blind Spot Detection & Driver Monitoring are Transforming Road Safety
- Doha a strategic location for EV manufacturing hub: IPA Qatar
- Demand for luxury TVs surging in the GCC, says Samsung
- Empowering Growth: The Thriving Journey of Bangladesh’s Cable Industry
- Demand for luxury TVs surging in the GCC, says Samsung
Latest Reports
- Poland Fire Protection Systems Market (2026-2032)
- Cape Verde Portable Hand-Thrown Extinguisher Market (2026-2032)
- Canada Portable Hand-Thrown Extinguisher Market (2026-2032)
- Cameroon Portable Hand-Thrown Extinguisher Market (2026-2032)
- Burundi Portable Hand-Thrown Extinguisher Market (2026-2032)
- Burkina Faso Portable Hand-Thrown Extinguisher Market (2026-2032)
- Bulgaria Portable Hand-Thrown Extinguisher Market (2026-2032)
- Brunei Portable Hand-Thrown Extinguisher Market (2026-2032)
- Botswana Portable Hand-Thrown Extinguisher Market (2026-2032)
- Bosnia and Herzegovina Portable Hand-Thrown Extinguisher Market (2026-2032)
Industry Events and Analyst Meet

HIMTEX 2026

India Refining Summit 2026

India EV Show 2026

EV tech India Expo 2026

Auto Tech Asia 2026
Whitepaper
- Middle East & Africa Commercial Security Market Click here to view more.
- Middle East & Africa Fire Safety Systems & Equipment Market Click here to view more.
- GCC Drone Market Click here to view more.
- Middle East Lighting Fixture Market Click here to view more.
- GCC Physical & Perimeter Security Market Click here to view more.