Poland Inulin Market | Size, Industry, COVID-19 IMPACT, Analysis, Growth, Trends, Revenue, Value, Forecast, Share & Companies
Market Forecast By Form (Powder, Liquid), By Nature (Organic, Conventional), By Source (Agave, Chicory, Jerusalem Artichoke, Others), By Application (Food & Beverages, Dietary Supplements, Pharmaceuticals, Animal Feed) And Competitive Landscape
| Product Code: ETC179914 | Publication Date: Jan 2022 | Updated Date: Feb 2026 | Product Type: Market Research Report | |
| Publisher: 6Wresearch | Author: Ravi Bhandari | No. of Pages: 70 | No. of Figures: 35 | No. of Tables: 5 |
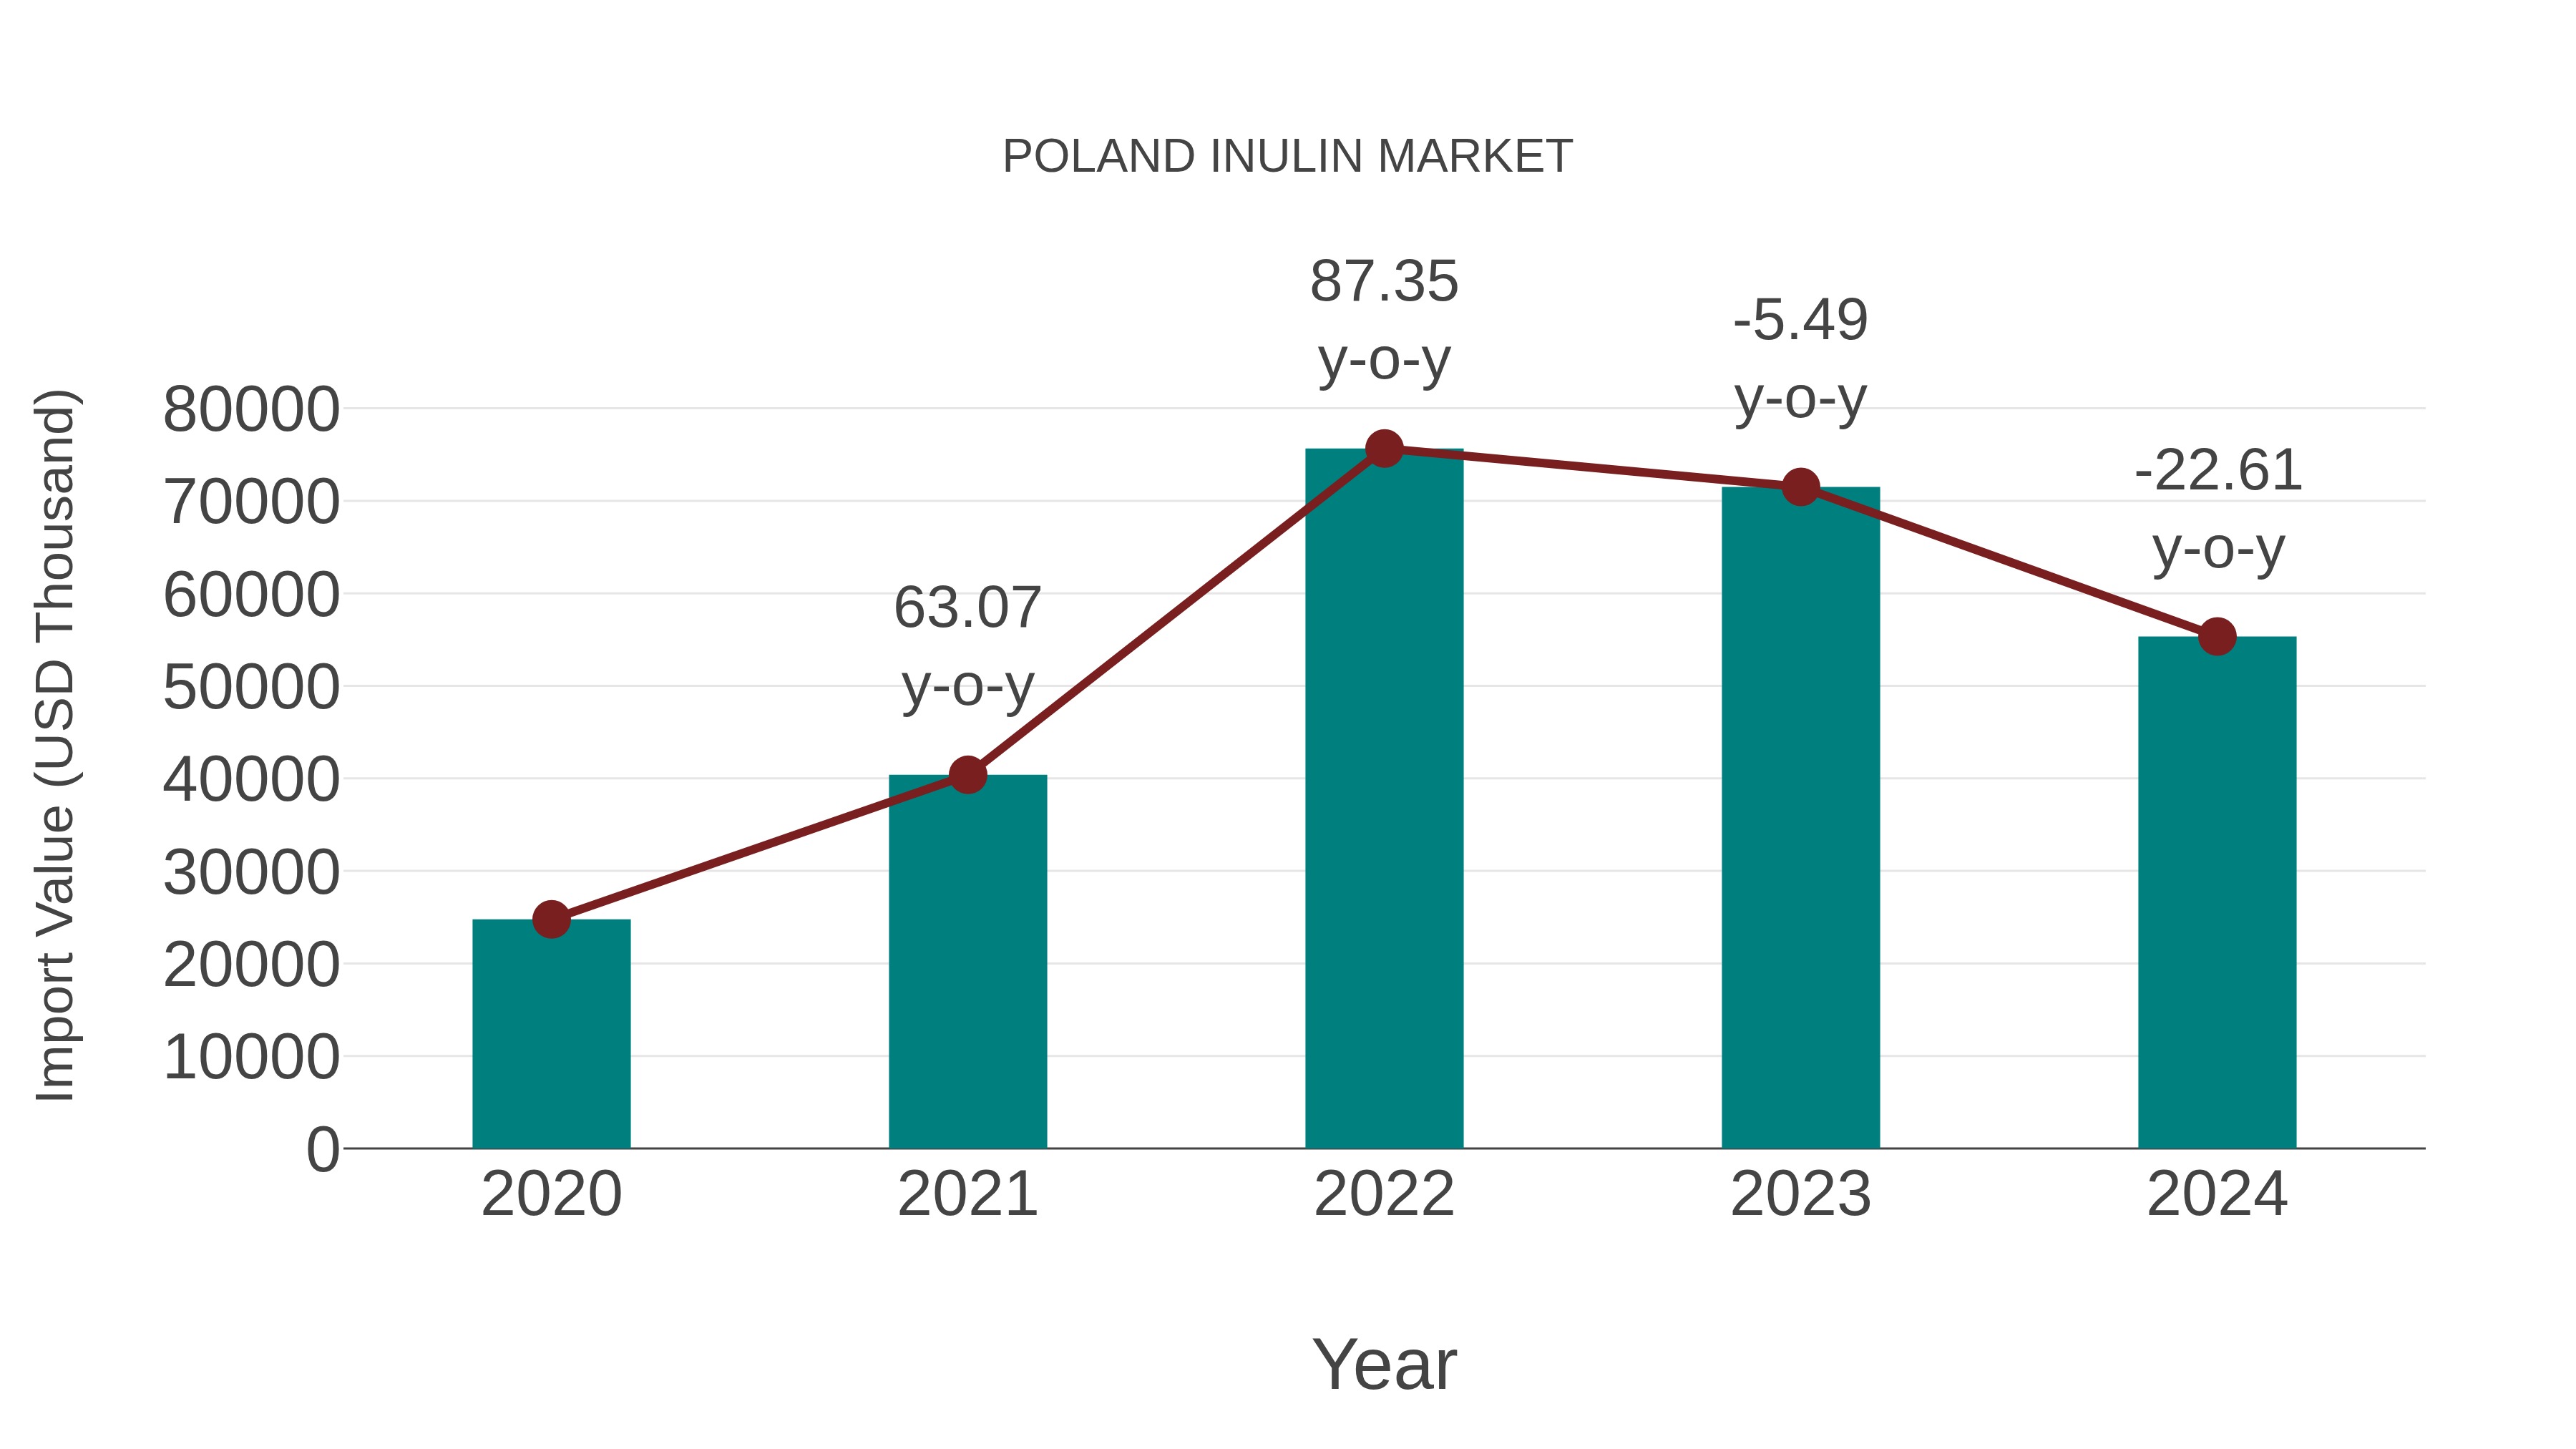
Poland Inulin Market: Import Trend Analysis
In the Poland inulin market, the import trend experienced a decline from 2023 to 2024, with a growth rate of -22.61%. However, the compound annual growth rate (CAGR) for the period 2020-2024 stood at a notable 22.26%. This decline in import momentum could be attributed to shifting demand patterns or changes in trade policies affecting market stability.
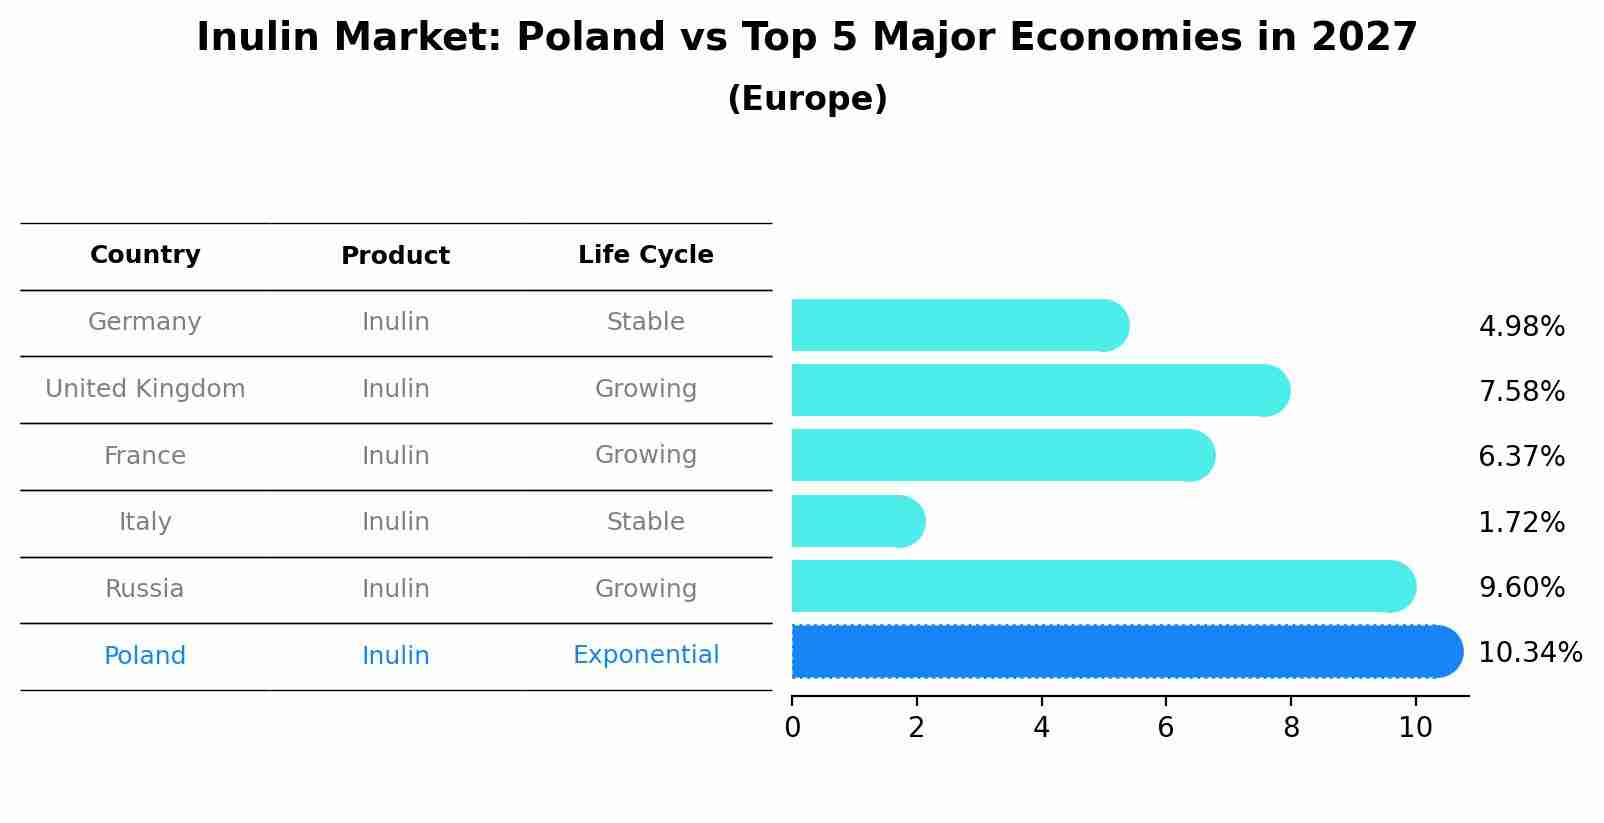
Inulin Market: Poland vs Top 5 Major Economies in 2027 (Europe)
By 2027, Poland's Inulin market is forecasted to achieve a high growth rate of 10.34%, with Germany leading the Europe region, followed by United Kingdom, France, Italy and Russia.
Poland Inulin Market Overview
The inulin market in Poland is expanding with the growing demand for this dietary fiber used in food and beverage products. Inulin is valued for its prebiotic properties and its role in enhancing digestive health and improving product texture. The market is driven by increasing health awareness and consumer preference for functional ingredients.
Drivers of the market
The inulin market in Poland is expanding with the rising demand for inulin as a dietary fiber and functional ingredient in food products. Inulin is valued for its health benefits, including improved digestion and blood sugar regulation. Market growth is driven by increasing consumer awareness of health and wellness, advancements in inulin production technology, and the need for functional food ingredients.
Challenges of the market
The inulin market in Poland faces challenges related to raw material costs and market competition. Inulin, a dietary fiber used in various food and beverage products, requires managing fluctuations in raw material prices and maintaining product quality. Additionally, navigating a competitive market with numerous suppliers and addressing changing consumer preferences for healthier options are crucial challenges. Continuous innovation and effective marketing strategies are essential for market success.
Government Policy of the market
The inulin market benefits from government policies that promote dietary health and the use of functional ingredients. Regulations encourage the development of inulin-rich products that support consumer health. The government supports research initiatives aimed at enhancing the applications of inulin in food products, fostering a competitive environment in the health and nutrition sector.
Key Highlights of the Report:
- Poland Inulin Market Outlook
- Market Size of Poland Inulin Market, 2024
- Forecast of Poland Inulin Market, 2031
- Historical Data and Forecast of Poland Inulin Revenues & Volume for the Period 2018 - 2031
- Poland Inulin Market Trend Evolution
- Poland Inulin Market Drivers and Challenges
- Poland Inulin Price Trends
- Poland Inulin Porter's Five Forces
- Poland Inulin Industry Life Cycle
- Historical Data and Forecast of Poland Inulin Market Revenues & Volume By Form for the Period 2018 - 2031
- Historical Data and Forecast of Poland Inulin Market Revenues & Volume By Powder for the Period 2018 - 2031
- Historical Data and Forecast of Poland Inulin Market Revenues & Volume By Liquid for the Period 2018 - 2031
- Historical Data and Forecast of Poland Inulin Market Revenues & Volume By Nature for the Period 2018 - 2031
- Historical Data and Forecast of Poland Inulin Market Revenues & Volume By Organic for the Period 2018 - 2031
- Historical Data and Forecast of Poland Inulin Market Revenues & Volume By Conventional for the Period 2018 - 2031
- Historical Data and Forecast of Poland Inulin Market Revenues & Volume By Source for the Period 2018 - 2031
- Historical Data and Forecast of Poland Inulin Market Revenues & Volume By Agave for the Period 2018 - 2031
- Historical Data and Forecast of Poland Inulin Market Revenues & Volume By Chicory for the Period 2018 - 2031
- Historical Data and Forecast of Poland Inulin Market Revenues & Volume By Jerusalem Artichoke for the Period 2018 - 2031
- Historical Data and Forecast of Poland Inulin Market Revenues & Volume By Others for the Period 2018 - 2031
- Historical Data and Forecast of Poland Inulin Market Revenues & Volume By Application for the Period 2018 - 2031
- Historical Data and Forecast of Poland Inulin Market Revenues & Volume By Food & Beverages for the Period 2018 - 2031
- Historical Data and Forecast of Poland Inulin Market Revenues & Volume By Dietary Supplements for the Period 2018 - 2031
- Historical Data and Forecast of Poland Inulin Market Revenues & Volume By Pharmaceuticals for the Period 2018 - 2031
- Historical Data and Forecast of Poland Inulin Market Revenues & Volume By Animal Feed for the Period 2018 - 2031
- Poland Inulin Import Export Trade Statistics
- Market Opportunity Assessment By Form
- Market Opportunity Assessment By Nature
- Market Opportunity Assessment By Source
- Market Opportunity Assessment By Application
- Poland Inulin Top Companies Market Share
- Poland Inulin Competitive Benchmarking By Technical and Operational Parameters
- Poland Inulin Company Profiles
- Poland Inulin Key Strategic Recommendations
Frequently Asked Questions About the Market Study (FAQs):
6Wresearch actively monitors the Poland Inulin Market and publishes its comprehensive annual report, highlighting emerging trends, growth drivers, revenue analysis, and forecast outlook. Our insights help businesses to make data-backed strategic decisions with ongoing market dynamics. Our analysts track relevent industries related to the Poland Inulin Market, allowing our clients with actionable intelligence and reliable forecasts tailored to emerging regional needs.
Yes, we provide customisation as per your requirements. To learn more, feel free to contact us on sales@6wresearch.com
1 Executive Summary |
2 Introduction |
2.1 Key Highlights of the Report |
2.2 Report Description |
2.3 Market Scope & Segmentation |
2.4 Research Methodology |
2.5 Assumptions |
3 Poland Inulin Market Overview |
3.1 Poland Country Macro Economic Indicators |
3.2 Poland Inulin Market Revenues & Volume, 2021 & 2031F |
3.3 Poland Inulin Market - Industry Life Cycle |
3.4 Poland Inulin Market - Porter's Five Forces |
3.5 Poland Inulin Market Revenues & Volume Share, By Form, 2021 & 2031F |
3.6 Poland Inulin Market Revenues & Volume Share, By Nature, 2021 & 2031F |
3.7 Poland Inulin Market Revenues & Volume Share, By Source, 2021 & 2031F |
3.8 Poland Inulin Market Revenues & Volume Share, By Application, 2021 & 2031F |
4 Poland Inulin Market Dynamics |
4.1 Impact Analysis |
4.2 Market Drivers |
4.2.1 Growing consumer awareness about the health benefits of inulin as a prebiotic ingredient |
4.2.2 Increasing demand for low-calorie and natural sweeteners in food and beverage products |
4.2.3 Rising prevalence of digestive disorders and the shift towards gut health products |
4.3 Market Restraints |
4.3.1 Fluctuating prices of raw materials used in inulin production |
4.3.2 Stringent regulations and certifications required for inulin production and labeling |
4.3.3 Limited availability of raw materials and production capacity constraints |
5 Poland Inulin Market Trends |
6 Poland Inulin Market, By Types |
6.1 Poland Inulin Market, By Form |
6.1.1 Overview and Analysis |
6.1.2 Poland Inulin Market Revenues & Volume, By Form, 2021-2031F |
6.1.3 Poland Inulin Market Revenues & Volume, By Powder, 2021-2031F |
6.1.4 Poland Inulin Market Revenues & Volume, By Liquid, 2021-2031F |
6.2 Poland Inulin Market, By Nature |
6.2.1 Overview and Analysis |
6.2.2 Poland Inulin Market Revenues & Volume, By Organic, 2021-2031F |
6.2.3 Poland Inulin Market Revenues & Volume, By Conventional, 2021-2031F |
6.3 Poland Inulin Market, By Source |
6.3.1 Overview and Analysis |
6.3.2 Poland Inulin Market Revenues & Volume, By Agave, 2021-2031F |
6.3.3 Poland Inulin Market Revenues & Volume, By Chicory, 2021-2031F |
6.3.4 Poland Inulin Market Revenues & Volume, By Jerusalem Artichoke, 2021-2031F |
6.3.5 Poland Inulin Market Revenues & Volume, By Others, 2021-2031F |
6.4 Poland Inulin Market, By Application |
6.4.1 Overview and Analysis |
6.4.2 Poland Inulin Market Revenues & Volume, By Food & Beverages, 2021-2031F |
6.4.3 Poland Inulin Market Revenues & Volume, By Dietary Supplements, 2021-2031F |
6.4.4 Poland Inulin Market Revenues & Volume, By Pharmaceuticals, 2021-2031F |
6.4.5 Poland Inulin Market Revenues & Volume, By Animal Feed, 2021-2031F |
7 Poland Inulin Market Import-Export Trade Statistics |
7.1 Poland Inulin Market Export to Major Countries |
7.2 Poland Inulin Market Imports from Major Countries |
8 Poland Inulin Market Key Performance Indicators |
8.1 Research and development investment in inulin-based product innovation |
8.2 Number of new product launches containing inulin |
8.3 Investment in marketing and educational campaigns promoting the benefits of inulin |
9 Poland Inulin Market - Opportunity Assessment |
9.1 Poland Inulin Market Opportunity Assessment, By Form, 2021 & 2031F |
9.2 Poland Inulin Market Opportunity Assessment, By Nature, 2021 & 2031F |
9.3 Poland Inulin Market Opportunity Assessment, By Source, 2021 & 2031F |
9.4 Poland Inulin Market Opportunity Assessment, By Application, 2021 & 2031F |
10 Poland Inulin Market - Competitive Landscape |
10.1 Poland Inulin Market Revenue Share, By Companies, 2024 |
10.2 Poland Inulin Market Competitive Benchmarking, By Operating and Technical Parameters |
11 Company Profiles |
12 Recommendations |
13 Disclaimer |
Export potential assessment - trade Analytics for 2030
Export potential enables firms to identify high-growth global markets with greater confidence by combining advanced trade intelligence with a structured quantitative methodology. The framework analyzes emerging demand trends and country-level import patterns while integrating macroeconomic and trade datasets such as GDP and population forecasts, bilateral import–export flows, tariff structures, elasticity differentials between developed and developing economies, geographic distance, and import demand projections. Using weighted trade values from 2020–2024 as the base period to project country-to-country export potential for 2030, these inputs are operationalized through calculated drivers such as gravity model parameters, tariff impact factors, and projected GDP per-capita growth. Through an analysis of hidden potentials, demand hotspots, and market conditions that are most favorable to success, this method enables firms to focus on target countries, maximize returns, and global expansion with data, backed by accuracy.
By factoring in the projected importer demand gap that is currently unmet and could be potential opportunity, it identifies the potential for the Exporter (Country) among 190 countries, against the general trade analysis, which identifies the biggest importer or exporter.
To discover high-growth global markets and optimize your business strategy:
Click Here
Pricing
- Single User License$ 1,995
- Department License$ 2,400
- Site License$ 3,120
- Global License$ 3,795

Search
Thought Leadership and Analyst Meet


Our Clients
Latest Reports
- Taiwan Food Delivery Platform Market (2026-2032) | Companies, Outlook, Analysis, Trends, Value, Revenue, Segmentation, Share, Forecast, Competitive Landscape, Growth, Size & Forecast
- United Kingdom (UK) Long-term Care Insurance Market (2026-2032) | Growth, Share, Consumer Insights, Drivers, Opportunities, Competition, Pricing Analysis, Segments, Restraints, Companies, Competitive, Value, Outlook, Size, Demand, Analysis, Challenges, Strategic Insights, Investment Trends, Revenue, Trends, Supply, Forecast
- United Kingdom (UK) Long Term Care Market (2026-2032) | Companies, Outlook, Analysis, Trends, Value, Revenue, Segmentation, Share, Forecast, Competitive Landscape, Growth, Size & Forecast
- Iraq Insulation and Waterproofing Market (2026-2032) | Outlook, Drivers, Growth, Size, Share, Industry, Revenue, Trends, Demand, Competitive, Strategic Insights, Opportunities, Segments, Companies, Challenges, Strategy, Consumer Insights, Analysis, Investment Trends, Value, Segmentation, Forecast, Restraints
- India Switchgear Market Outlook (2026-2032) | Size, Share, Trends, Growth, Revenue, Forecast, Analysis, Value, Outlook
- Pakistan Contraceptive Implants Market (2025-2031) | Demand, Growth, Size, Share, Industry, Pricing Analysis, Competitive, Strategic Insights, Strategy, Consumer Insights, Analysis, Investment Trends, Opportunities, Revenue, Segments, Value, Segmentation, Supply, Forecast, Restraints, Outlook, Competition, Drivers, Trends, Companies, Challenges
- Sri Lanka Packaging Market (2026-2032) | Outlook, Competition, Drivers, Trends, Demand, Pricing Analysis, Competitive, Strategic Insights, Companies, Challenges, Strategy, Consumer Insights, Analysis, Investment Trends, Opportunities, Growth, Size, Share, Industry, Revenue, Segments, Value, Segmentation, Supply, Forecast, Restraints
- India Kids Watches Market (2026-2032) | Strategy, Consumer Insights, Analysis, Investment Trends, Opportunities, Growth, Size, Share, Industry, Revenue, Segments, Value, Segmentation, Supply, Forecast, Restraints, Outlook, Competition, Drivers, Trends, Demand, Pricing Analysis, Competitive, Strategic Insights, Companies, Challenges
- Saudi Arabia Core Assurance Service Market (2025-2031) | Strategy, Consumer Insights, Analysis, Investment Trends, Opportunities, Growth, Size, Share, Industry, Revenue, Segments, Value, Segmentation, Supply, Forecast, Restraints, Outlook, Competition, Drivers, Trends, Demand, Pricing Analysis, Competitive, Strategic Insights, Companies, Challenges
- Romania Uninterruptible Power Supply (UPS) Market (2026-2032) | Industry, Analysis, Revenue, Size, Forecast, Outlook, Value, Trends, Share, Growth & Companies
Industry Events and Analyst Meet

India EV Show 2026

EV tech India Expo 2026

Auto Tech Asia 2026

Battery Tech India 2026

Smart Production Solutions Guangzhou 2026
Whitepaper
- Middle East & Africa Commercial Security Market Click here to view more.
- Middle East & Africa Fire Safety Systems & Equipment Market Click here to view more.
- GCC Drone Market Click here to view more.
- Middle East Lighting Fixture Market Click here to view more.
- GCC Physical & Perimeter Security Market Click here to view more.
6WResearch In News
- Doha a strategic location for EV manufacturing hub: IPA Qatar
- Demand for luxury TVs surging in the GCC, says Samsung
- Empowering Growth: The Thriving Journey of Bangladesh’s Cable Industry
- Demand for luxury TVs surging in the GCC, says Samsung
- Video call with a traditional healer? Once unthinkable, it’s now common in South Africa
- Intelligent Buildings To Smooth GCC’s Path To Net Zero