Poland Inventory Tags Market (2026-2032) Outlook | Value, Companies, Revenue, Analysis, Forecast, Growth, Trends, Share, Size & Industry
Market Forecast By Technology (Barcodes, RFID), By Label Type (Plastic, Paper, Metal), By Printing technology (Digital Printing, Flexography, Lithography, Screen Printing, Gravure, Others) And Competitive Landscape
| Product Code: ETC4601296 | Publication Date: Jul 2023 | Updated Date: Mar 2026 | Product Type: Report | |
| Publisher: 6Wresearch | Author: Summon Dutta | No. of Pages: 85 | No. of Figures: 45 | No. of Tables: 25 |
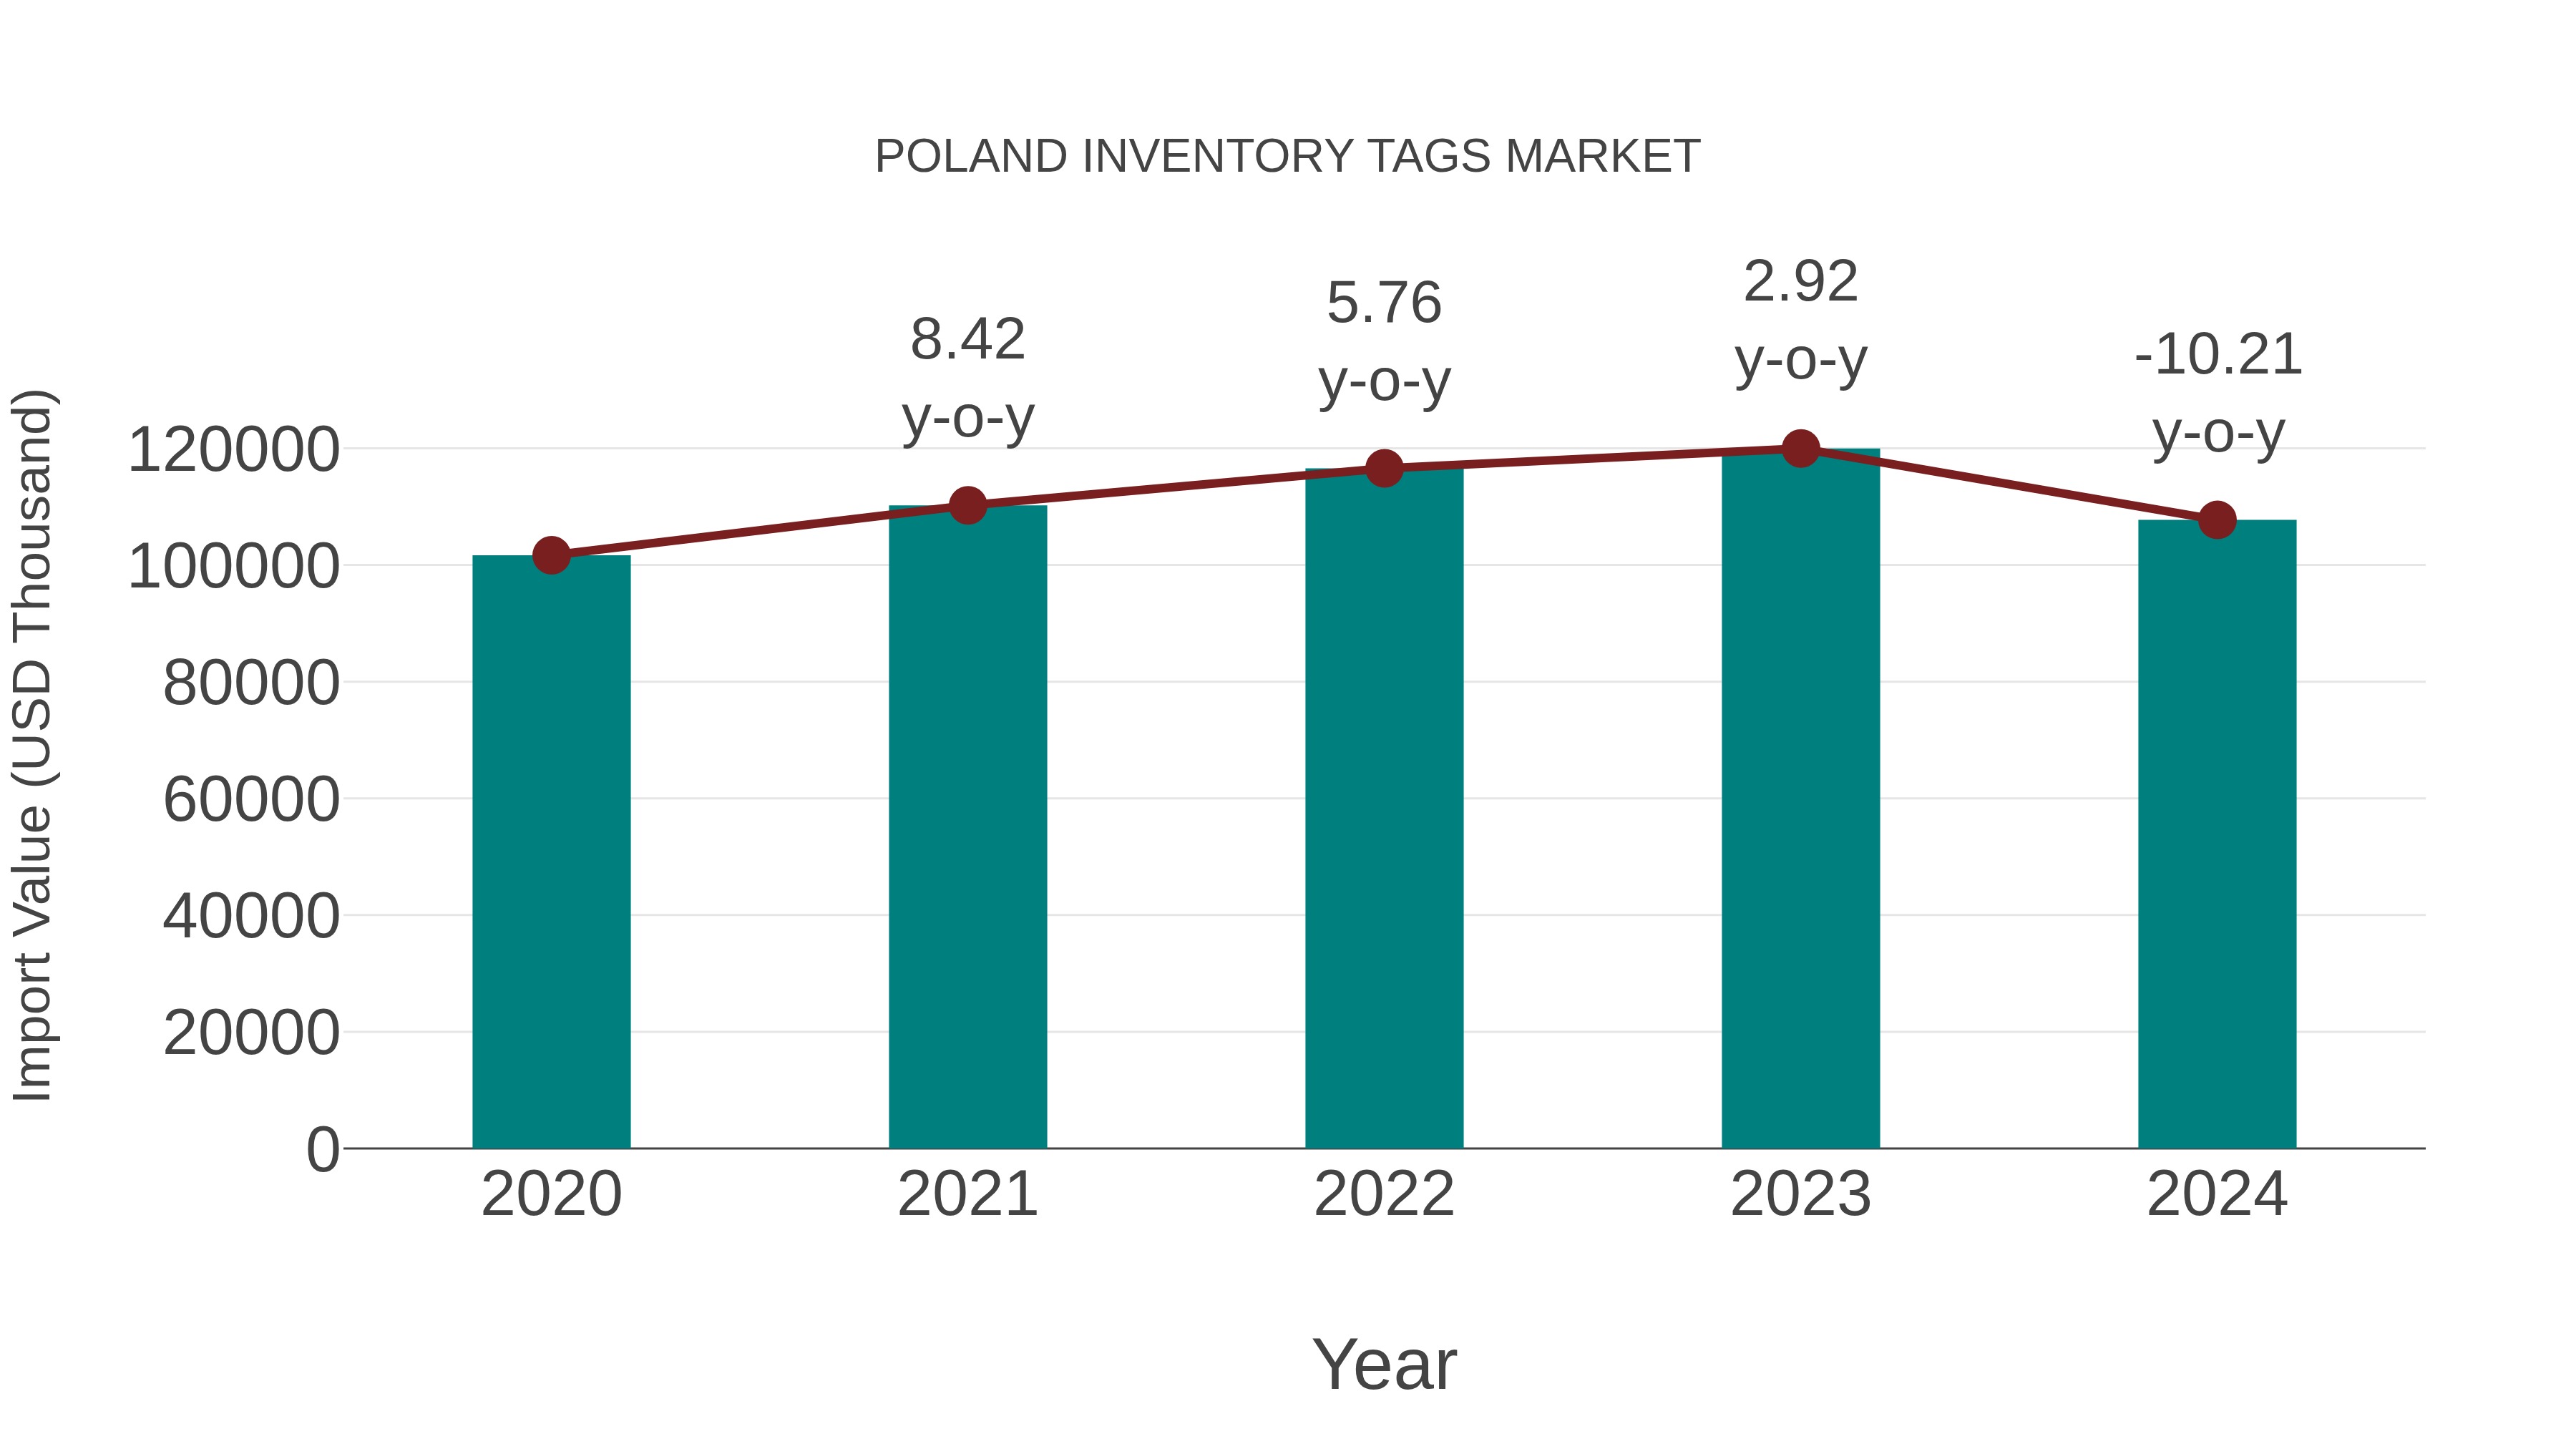
Poland Inventory Tags Market: Import Trend Analysis
In 2024, Poland import trend for inventory tags saw a decline of -10.21% compared to 2023, with a compound annual growth rate (CAGR) of 1.46% from 2020 to 2024. This negative growth could be attributed to a shift in demand dynamics or changes in trade policies impacting the market stability.
Poland Inventory Tags Market Overview
Poland`s inventory tags market is growing with the need for efficient tracking and management of inventory in various sectors, including retail, logistics, and manufacturing. Inventory tags, including RFID and barcode tags, help businesses improve accuracy and efficiency in inventory management. The market is driven by advancements in tracking technologies and the need for better inventory control.
Drivers of the market
The inventory tags market in Poland is growing with the increasing need for efficient inventory management and tracking solutions. Inventory tags are used to label and track products in warehouses and retail environments. Market expansion is supported by advancements in tagging technology, rising demand for automated inventory systems, and the need for improved supply chain visibility.
Challenges of the market
The inventory tags market in Poland encounters challenges related to technological advancements and market competition. Developing tags that offer improved functionality, durability, and integration with inventory management systems while meeting industry standards is crucial. Managing production costs and navigating a competitive market where differentiation through advanced features and performance is essential are key challenges. Additionally, addressing evolving customer needs and integrating new technologies into inventory tags require ongoing adaptation and improvement.
Government Policy of the market
The government promotes the inventory tags market by emphasizing technological advancement and efficiency in supply chain management. Policies support the adoption of advanced tagging technologies that enhance tracking and management of inventory. The government provides funding for research initiatives aimed at improving inventory management solutions, fostering innovation and competitiveness.
Key Highlights of the Report:
- Poland Inventory Tags Market Outlook
- Market Size of Poland Inventory Tags Market, 2025
- Forecast of Poland Inventory Tags Market, 2032
- Historical Data and Forecast of Poland Inventory Tags Revenues & Volume for the Period 2022-2032F
- Poland Inventory Tags Market Trend Evolution
- Poland Inventory Tags Market Drivers and Challenges
- Poland Inventory Tags Price Trends
- Poland Inventory Tags Porter's Five Forces
- Poland Inventory Tags Industry Life Cycle
- Historical Data and Forecast of Poland Inventory Tags Market Revenues & Volume By Technology for the Period 2022-2032F
- Historical Data and Forecast of Poland Inventory Tags Market Revenues & Volume By Barcodes for the Period 2022-2032F
- Historical Data and Forecast of Poland Inventory Tags Market Revenues & Volume By RFID for the Period 2022-2032F
- Historical Data and Forecast of Poland Inventory Tags Market Revenues & Volume By Label Type for the Period 2022-2032F
- Historical Data and Forecast of Poland Inventory Tags Market Revenues & Volume By Plastic for the Period 2022-2032F
- Historical Data and Forecast of Poland Inventory Tags Market Revenues & Volume By Paper for the Period 2022-2032F
- Historical Data and Forecast of Poland Inventory Tags Market Revenues & Volume By Metal for the Period 2022-2032F
- Historical Data and Forecast of Poland Inventory Tags Market Revenues & Volume By Printing technology for the Period 2022-2032F
- Historical Data and Forecast of Poland Inventory Tags Market Revenues & Volume By Digital Printing for the Period 2022-2032F
- Historical Data and Forecast of Poland Inventory Tags Market Revenues & Volume By Flexography for the Period 2022-2032F
- Historical Data and Forecast of Poland Inventory Tags Market Revenues & Volume By Lithography for the Period 2022-2032F
- Historical Data and Forecast of Poland Inventory Tags Market Revenues & Volume By Screen Printing for the Period 2022-2032F
- Historical Data and Forecast of Poland Inventory Tags Market Revenues & Volume By Gravure for the Period 2022-2032F
- Historical Data and Forecast of Poland Inventory Tags Market Revenues & Volume By Others for the Period 2022-2032F
- Poland Inventory Tags Import Export Trade Statistics
- Market Opportunity Assessment By Technology
- Market Opportunity Assessment By Label Type
- Market Opportunity Assessment By Printing technology
- Poland Inventory Tags Top Companies Market Share
- Poland Inventory Tags Competitive Benchmarking By Technical and Operational Parameters
- Poland Inventory Tags Company Profiles
- Poland Inventory Tags Key Strategic Recommendations
Poland Inventory Tags Market (2026-2032): FAQs
The Poland inventory tags market is expected to witness significant growth in the coming years due to the increasing adoption of RFID technology by companies like Allegro and Komputronik for efficient inventory management.
Companies like Zebra Technologies and Avery Dennison are expanding their presence in Poland, creating opportunities for new partnerships and collaborations in the inventory tags sector. Additionally, the increasing adoption of RFID technology by e-commerce giants like Allegro.pl presents a promising avenue for innovative inventory management solutions.
The Poland inventory tags market refers to the industry that provides various types of tags, labels, and tracking solutions used for inventory management in sectors such as retail, logistics, healthcare, and manufacturing. Companies like Zebra Technologies, Datalogic, and Sato offer a range of RFID tags, barcode labels, and other inventory tracking technologies tailored to meet the diverse needs of businesses in Poland.
In Poland, consumers are increasingly demanding RFID inventory tags due to their efficiency in tracking goods. Technology-wise, companies like Zebra Technologies and Impinj are developing advanced RFID solutions that offer real-time data for inventory management. On the policy front, the Polish government is focusing on enhancing supply chain transparency, leading to increased adoption of inventory tracking technologies like barcode labels and RFID tags.
The Poland inventory tags market is primarily driven by the increasing adoption of RFID technology by companies like Eurocash Group and Biedronka to improve inventory management and streamline operations. However, challenges such as high implementation costs and concerns over data security are shaping the dynamics of this market. Additionally, the demand for real-time tracking solutions is fueling innovation and competition among key players like Zebra Technologies and Datalogic.
6Wresearch actively monitors the Poland Inventory Tags Market and publishes its comprehensive annual report, highlighting emerging trends, growth drivers, revenue analysis, and forecast outlook. Our insights help businesses to make data-backed strategic decisions with ongoing market dynamics. Our analysts track relevent industries related to the Poland Inventory Tags Market, allowing our clients with actionable intelligence and reliable forecasts tailored to emerging regional needs.
Yes, we provide customisation as per your requirements. To learn more, feel free to contact us on sales@6wresearch.com
1 Executive Summary |
2 Introduction |
2.1 Key Highlights of the Report |
2.2 Report Description |
2.3 Market Scope & Segmentation |
2.4 Research Methodology |
2.5 Assumptions |
3 Poland Inventory Tags Market Overview |
3.1 Poland Country Macro Economic Indicators |
3.2 Poland Inventory Tags Market Revenues & Volume, 2022 & 2032F |
3.3 Poland Inventory Tags Market - Industry Life Cycle |
3.4 Poland Inventory Tags Market - Porter's Five Forces |
3.5 Poland Inventory Tags Market Revenues & Volume Share, By Technology, 2022 & 2032F |
3.6 Poland Inventory Tags Market Revenues & Volume Share, By Label Type, 2022 & 2032F |
3.7 Poland Inventory Tags Market Revenues & Volume Share, By Printing technology, 2022 & 2032F |
4 Poland Inventory Tags Market Dynamics |
4.1 Impact Analysis |
4.2 Market Drivers |
4.2.1 Increasing adoption of inventory management systems in Poland |
4.2.2 Growing e-commerce sector leading to higher demand for inventory tags |
4.2.3 Stringent regulations mandating inventory tracking and management |
4.3 Market Restraints |
4.3.1 High initial investment required for implementing inventory tagging systems |
4.3.2 Technological complexities in integrating inventory tags with existing systems |
5 Poland Inventory Tags Market Trends |
6 Poland Inventory Tags Market, By Types |
6.1 Poland Inventory Tags Market, By Technology |
6.1.1 Overview and Analysis |
6.1.2 Poland Inventory Tags Market Revenues & Volume, By Technology, 2022-2032F |
6.1.3 Poland Inventory Tags Market Revenues & Volume, By Barcodes, 2022-2032F |
6.1.4 Poland Inventory Tags Market Revenues & Volume, By RFID, 2022-2032F |
6.2 Poland Inventory Tags Market, By Label Type |
6.2.1 Overview and Analysis |
6.2.2 Poland Inventory Tags Market Revenues & Volume, By Plastic, 2022-2032F |
6.2.3 Poland Inventory Tags Market Revenues & Volume, By Paper, 2022-2032F |
6.2.4 Poland Inventory Tags Market Revenues & Volume, By Metal, 2022-2032F |
6.3 Poland Inventory Tags Market, By Printing technology |
6.3.1 Overview and Analysis |
6.3.2 Poland Inventory Tags Market Revenues & Volume, By Digital Printing, 2022-2032F |
6.3.3 Poland Inventory Tags Market Revenues & Volume, By Flexography, 2022-2032F |
6.3.4 Poland Inventory Tags Market Revenues & Volume, By Lithography, 2022-2032F |
6.3.5 Poland Inventory Tags Market Revenues & Volume, By Screen Printing, 2022-2032F |
6.3.6 Poland Inventory Tags Market Revenues & Volume, By Gravure, 2022-2032F |
6.3.7 Poland Inventory Tags Market Revenues & Volume, By Others, 2022-2032F |
7 Poland Inventory Tags Market Import-Export Trade Statistics |
7.1 Poland Inventory Tags Market Export to Major Countries |
7.2 Poland Inventory Tags Market Imports from Major Countries |
8 Poland Inventory Tags Market Key Performance Indicators |
8.1 Average time saved in inventory management processes with the use of inventory tags |
8.2 Percentage reduction in inventory shrinkage rates after implementing inventory tagging systems |
8.3 Increase in operational efficiency as measured by order fulfillment times |
9 Poland Inventory Tags Market - Opportunity Assessment |
9.1 Poland Inventory Tags Market Opportunity Assessment, By Technology, 2022 & 2032F |
9.2 Poland Inventory Tags Market Opportunity Assessment, By Label Type, 2022 & 2032F |
9.3 Poland Inventory Tags Market Opportunity Assessment, By Printing technology, 2022 & 2032F |
10 Poland Inventory Tags Market - Competitive Landscape |
10.1 Poland Inventory Tags Market Revenue Share, By Companies, 2025 |
10.2 Poland Inventory Tags Market Competitive Benchmarking, By Operating and Technical Parameters |
11 Company Profiles |
12 Recommendations |
13 Disclaimer |
Global Go To Market Strategy - 2030
Export potential enables firms to identify high-growth global markets with greater confidence by combining advanced trade intelligence with a structured quantitative methodology. The framework analyzes emerging demand trends and country-level import patterns while integrating macroeconomic and trade datasets such as GDP and population forecasts, bilateral import–export flows, tariff structures, elasticity differentials between developed and developing economies, geographic distance, and import demand projections. Using weighted trade values from 2020–2024 as the base period to project country-to-country export potential for 2030, these inputs are operationalized through calculated drivers such as gravity model parameters, tariff impact factors, and projected GDP per-capita growth. Through an analysis of hidden potentials, demand hotspots, and market conditions that are most favorable to success, this method enables firms to focus on target countries, maximize returns, and global expansion with data, backed by accuracy.
By factoring in the projected importer demand gap that is currently unmet and could be potential opportunity, it identifies the potential for the Exporter (Country) among 190 countries, against the general trade analysis, which identifies the biggest importer or exporter.
To discover high-growth global markets and optimize your business strategy:
Click Here
Pricing
- Single User License$ 1,995
- Department License$ 2,400
- Site License$ 3,120
- Global License$ 3,795

Leadership Perspectives from Industry Events
Search
Thought Leadership and Analyst Meet


Our Clients
6WResearch In News
- India Air Conditioner Market Set for Strong Rebound in 2026 After Weather-Led Correction and GST-Driven Recovery: 6Wresearch
- ADAS in India: How Automatic Emergency Braking, Blind Spot Detection & Driver Monitoring are Transforming Road Safety
- Doha a strategic location for EV manufacturing hub: IPA Qatar
- Demand for luxury TVs surging in the GCC, says Samsung
- Empowering Growth: The Thriving Journey of Bangladesh’s Cable Industry
- Demand for luxury TVs surging in the GCC, says Samsung
Latest Reports
- Nicaragua RPG Gaming Market (2026-2032)
- New Zealand RPG Gaming Market (2026-2032)
- Netherlands RPG Gaming Market (2026-2032)
- Nauru RPG Gaming Market (2026-2032)
- Namibia RPG Gaming Market (2026-2032)
- Mozambique RPG Gaming Market (2026-2032)
- Montenegro RPG Gaming Market (2026-2032)
- Mongolia RPG Gaming Market (2026-2032)
- Monaco RPG Gaming Market (2026-2032)
- Micronesia RPG Gaming Market (2026-2032)
Industry Events and Analyst Meet

EV India Expo 2026

HIMTEX 2026

India Refining Summit 2026

India EV Show 2026

EV tech India Expo 2026
Whitepaper
- Middle East & Africa Commercial Security Market Click here to view more.
- Middle East & Africa Fire Safety Systems & Equipment Market Click here to view more.
- GCC Drone Market Click here to view more.
- Middle East Lighting Fixture Market Click here to view more.
- GCC Physical & Perimeter Security Market Click here to view more.