Poland Lacquer Market (2026-2032) Outlook | Companies, Analysis, Growth, Size, Share, Revenue, Forecast, Value, Industry & Trends
Market Forecast By Product Type (Nitrocellulose Lacquers, Pre-Catalyzed Lacquers, Acid Catalyzed Lacquer, Polyurethane Lacquers, Radiation Curing-Lacquers, Unsaturated Polyester Lacquers, Other Product Types), By Formulation Type (Solvent Based, Water Based), By Application (Wood, Metal, Plastics, Leather and Textiles, Others), By Distribution Channel (Modern Trade, Departmental Store, Online Retailers, Specialty Stores, Direct Sales, Other Sales Channel), By End Use Industry (Automotive, Architectural, Furniture, Cosmetics, Other End Users) And Competitive Landscape
| Product Code: ETC330195 | Publication Date: Aug 2022 | Updated Date: Mar 2026 | Product Type: Market Research Report | |
| Publisher: 6Wresearch | Author: Shubham Padhi | No. of Pages: 75 | No. of Figures: 35 | No. of Tables: 20 |
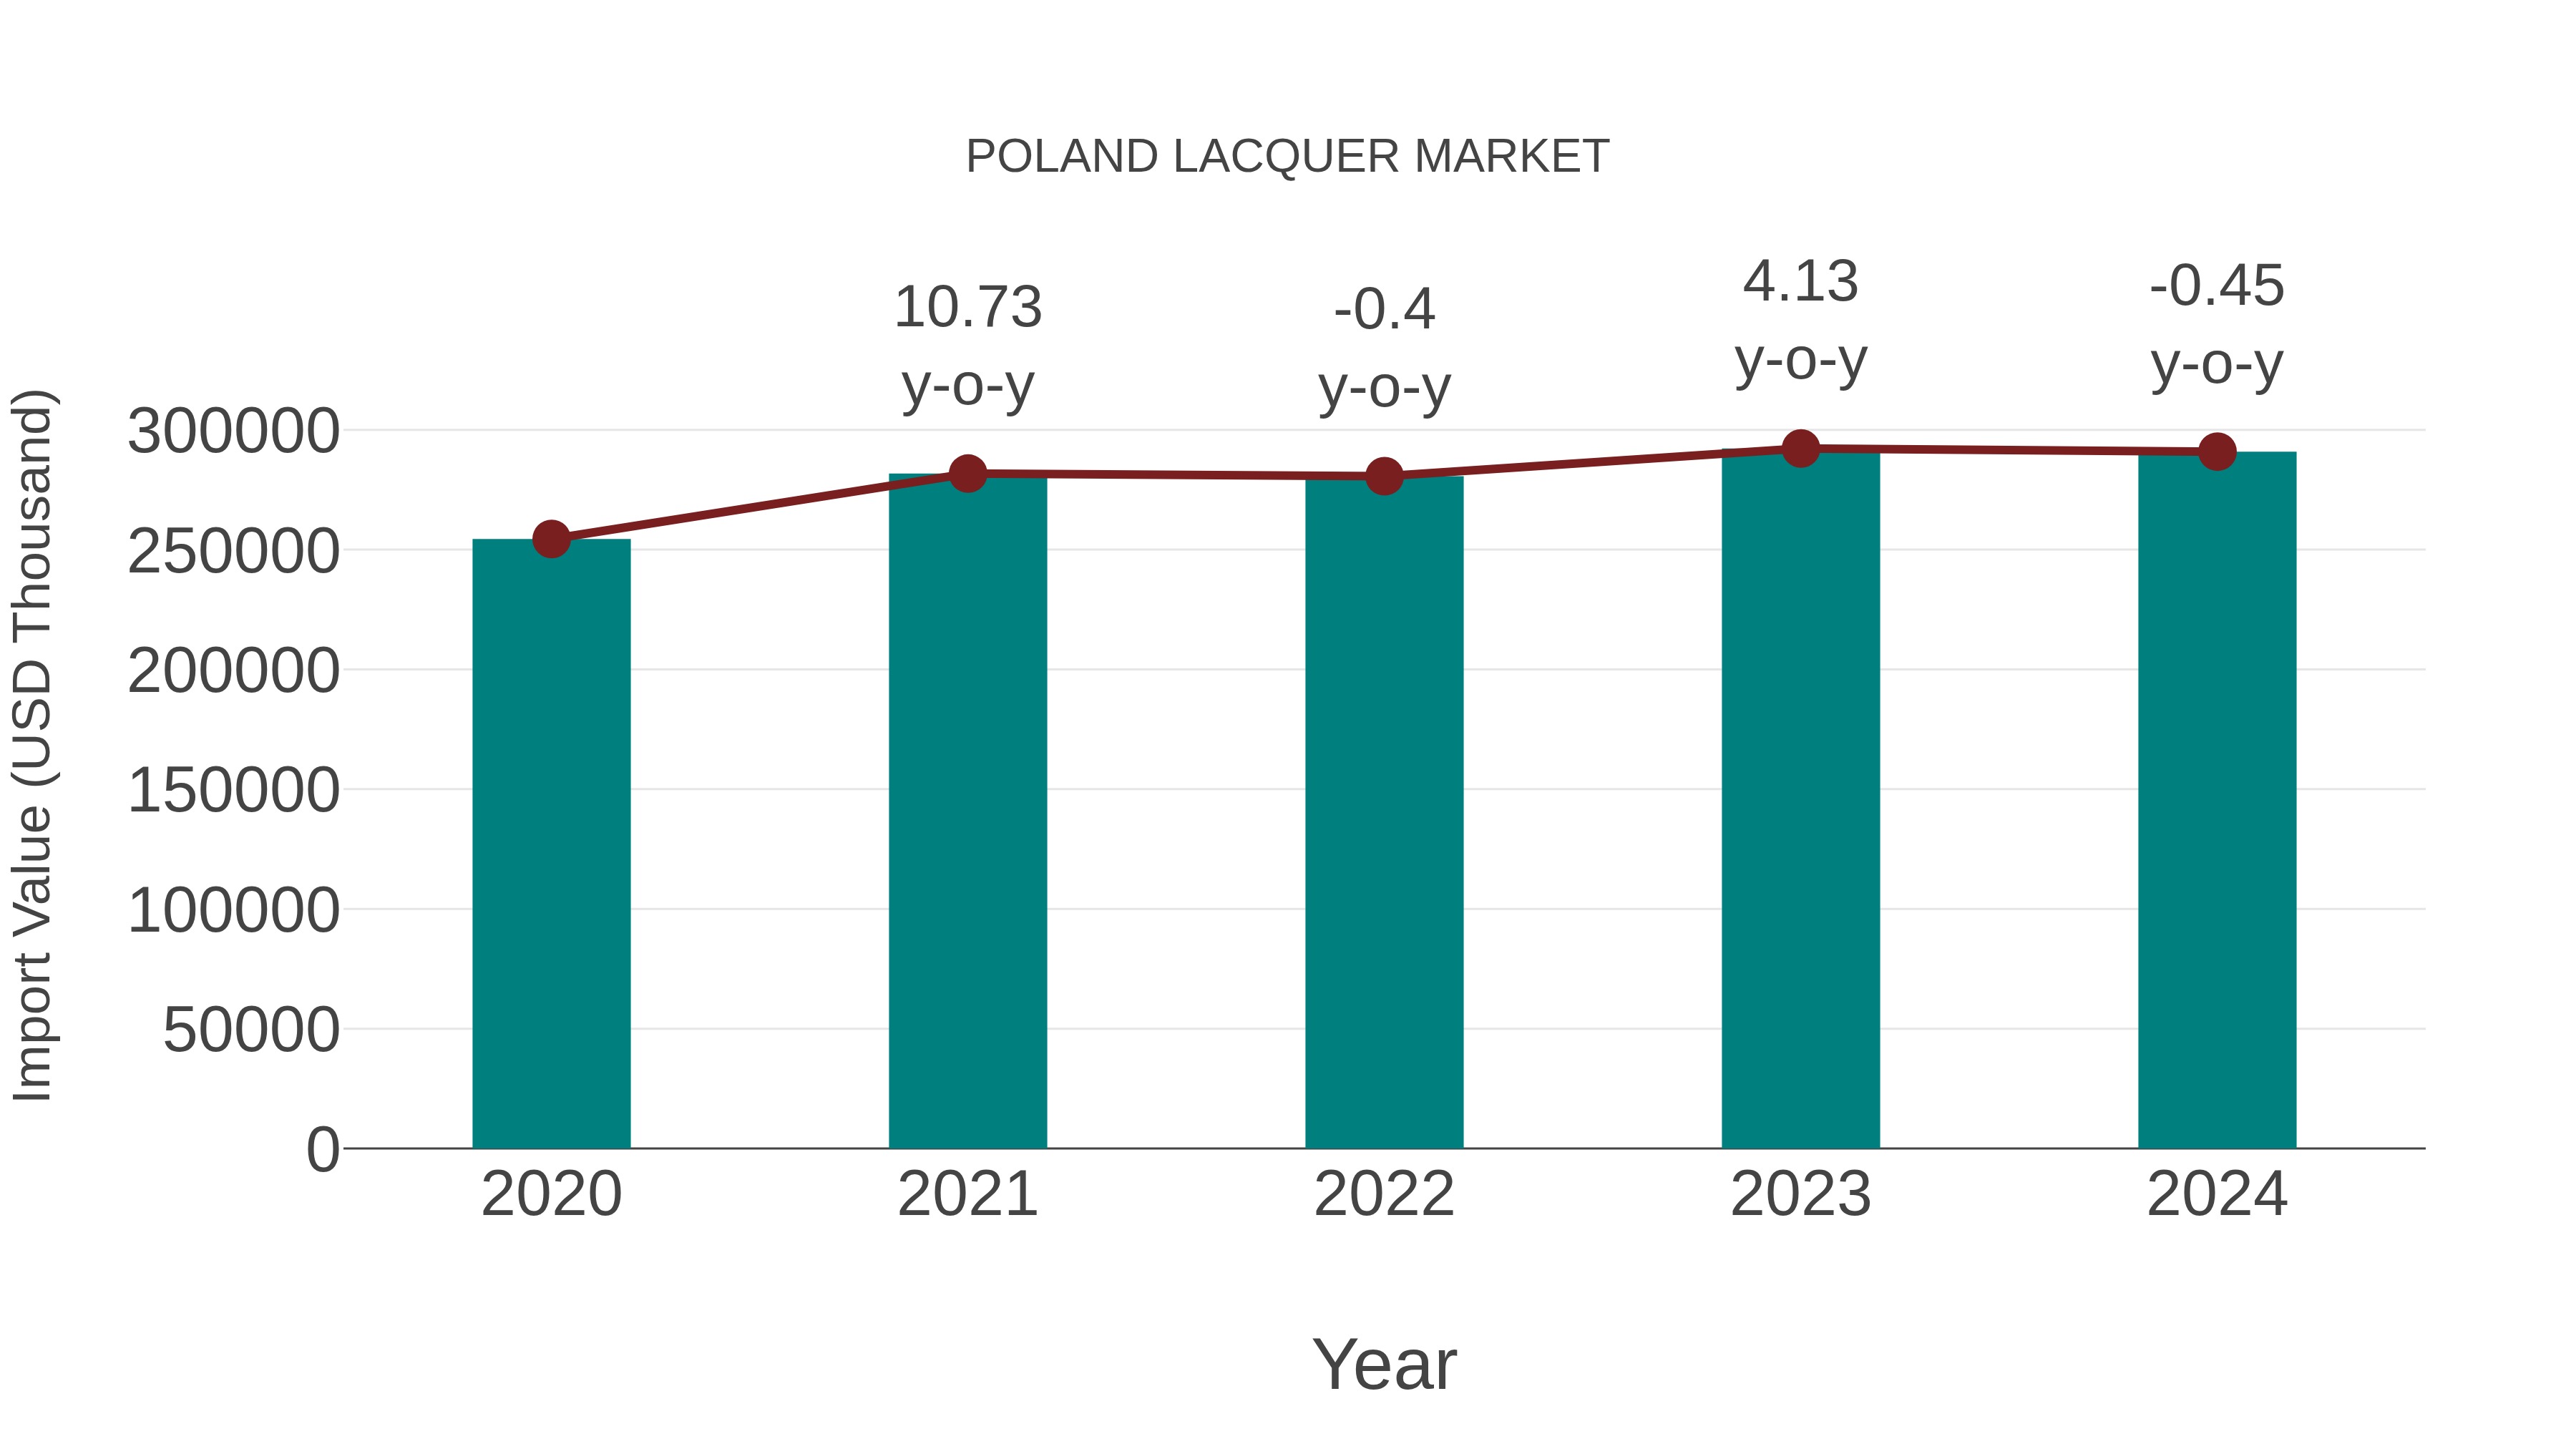
Poland Lacquer Market: Import Trend Analysis
In the Poland lacquer market, the import trend exhibited a slight decline from 2023 to 2024, with a growth rate of -0.45%. However, the compound annual growth rate (CAGR) for the period 2020-2024 stood at a positive 3.4%. This dip in import momentum could be attributed to a temporary demand shift or a market adjustment following previous growth.
Poland Lacquer Market Overview
Poland`s lacquer market is expanding with the use of lacquer coatings in applications such as furniture, automotive, and industrial finishes. Lacquers are valued for their protective and decorative properties. The market growth is driven by the increasing demand for high-quality finishes and the rising use of lacquer in various consumer and industrial products.
Drivers of the market
The lacquer market in Poland is growing with the increasing use of lacquer coatings in various applications, including furniture, automotive, and industrial finishes. Lacquer provides a durable and high-gloss finish for a range of products. Market expansion is supported by advancements in lacquer technology, rising demand for aesthetically pleasing and protective coatings, and the need for high-performance finishing solutions.
Challenges of the market
The lacquer market in Poland encounters challenges related to raw material costs and environmental regulations. Managing fluctuations in raw material prices while ensuring product quality and consistency is crucial. Additionally, adhering to environmental regulations and addressing sustainability concerns related to lacquer production are important for market success. The market must also adapt to changing consumer preferences and industry trends.
Government Policy of the market
The lacquer market in Poland is shaped by policies related to chemical safety and environmental impact. The government enforces standards for the production, use, and disposal of lacquers to ensure they are safe for consumers and environmentally friendly. Regulations focus on reducing the environmental footprint of lacquer products and promoting the use of safer, more sustainable alternatives.
Key Highlights of the Report:
- Poland Lacquer Market Outlook
- Market Size of Poland Lacquer Market, 2025
- Forecast of Poland Lacquer Market, 2032
- Historical Data and Forecast of Poland Lacquer Revenues & Volume for the Period 2022-2032F
- Poland Lacquer Market Trend Evolution
- Poland Lacquer Market Drivers and Challenges
- Poland Lacquer Price Trends
- Poland Lacquer Porter's Five Forces
- Poland Lacquer Industry Life Cycle
- Historical Data and Forecast of Poland Lacquer Market Revenues & Volume By Product Type for the Period 2022-2032F
- Historical Data and Forecast of Poland Lacquer Market Revenues & Volume By Nitrocellulose Lacquers for the Period 2022-2032F
- Historical Data and Forecast of Poland Lacquer Market Revenues & Volume By Pre-Catalyzed Lacquers for the Period 2022-2032F
- Historical Data and Forecast of Poland Lacquer Market Revenues & Volume By Acid Catalyzed Lacquer for the Period 2022-2032F
- Historical Data and Forecast of Poland Lacquer Market Revenues & Volume By Polyurethane Lacquers for the Period 2022-2032F
- Historical Data and Forecast of Poland Lacquer Market Revenues & Volume By Radiation Curing-Lacquers for the Period 2022-2032F
- Historical Data and Forecast of Poland Lacquer Market Revenues & Volume By Unsaturated Polyester Lacquers for the Period 2022-2032F
- Historical Data and Forecast of Poland Lacquer Market Revenues & Volume By Other Product Types for the Period 2022-2032F
- Historical Data and Forecast of Poland Lacquer Market Revenues & Volume By Formulation Type for the Period 2022-2032F
- Historical Data and Forecast of Poland Lacquer Market Revenues & Volume By Solvent Based for the Period 2022-2032F
- Historical Data and Forecast of Poland Lacquer Market Revenues & Volume By Water Based for the Period 2022-2032F
- Historical Data and Forecast of Poland Lacquer Market Revenues & Volume By Application for the Period 2022-2032F
- Historical Data and Forecast of Poland Lacquer Market Revenues & Volume By Wood for the Period 2022-2032F
- Historical Data and Forecast of Poland Lacquer Market Revenues & Volume By Metal for the Period 2022-2032F
- Historical Data and Forecast of Poland Lacquer Market Revenues & Volume By Plastics for the Period 2022-2032F
- Historical Data and Forecast of Poland Lacquer Market Revenues & Volume By Leather and Textiles for the Period 2022-2032F
- Historical Data and Forecast of Poland Lacquer Market Revenues & Volume By Others for the Period 2022-2032F
- Historical Data and Forecast of Poland Lacquer Market Revenues & Volume By Distribution Channel for the Period 2022-2032F
- Historical Data and Forecast of Poland Lacquer Market Revenues & Volume By Modern Trade for the Period 2022-2032F
- Historical Data and Forecast of Poland Lacquer Market Revenues & Volume By Departmental Store for the Period 2022-2032F
- Historical Data and Forecast of Poland Lacquer Market Revenues & Volume By Online Retailers for the Period 2022-2032F
- Historical Data and Forecast of Poland Lacquer Market Revenues & Volume By Specialty Stores for the Period 2022-2032F
- Historical Data and Forecast of Poland Lacquer Market Revenues & Volume By Direct Sales for the Period 2022-2032F
- Historical Data and Forecast of Poland Lacquer Market Revenues & Volume By Other Sales Channel for the Period 2022-2032F
- Historical Data and Forecast of Poland Lacquer Market Revenues & Volume By End Use Industry for the Period 2022-2032F
- Historical Data and Forecast of Poland Lacquer Market Revenues & Volume By Automotive for the Period 2022-2032F
- Historical Data and Forecast of Poland Lacquer Market Revenues & Volume By Architectural for the Period 2022-2032F
- Historical Data and Forecast of Poland Lacquer Market Revenues & Volume By Furniture for the Period 2022-2032F
- Historical Data and Forecast of Poland Lacquer Market Revenues & Volume By Cosmetics for the Period 2022-2032F
- Historical Data and Forecast of Poland Lacquer Market Revenues & Volume By Other End Users for the Period 2022-2032F
- Poland Lacquer Import Export Trade Statistics
- Market Opportunity Assessment By Product Type
- Market Opportunity Assessment By Formulation Type
- Market Opportunity Assessment By Application
- Market Opportunity Assessment By Distribution Channel
- Market Opportunity Assessment By End Use Industry
- Poland Lacquer Top Companies Market Share
- Poland Lacquer Competitive Benchmarking By Technical and Operational Parameters
- Poland Lacquer Company Profiles
- Poland Lacquer Key Strategic Recommendations
Poland Lacquer Market (2026-2032): FAQs
6Wresearch actively monitors the Poland Lacquer Market and publishes its comprehensive annual report, highlighting emerging trends, growth drivers, revenue analysis, and forecast outlook. Our insights help businesses to make data-backed strategic decisions with ongoing market dynamics. Our analysts track relevent industries related to the Poland Lacquer Market, allowing our clients with actionable intelligence and reliable forecasts tailored to emerging regional needs.
Yes, we provide customisation as per your requirements. To learn more, feel free to contact us on sales@6wresearch.com
1 Executive Summary |
2 Introduction |
2.1 Key Highlights of the Report |
2.2 Report Description |
2.3 Market Scope & Segmentation |
2.4 Research Methodology |
2.5 Assumptions |
3 Poland Lacquer Market Overview |
3.1 Poland Country Macro Economic Indicators |
3.2 Poland Lacquer Market Revenues & Volume, 2022 & 2032F |
3.3 Poland Lacquer Market - Industry Life Cycle |
3.4 Poland Lacquer Market - Porter's Five Forces |
3.5 Poland Lacquer Market Revenues & Volume Share, By Product Type, 2022 & 2032F |
3.6 Poland Lacquer Market Revenues & Volume Share, By Formulation Type, 2022 & 2032F |
3.7 Poland Lacquer Market Revenues & Volume Share, By Application, 2022 & 2032F |
3.8 Poland Lacquer Market Revenues & Volume Share, By Distribution Channel, 2022 & 2032F |
3.9 Poland Lacquer Market Revenues & Volume Share, By End Use Industry, 2022 & 2032F |
4 Poland Lacquer Market Dynamics |
4.1 Impact Analysis |
4.2 Market Drivers |
4.2.1 Growing construction industry in Poland leading to increased demand for lacquer products. |
4.2.2 Rising disposable income and improving living standards driving consumer spending on home improvement projects. |
4.2.3 Increasing adoption of eco-friendly and sustainable lacquer products due to growing environmental awareness. |
4.3 Market Restraints |
4.3.1 Fluctuating raw material prices impacting production costs and pricing of lacquer products. |
4.3.2 Intense competition from domestic and international lacquer manufacturers affecting market share and pricing strategies. |
5 Poland Lacquer Market Trends |
6 Poland Lacquer Market, By Types |
6.1 Poland Lacquer Market, By Product Type |
6.1.1 Overview and Analysis |
6.1.2 Poland Lacquer Market Revenues & Volume, By Product Type, 2022-2032F |
6.1.3 Poland Lacquer Market Revenues & Volume, By Nitrocellulose Lacquers, 2022-2032F |
6.1.4 Poland Lacquer Market Revenues & Volume, By Pre-Catalyzed Lacquers, 2022-2032F |
6.1.5 Poland Lacquer Market Revenues & Volume, By Acid Catalyzed Lacquer, 2022-2032F |
6.1.6 Poland Lacquer Market Revenues & Volume, By Polyurethane Lacquers, 2022-2032F |
6.1.7 Poland Lacquer Market Revenues & Volume, By Radiation Curing-Lacquers, 2022-2032F |
6.1.8 Poland Lacquer Market Revenues & Volume, By Unsaturated Polyester Lacquers, 2022-2032F |
6.2 Poland Lacquer Market, By Formulation Type |
6.2.1 Overview and Analysis |
6.2.2 Poland Lacquer Market Revenues & Volume, By Solvent Based, 2022-2032F |
6.2.3 Poland Lacquer Market Revenues & Volume, By Water Based, 2022-2032F |
6.3 Poland Lacquer Market, By Application |
6.3.1 Overview and Analysis |
6.3.2 Poland Lacquer Market Revenues & Volume, By Wood, 2022-2032F |
6.3.3 Poland Lacquer Market Revenues & Volume, By Metal, 2022-2032F |
6.3.4 Poland Lacquer Market Revenues & Volume, By Plastics, 2022-2032F |
6.3.5 Poland Lacquer Market Revenues & Volume, By Leather and Textiles, 2022-2032F |
6.3.6 Poland Lacquer Market Revenues & Volume, By Others, 2022-2032F |
6.4 Poland Lacquer Market, By Distribution Channel |
6.4.1 Overview and Analysis |
6.4.2 Poland Lacquer Market Revenues & Volume, By Modern Trade, 2022-2032F |
6.4.3 Poland Lacquer Market Revenues & Volume, By Departmental Store, 2022-2032F |
6.4.4 Poland Lacquer Market Revenues & Volume, By Online Retailers, 2022-2032F |
6.4.5 Poland Lacquer Market Revenues & Volume, By Specialty Stores, 2022-2032F |
6.4.6 Poland Lacquer Market Revenues & Volume, By Direct Sales, 2022-2032F |
6.4.7 Poland Lacquer Market Revenues & Volume, By Other Sales Channel, 2022-2032F |
6.5 Poland Lacquer Market, By End Use Industry |
6.5.1 Overview and Analysis |
6.5.2 Poland Lacquer Market Revenues & Volume, By Automotive, 2022-2032F |
6.5.3 Poland Lacquer Market Revenues & Volume, By Architectural, 2022-2032F |
6.5.4 Poland Lacquer Market Revenues & Volume, By Furniture, 2022-2032F |
6.5.5 Poland Lacquer Market Revenues & Volume, By Cosmetics, 2022-2032F |
6.5.6 Poland Lacquer Market Revenues & Volume, By Other End Users, 2022-2032F |
7 Poland Lacquer Market Import-Export Trade Statistics |
7.1 Poland Lacquer Market Export to Major Countries |
7.2 Poland Lacquer Market Imports from Major Countries |
8 Poland Lacquer Market Key Performance Indicators |
8.1 Number of new construction projects in Poland using lacquer products. |
8.2 Percentage of consumers opting for premium or eco-friendly lacquer products. |
8.3 Innovation rate in lacquer product development. |
8.4 Customer satisfaction and retention rate for lacquer products. |
8.5 Environmental impact assessment and sustainability certifications for lacquer products. |
9 Poland Lacquer Market - Opportunity Assessment |
9.1 Poland Lacquer Market Opportunity Assessment, By Product Type, 2022 & 2032F |
9.2 Poland Lacquer Market Opportunity Assessment, By Formulation Type, 2022 & 2032F |
9.3 Poland Lacquer Market Opportunity Assessment, By Application, 2022 & 2032F |
9.4 Poland Lacquer Market Opportunity Assessment, By Distribution Channel, 2022 & 2032F |
9.5 Poland Lacquer Market Opportunity Assessment, By End Use Industry, 2022 & 2032F |
10 Poland Lacquer Market - Competitive Landscape |
10.1 Poland Lacquer Market Revenue Share, By Companies, 2025 |
10.2 Poland Lacquer Market Competitive Benchmarking, By Operating and Technical Parameters |
11 Company Profiles |
12 Recommendations |
13 Disclaimer |
Global Go To Market Strategy - 2030
Export potential enables firms to identify high-growth global markets with greater confidence by combining advanced trade intelligence with a structured quantitative methodology. The framework analyzes emerging demand trends and country-level import patterns while integrating macroeconomic and trade datasets such as GDP and population forecasts, bilateral import–export flows, tariff structures, elasticity differentials between developed and developing economies, geographic distance, and import demand projections. Using weighted trade values from 2020–2024 as the base period to project country-to-country export potential for 2030, these inputs are operationalized through calculated drivers such as gravity model parameters, tariff impact factors, and projected GDP per-capita growth. Through an analysis of hidden potentials, demand hotspots, and market conditions that are most favorable to success, this method enables firms to focus on target countries, maximize returns, and global expansion with data, backed by accuracy.
By factoring in the projected importer demand gap that is currently unmet and could be potential opportunity, it identifies the potential for the Exporter (Country) among 190 countries, against the general trade analysis, which identifies the biggest importer or exporter.
To discover high-growth global markets and optimize your business strategy:
Click Here
Pricing
- Single User License$ 1,995
- Department License$ 2,400
- Site License$ 3,120
- Global License$ 3,795

Leadership Perspectives from Industry Events
Search
Thought Leadership and Analyst Meet


Our Clients
6WResearch In News
- India Air Conditioner Market Set for Strong Rebound in 2026 After Weather-Led Correction and GST-Driven Recovery: 6Wresearch
- ADAS in India: How Automatic Emergency Braking, Blind Spot Detection & Driver Monitoring are Transforming Road Safety
- Doha a strategic location for EV manufacturing hub: IPA Qatar
- Demand for luxury TVs surging in the GCC, says Samsung
- Empowering Growth: The Thriving Journey of Bangladesh’s Cable Industry
- Demand for luxury TVs surging in the GCC, says Samsung
Latest Reports
- Poland Fire Protection Systems Market (2026-2032)
- Cape Verde Portable Hand-Thrown Extinguisher Market (2026-2032)
- Canada Portable Hand-Thrown Extinguisher Market (2026-2032)
- Cameroon Portable Hand-Thrown Extinguisher Market (2026-2032)
- Burundi Portable Hand-Thrown Extinguisher Market (2026-2032)
- Burkina Faso Portable Hand-Thrown Extinguisher Market (2026-2032)
- Bulgaria Portable Hand-Thrown Extinguisher Market (2026-2032)
- Brunei Portable Hand-Thrown Extinguisher Market (2026-2032)
- Botswana Portable Hand-Thrown Extinguisher Market (2026-2032)
- Bosnia and Herzegovina Portable Hand-Thrown Extinguisher Market (2026-2032)
Industry Events and Analyst Meet

HIMTEX 2026

India Refining Summit 2026

India EV Show 2026

EV tech India Expo 2026

Auto Tech Asia 2026
Whitepaper
- Middle East & Africa Commercial Security Market Click here to view more.
- Middle East & Africa Fire Safety Systems & Equipment Market Click here to view more.
- GCC Drone Market Click here to view more.
- Middle East Lighting Fixture Market Click here to view more.
- GCC Physical & Perimeter Security Market Click here to view more.