Portugal Ferro Manganese Market (2026-2032) | Competitive, Trends, Competition, Size, Segmentation, Supply, Consumer Insights, Value, Demand, Industry, Drivers, Pricing Analysis, Investment Trends, Growth, Opportunities, Outlook, Revenue, Segments, Restraints, Forecast, Challenges, Strategy, Analysis, Strategic Insights, Companies, Share
Market Forecast By Type (High, Medium, Low, Refined), By Application (Steel Manufacturing, Welding Electrodes, Foundry Industry, Chemical Industry), By End User (Automotive, Construction, Aerospace, Electronics) And Competitive Landscape
| Product Code: ETC12081430 | Publication Date: Apr 2025 | Updated Date: Apr 2026 | Product Type: Market Research Report | |
| Publisher: 6Wresearch | Author: Sachin Kumar Rai | No. of Pages: 65 | No. of Figures: 34 | No. of Tables: 19 |
Portugal Ferro Manganese Market Size (2020-2030)
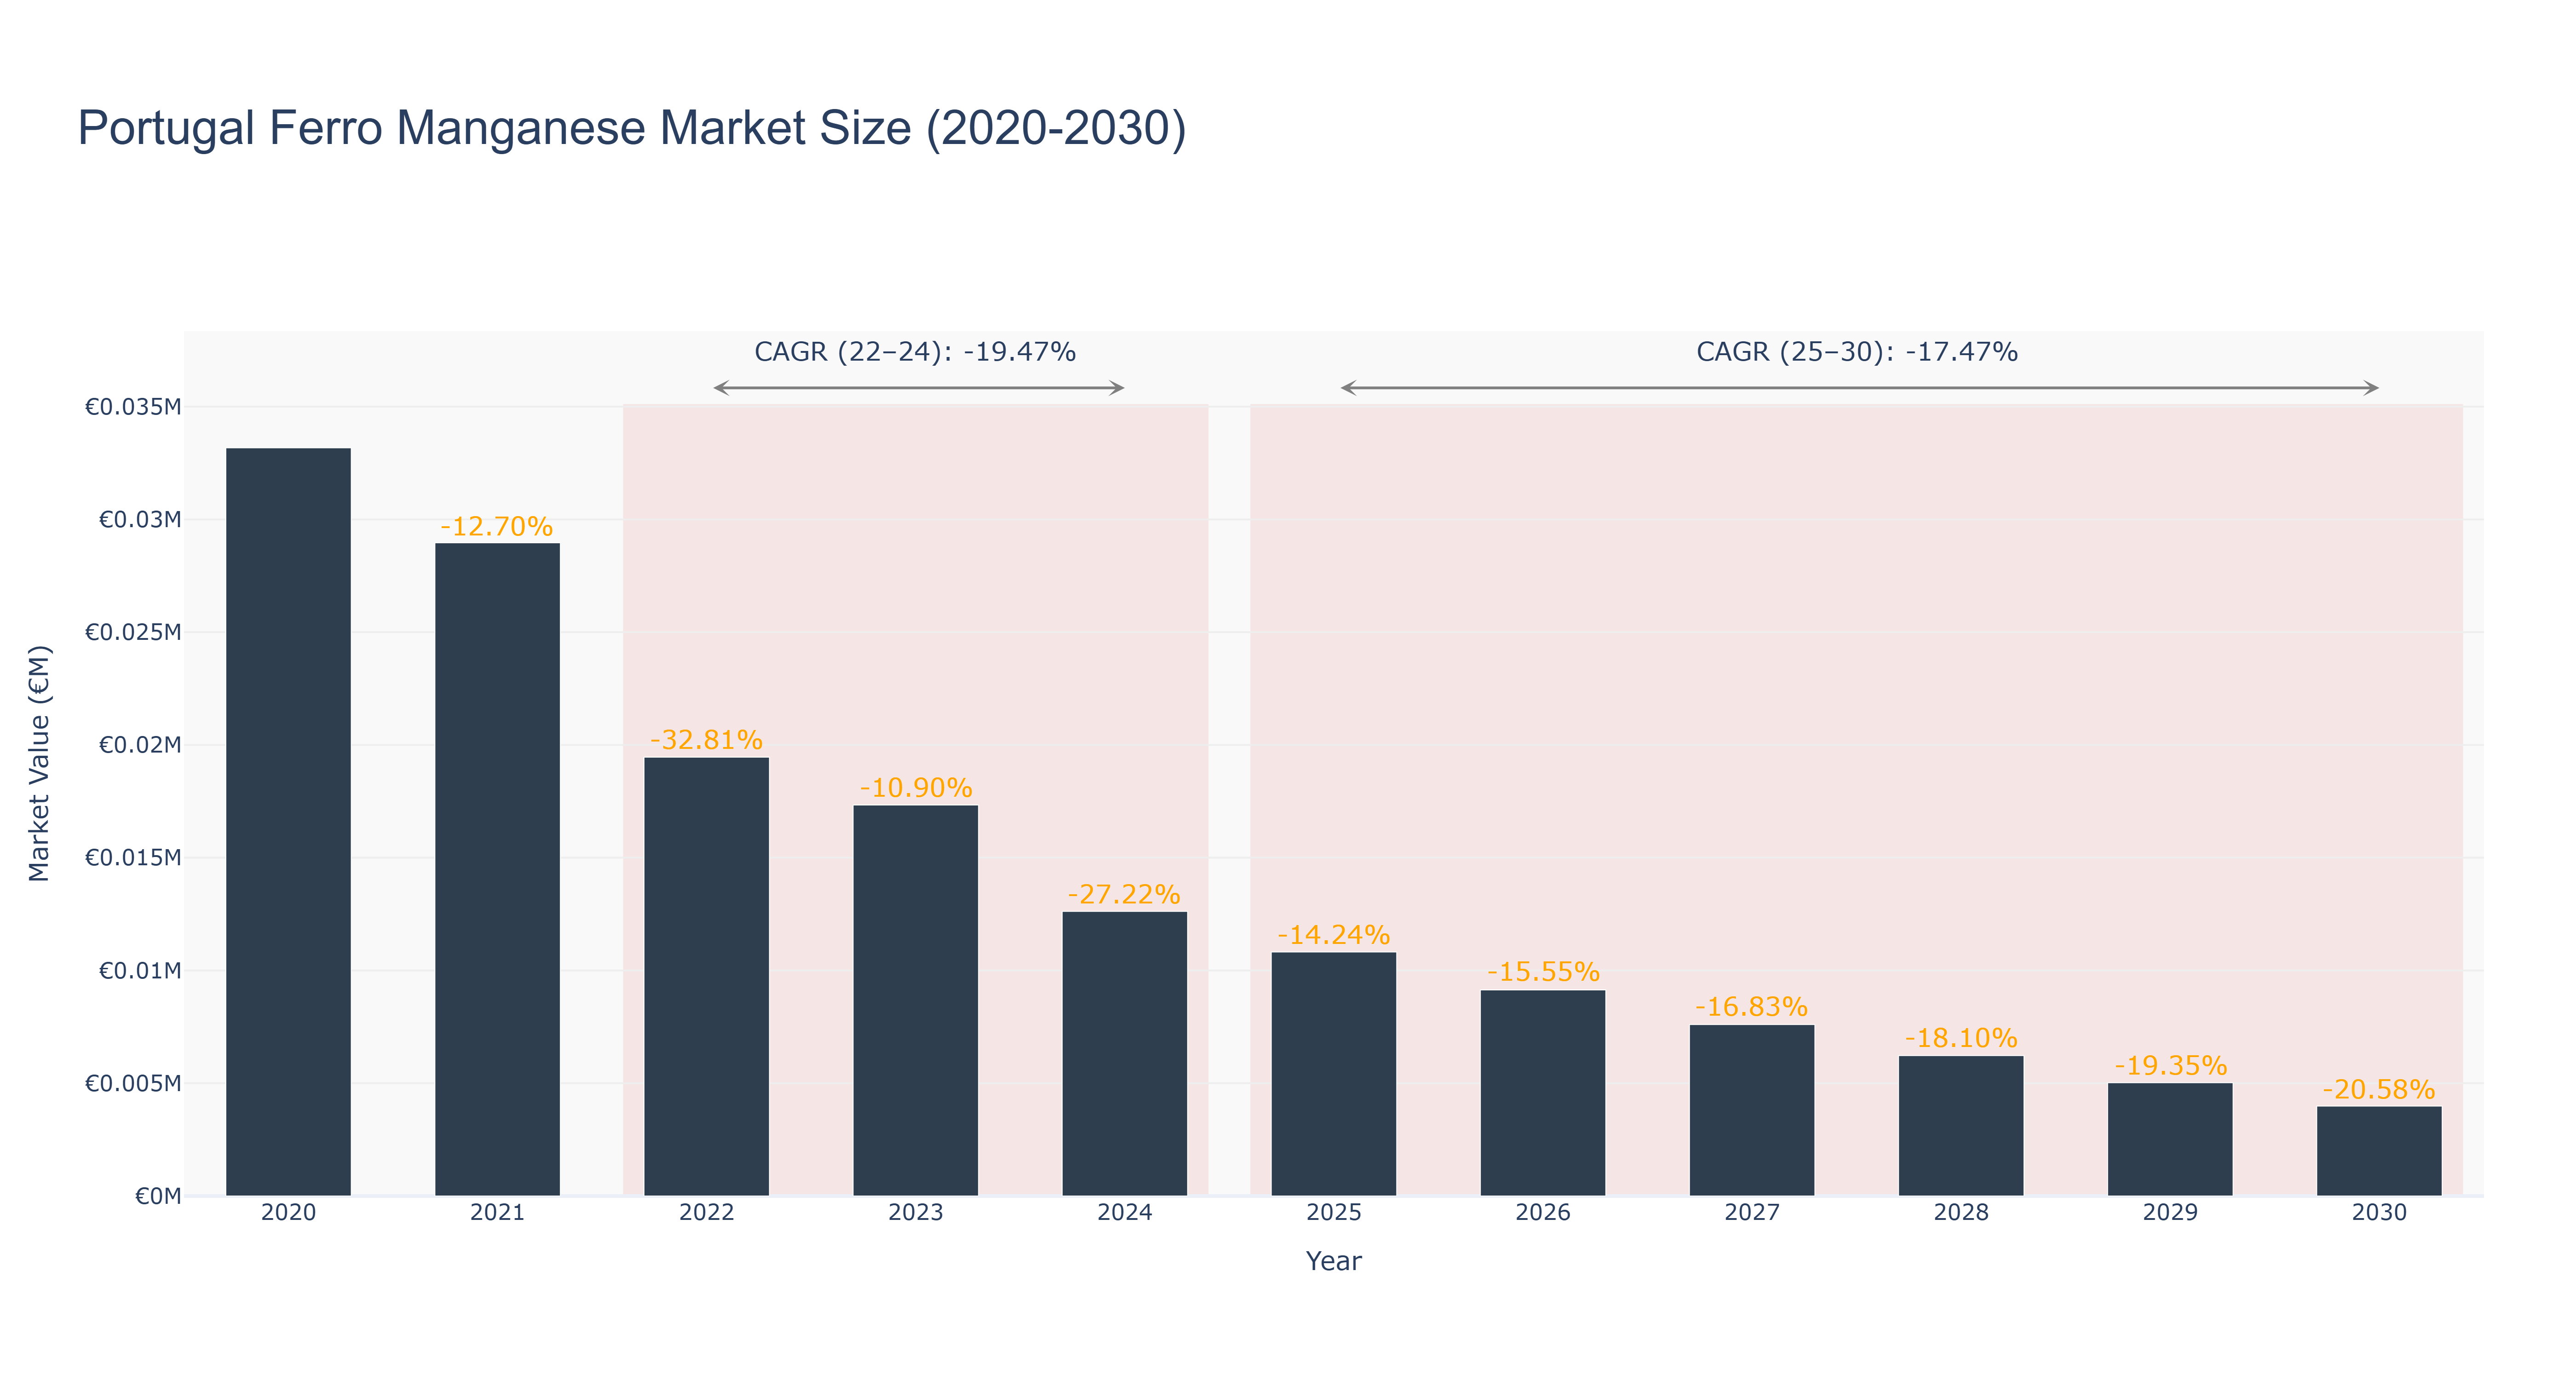
The Portugal Ferro Manganese Market is experiencing a significant downward trajectory, characterized by a sharp decline in market size from its peak of €33.18 thousand in 2020 to €12.62 thousand in 2024, reflecting a CAGR of -19.47% during the actual period from 2022 to 2024. The market has faced persistent challenges, including reduced demand from key industries and increased competition from alternative materials, leading to a dramatic decrease in size from €19.46 thousand in 2022 to €17.34 thousand in 2023. Looking ahead to the forecasted period from 2025 to 2030, the market is expected to continue its contraction, with projected sizes declining from €10.82 thousand in 2025 to €3.99 thousand in 2030, at a CAGR of -17.47%. The ongoing shift towards sustainable practices and the potential for increased recycling initiatives may provide some stabilization, but overall, the market remains vulnerable to broader economic fluctuations and industry consolidation.
Portugal Ferro Manganese Market: Production & Trade Performance (2019-2025)
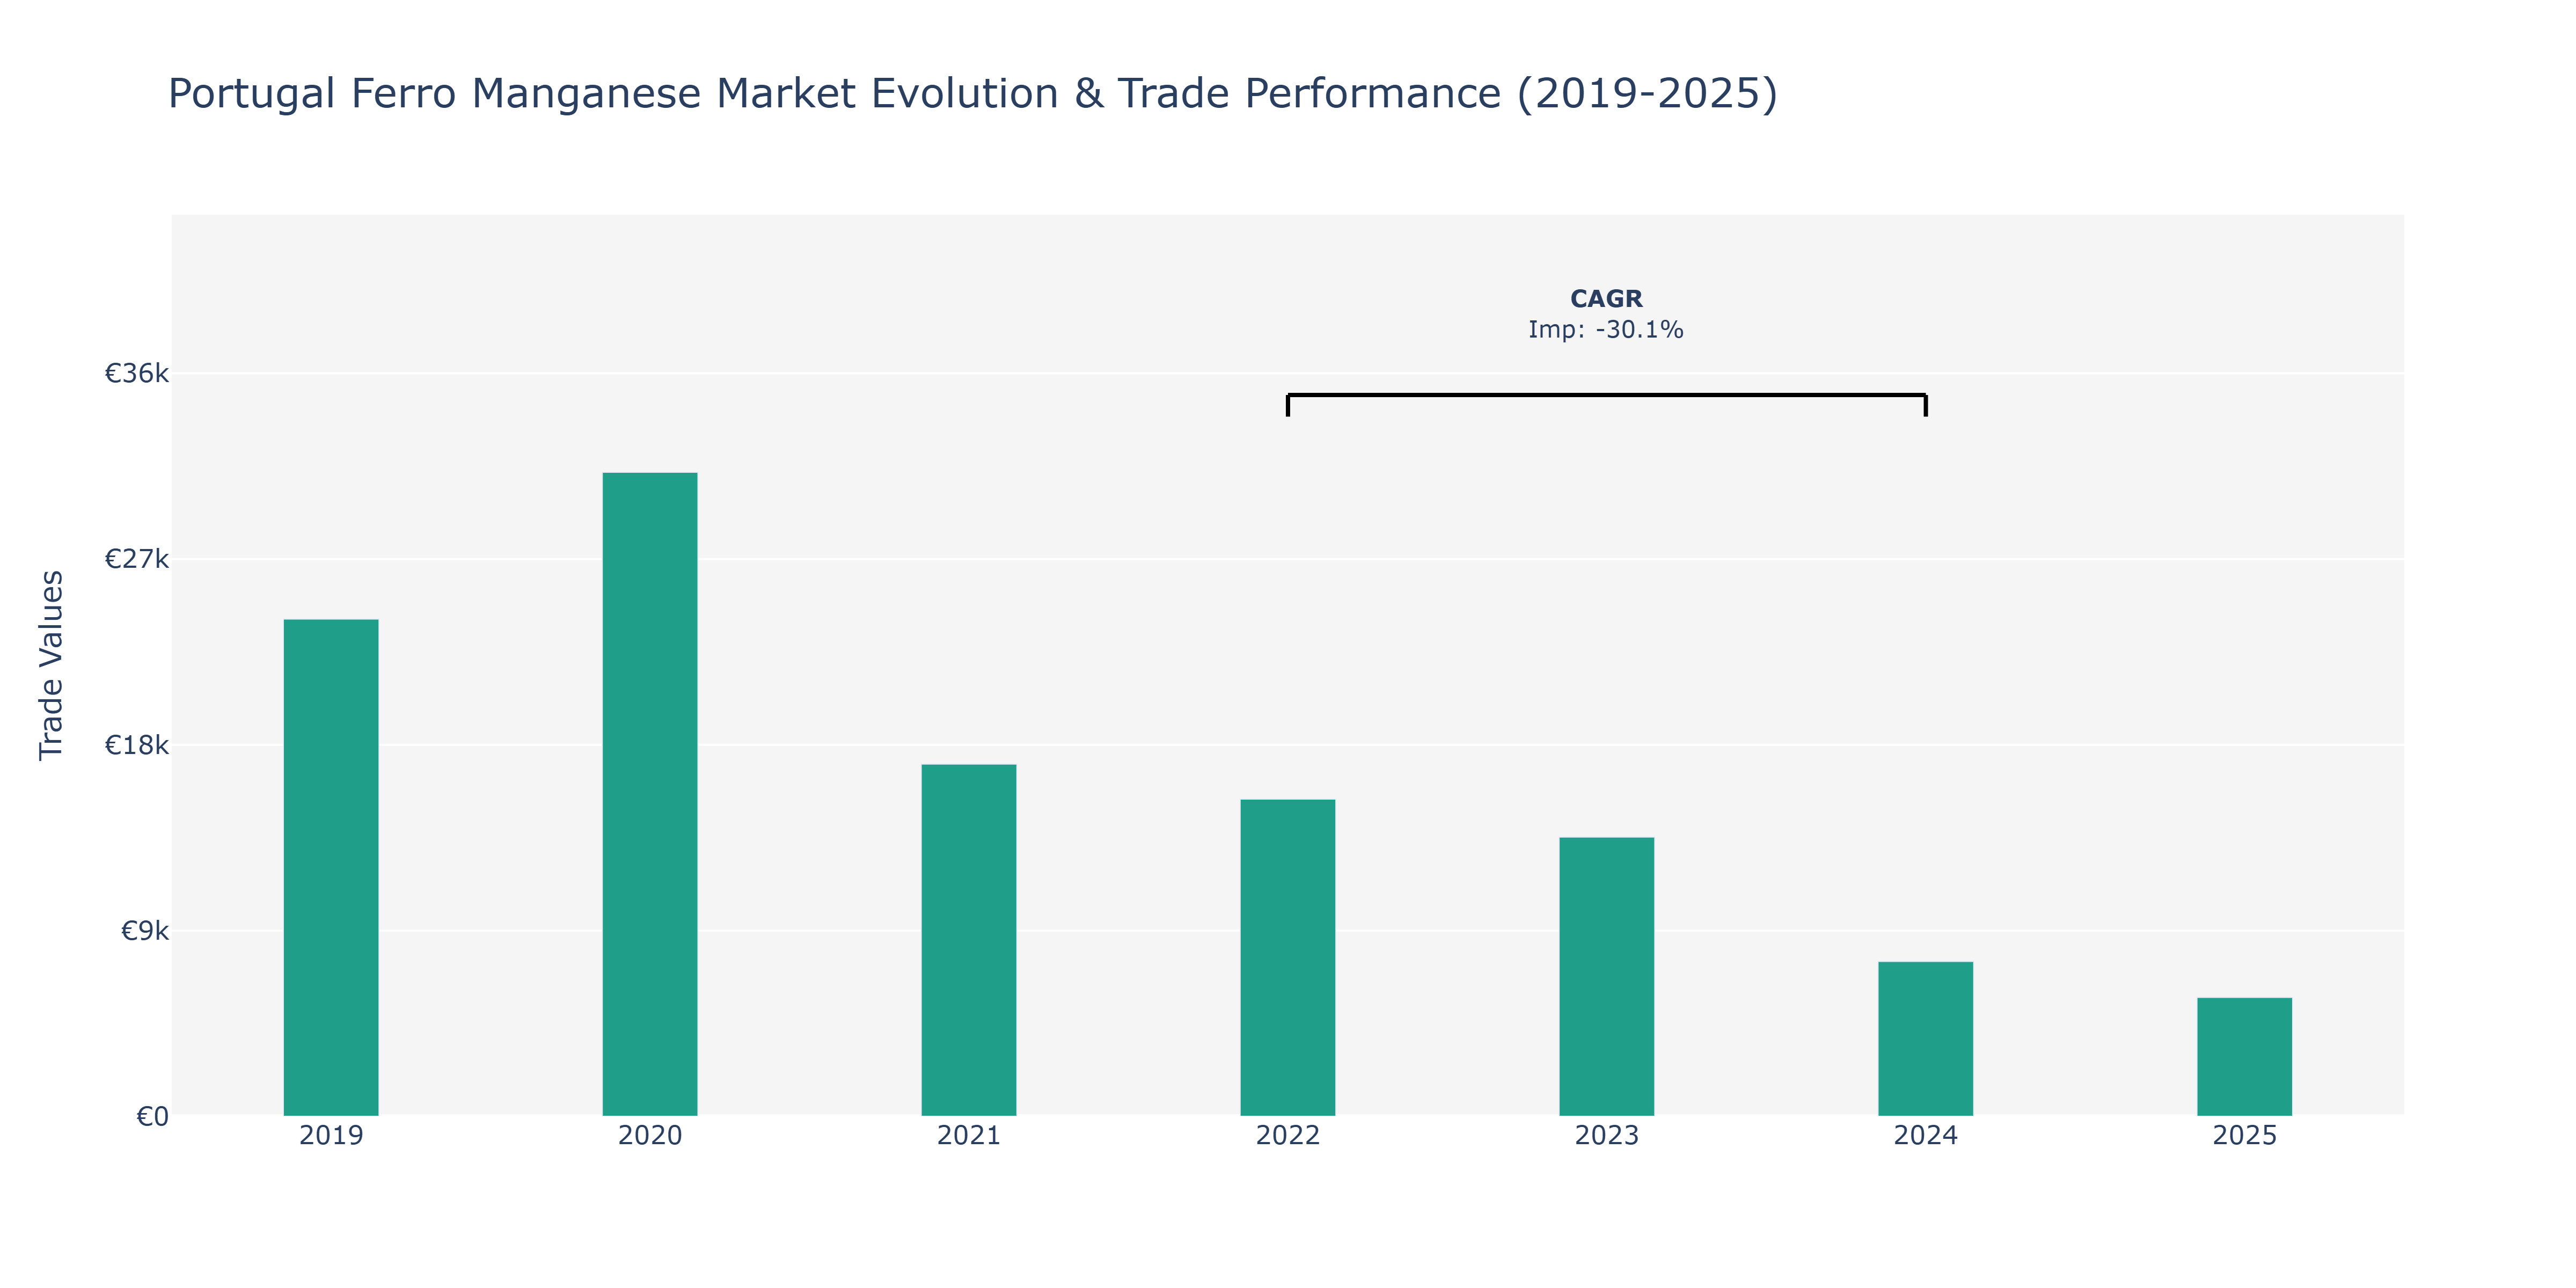
Between 2019 and 2025, Portugal's Ferro Manganese Market experienced fluctuations in imports. Starting at €24.09 thousand in 2019, imports surged to €31.2 thousand in 2020, indicating a noticeable increase. However, the trend reversed in the following years, with imports dropping to €17.07 thousand in 2021 and further declining to €7.5 thousand in 2024. The most significant drop occurred in the period 2022–2023, with imports plummeting from €15.36 thousand to €13.53 thousand. This decline could be attributed to various factors such as changes in global demand for ferro manganese products, shifts in pricing due to market dynamics, or fluctuations in the availability of raw materials. The decreasing trend in imports suggests a changing landscape in the market, possibly influenced by evolving trade policies, competitive pressures, or technological advancements impacting the demand for ferro manganese in Portugal.
Key Highlights of the Report:
- Portugal Ferro Manganese Market Outlook
- Market Size of Portugal Ferro Manganese Market, 2025
- Forecast of Portugal Ferro Manganese Market, 2032
- Historical Data and Forecast of Portugal Ferro Manganese Revenues & Volume for the Period 2022 - 2032F
- Portugal Ferro Manganese Market Trend Evolution
- Portugal Ferro Manganese Market Drivers and Challenges
- Portugal Ferro Manganese Price Trends
- Portugal Ferro Manganese Porter's Five Forces
- Portugal Ferro Manganese Industry Life Cycle
- Historical Data and Forecast of Portugal Ferro Manganese Market Revenues & Volume By Type for the Period 2022 - 2032F
- Historical Data and Forecast of Portugal Ferro Manganese Market Revenues & Volume By High for the Period 2022 - 2032F
- Historical Data and Forecast of Portugal Ferro Manganese Market Revenues & Volume By Medium for the Period 2022 - 2032F
- Historical Data and Forecast of Portugal Ferro Manganese Market Revenues & Volume By Low for the Period 2022 - 2032F
- Historical Data and Forecast of Portugal Ferro Manganese Market Revenues & Volume By Refined for the Period 2022 - 2032F
- Historical Data and Forecast of Portugal Ferro Manganese Market Revenues & Volume By Application for the Period 2022 - 2032F
- Historical Data and Forecast of Portugal Ferro Manganese Market Revenues & Volume By Steel Manufacturing for the Period 2022 - 2032F
- Historical Data and Forecast of Portugal Ferro Manganese Market Revenues & Volume By Welding Electrodes for the Period 2022 - 2032F
- Historical Data and Forecast of Portugal Ferro Manganese Market Revenues & Volume By Foundry Industry for the Period 2022 - 2032F
- Historical Data and Forecast of Portugal Ferro Manganese Market Revenues & Volume By Chemical Industry for the Period 2022 - 2032F
- Historical Data and Forecast of Portugal Ferro Manganese Market Revenues & Volume By End User for the Period 2022 - 2032F
- Historical Data and Forecast of Portugal Ferro Manganese Market Revenues & Volume By Automotive for the Period 2022 - 2032F
- Historical Data and Forecast of Portugal Ferro Manganese Market Revenues & Volume By Construction for the Period 2022 - 2032F
- Historical Data and Forecast of Portugal Ferro Manganese Market Revenues & Volume By Aerospace for the Period 2022 - 2032F
- Historical Data and Forecast of Portugal Ferro Manganese Market Revenues & Volume By Electronics for the Period 2022 - 2032F
- Portugal Ferro Manganese Import Export Trade Statistics
- Market Opportunity Assessment By Type
- Market Opportunity Assessment By Application
- Market Opportunity Assessment By End User
- Portugal Ferro Manganese Top Companies Market Share
- Portugal Ferro Manganese Competitive Benchmarking By Technical and Operational Parameters
- Portugal Ferro Manganese Company Profiles
- Portugal Ferro Manganese Key Strategic Recommendations
Frequently Asked Questions About the Market Study (FAQs):
6Wresearch actively monitors the Portugal Ferro Manganese Market and publishes its comprehensive annual report, highlighting emerging trends, growth drivers, revenue analysis, and forecast outlook. Our insights help businesses to make data-backed strategic decisions with ongoing market dynamics. Our analysts track relevent industries related to the Portugal Ferro Manganese Market, allowing our clients with actionable intelligence and reliable forecasts tailored to emerging regional needs.
Yes, we provide customisation as per your requirements. To learn more, feel free to contact us on sales@6wresearch.com
1 Executive Summary |
2 Introduction |
2.1 Key Highlights of the Report |
2.2 Report Description |
2.3 Market Scope & Segmentation |
2.4 Research Methodology |
2.5 Assumptions |
3 Portugal Ferro Manganese Market Overview |
3.1 Portugal Country Macro Economic Indicators |
3.2 Portugal Ferro Manganese Market Revenues & Volume, 2022 & 2032F |
3.3 Portugal Ferro Manganese Market - Industry Life Cycle |
3.4 Portugal Ferro Manganese Market - Porter's Five Forces |
3.5 Portugal Ferro Manganese Market Revenues & Volume Share, By Type, 2022 & 2032F |
3.6 Portugal Ferro Manganese Market Revenues & Volume Share, By Application, 2022 & 2032F |
3.7 Portugal Ferro Manganese Market Revenues & Volume Share, By End User, 2022 & 2032F |
4 Portugal Ferro Manganese Market Dynamics |
4.1 Impact Analysis |
4.2 Market Drivers |
4.2.1 Growing demand for steel production in Portugal |
4.2.2 Increasing investments in infrastructure projects |
4.2.3 Favorable government policies supporting the ferro manganese industry |
4.3 Market Restraints |
4.3.1 Volatility in raw material prices |
4.3.2 Environmental regulations impacting production processes |
4.3.3 Competition from alternative materials in steel production |
5 Portugal Ferro Manganese Market Trends |
6 Portugal Ferro Manganese Market, By Types |
6.1 Portugal Ferro Manganese Market, By Type |
6.1.1 Overview and Analysis |
6.1.2 Portugal Ferro Manganese Market Revenues & Volume, By Type, 2022 - 2032F |
6.1.3 Portugal Ferro Manganese Market Revenues & Volume, By High, 2022 - 2032F |
6.1.4 Portugal Ferro Manganese Market Revenues & Volume, By Medium, 2022 - 2032F |
6.1.5 Portugal Ferro Manganese Market Revenues & Volume, By Low, 2022 - 2032F |
6.1.6 Portugal Ferro Manganese Market Revenues & Volume, By Refined, 2022 - 2032F |
6.2 Portugal Ferro Manganese Market, By Application |
6.2.1 Overview and Analysis |
6.2.2 Portugal Ferro Manganese Market Revenues & Volume, By Steel Manufacturing, 2022 - 2032F |
6.2.3 Portugal Ferro Manganese Market Revenues & Volume, By Welding Electrodes, 2022 - 2032F |
6.2.4 Portugal Ferro Manganese Market Revenues & Volume, By Foundry Industry, 2022 - 2032F |
6.2.5 Portugal Ferro Manganese Market Revenues & Volume, By Chemical Industry, 2022 - 2032F |
6.3 Portugal Ferro Manganese Market, By End User |
6.3.1 Overview and Analysis |
6.3.2 Portugal Ferro Manganese Market Revenues & Volume, By Automotive, 2022 - 2032F |
6.3.3 Portugal Ferro Manganese Market Revenues & Volume, By Construction, 2022 - 2032F |
6.3.4 Portugal Ferro Manganese Market Revenues & Volume, By Aerospace, 2022 - 2032F |
6.3.5 Portugal Ferro Manganese Market Revenues & Volume, By Electronics, 2022 - 2032F |
7 Portugal Ferro Manganese Market Import-Export Trade Statistics |
7.1 Portugal Ferro Manganese Market Export to Major Countries |
7.2 Portugal Ferro Manganese Market Imports from Major Countries |
8 Portugal Ferro Manganese Market Key Performance Indicators |
8.1 Average selling price of ferro manganese |
8.2 Capacity utilization rate of ferro manganese plants |
8.3 Percentage of steel production using ferro manganese input |
9 Portugal Ferro Manganese Market - Opportunity Assessment |
9.1 Portugal Ferro Manganese Market Opportunity Assessment, By Type, 2022 & 2032F |
9.2 Portugal Ferro Manganese Market Opportunity Assessment, By Application, 2022 & 2032F |
9.3 Portugal Ferro Manganese Market Opportunity Assessment, By End User, 2022 & 2032F |
10 Portugal Ferro Manganese Market - Competitive Landscape |
10.1 Portugal Ferro Manganese Market Revenue Share, By Companies, 2025 |
10.2 Portugal Ferro Manganese Market Competitive Benchmarking, By Operating and Technical Parameters |
11 Company Profiles |
12 Recommendations |
13 Disclaimer |
Export potential assessment - trade Analytics for 2030
Export potential enables firms to identify high-growth global markets with greater confidence by combining advanced trade intelligence with a structured quantitative methodology. The framework analyzes emerging demand trends and country-level import patterns while integrating macroeconomic and trade datasets such as GDP and population forecasts, bilateral import–export flows, tariff structures, elasticity differentials between developed and developing economies, geographic distance, and import demand projections. Using weighted trade values from 2020–2024 as the base period to project country-to-country export potential for 2030, these inputs are operationalized through calculated drivers such as gravity model parameters, tariff impact factors, and projected GDP per-capita growth. Through an analysis of hidden potentials, demand hotspots, and market conditions that are most favorable to success, this method enables firms to focus on target countries, maximize returns, and global expansion with data, backed by accuracy.
By factoring in the projected importer demand gap that is currently unmet and could be potential opportunity, it identifies the potential for the Exporter (Country) among 190 countries, against the general trade analysis, which identifies the biggest importer or exporter.
To discover high-growth global markets and optimize your business strategy:
Click Here
Pricing
- Single User License$ 1,995
- Department License$ 2,400
- Site License$ 3,120
- Global License$ 3,795

Search
Thought Leadership and Analyst Meet


Our Clients
Latest Reports
- China Electric Appliance Rental Market (2026-2032) | Trends, Revenue, Growth, Challenges, Size, Value, Outlook, Pricing, Strategy, Insights, Restraints, segmentation, Companies, Investment Opportunities, Analysis, Demand, Drivers, Competition, Forecast, Share
- Chile Electric Appliance Rental Market (2026-2032) | Outlook, Competition, Drivers, Strategy, Revenue, Analysis, Value, Pricing, Restraints, Size, Demand, Share, Growth, Forecast, Challenges, Insights, Investment Opportunities, Companies, Trends, segmentation
- Cambodia Electric Appliance Rental Market (2026-2032) | Companies, Analysis, Restraints, Pricing, Insights, Challenges, Outlook, Strategy, Forecast, Trends, Competition, Value, Revenue, Investment Opportunities, segmentation, Drivers, Size, Demand, Growth, Share
- Brazil Electric Appliance Rental Market (2026-2032) | Revenue, Strategy, Forecast, Companies, segmentation, Competition, Size, Investment Opportunities, Pricing, Restraints, Outlook, Challenges, Analysis, Drivers, Value, Demand, Insights, Trends, Growth, Share
- Bangladesh Electric Appliance Rental Market (2026-2032) | Drivers, Forecast, Investment Opportunities, Strategy, Insights, Demand, Challenges, Outlook, Trends, Competition, Value, Revenue, Size, Pricing, Analysis, Companies, Restraints, segmentation, Share, Growth
- Bahrain Electric Appliance Rental Market (2026-2032) | Outlook, Size, Competition, Restraints, Drivers, Value, Trends, Investment Opportunities, Insights, Forecast, Revenue, Strategy, Growth, Share, Demand, Analysis, Challenges, Companies, segmentation, Pricing
- Azerbaijan Electric Appliance Rental Market (2026-2032) | Trends, Investment Opportunities, Restraints, Insights, Strategy, Competition, Value, Growth, Demand, Drivers, Analysis, Forecast, Size, Share, Outlook, segmentation, Pricing, Challenges, Revenue, Companies
- Australia Electric Appliance Rental Market (2026-2032) | Challenges, Restraints, Forecast, Demand, Size, Competition, Pricing, Investment Opportunities, Revenue, Trends, Drivers, Growth, Outlook, Analysis, Strategy, Value, segmentation, Insights, Companies, Share
- Argentina Electric Appliance Rental Market (2026-2032) | Growth, Trends, Insights, Outlook, Forecast, Size, Drivers, Analysis, Restraints, Challenges, Share, Revenue, Investment Opportunities, Strategy, Demand, Value, Companies, segmentation, Competition, Pricing
- Algeria Electric Appliance Rental Market (2026-2032) | Share, Size, Value, Strategy, Competition, Outlook, Challenges, Companies, Trends, Pricing, Insights, Forecast, Investment Opportunities, Revenue, Growth, Restraints, segmentation, Analysis, Demand, Drivers
Industry Events and Analyst Meet

HIMTEX 2026

India Refining Summit 2026

India EV Show 2026

EV tech India Expo 2026

Auto Tech Asia 2026
Whitepaper
- Middle East & Africa Commercial Security Market Click here to view more.
- Middle East & Africa Fire Safety Systems & Equipment Market Click here to view more.
- GCC Drone Market Click here to view more.
- Middle East Lighting Fixture Market Click here to view more.
- GCC Physical & Perimeter Security Market Click here to view more.
6WResearch In News
- Doha a strategic location for EV manufacturing hub: IPA Qatar
- Demand for luxury TVs surging in the GCC, says Samsung
- Empowering Growth: The Thriving Journey of Bangladesh’s Cable Industry
- Demand for luxury TVs surging in the GCC, says Samsung
- Video call with a traditional healer? Once unthinkable, it’s now common in South Africa
- Intelligent Buildings To Smooth GCC’s Path To Net Zero