Qatar Grid-Scale Battery Market (2023-2029) | Growth, Size, Forecast, Analysis, COVID-19 IMPACT, Companies, Share, Industry, Trends, Revenue & Value
Market Forecast By Type (Lithium-Ion, Lead Acid, Flow Battery, Sodium-Based), By Ownership-Model (Third-Party, Utility), By Application (Renewable Integration, Peak Shift, Ancillary Services, Back-Up Power) And Competitive Landscape
| Product Code: ETC4521642 | Publication Date: Jul 2023 | Updated Date: Aug 2025 | Product Type: Report | |
| Publisher: 6Wresearch | Author: Ravi Bhandari | No. of Pages: 85 | No. of Figures: 45 | No. of Tables: 25 |
Qatar Grid-Scale Battery Market Synopsis
The emergence of Qatar Grid Scale Battery market commenced with the inauguration of its initial grid-scale battery project in 2020, boasting a capacity of 1MW / 4MWh. Kahramaa, which played a pivotal role in introducing this technology, envisions its potential scalability for high-load substations within the country's electrical grid. Although there is progress, the pace of anticipated grid-scale battery installations remains relatively slow, demanding more concerted efforts. In 2022 and 2023, microgrids were implemented in Doha and at QEERI's desert farm, providing a modest boost to the market. Presently, extensive testing is underway to assess the efficacy of grid-scale batteries in withstanding Qatar's hot climate and to determine their suitability for integration into large-scale renewable energy projects.
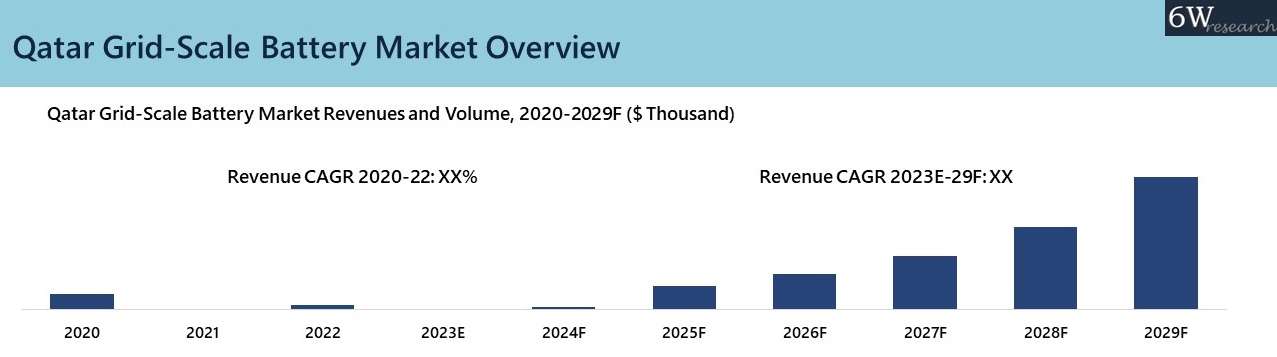
According to 6Wresearch, the Qatar Grid-Scale Battery Market revenue size is projected to grow at a CAGR of 182.8% during 2023–2029. This growth is primarily attributed to growing renewable energy projects such as 800MW Al Kharsaah solar PV project near Qatar's capital, Doha, and the inauguration of Qatar's first major solar energy facility, Al Kharsaah, comprising over 1.8 million solar panels with an estimated annual electricity generation capacity of approximately 2 terawatt-hours (TWh) which would require battery energy storage solutions to stabilize the grid during peak demand while ensuring backup power availability in the event of blackouts. Qatar is also exploring waste-to-energy solutions to diversify its energy portfolio which would further propel the adoption of grid-scale batteries across the region. These factors have been contributing to Qatar Grid-Scale Battery Market Growth.
Market by Type
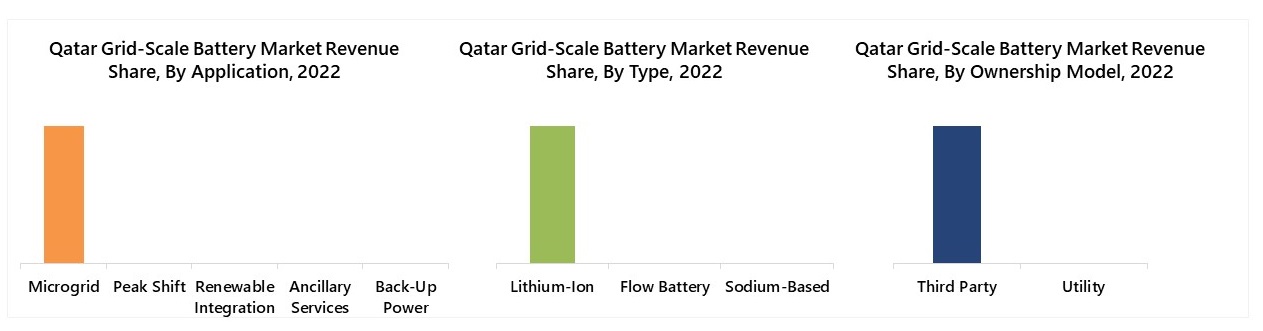
In 2022, Lithium-Ion batteries occupied the largest revenue share due to advancements in technology and increased manufacturing capabilities which resulted in a reduction in their prices. Additionally, their high energy density has made them the preferred option for grid-scale batteries. Lithium-ion batteries are dominating the Grid-Scale Battery Market in Qatar.
Market by Ownership Model
Utility companies in Qatar are poised to dominate the market as battery storage for renewable energy gains traction, optimizing peak-hour electricity distribution and pricing regulation. Their expertise in grid management and favourable regulations position them as key players, driving their expansion in grid-scale battery deployment.
Market by Application
While peak shift is anticipated to gain more prominence in the future, in 2022, Microgrid will claim the highest revenue share. This was primarily due to Siemens' installation of a microgrid at Qatar Solar Energy's Doha factory and the need to replace small diesel generators powering rural communities.
Key Attractiveness of the Report
- COVID-19 Impact on the Market.
- 11 Years of Market Numbers.
- Historical Data Starting from 2019 to 2022.
- Base Year: 2022
- Forecast Data until 2029.
- Key Performance Indicators Impacting the Market.
- Major Upcoming Developments and Projects.
Key Highlights of the Report:
- Qatar Grid-Scale Battery Market Overview
- Qatar Grid-Scale Battery Market Outlook
- Qatar Grid-Scale Battery Market Forecast
- Historical Data and Forecast of Qatar Grid-Scale Battery Market Revenues, for the Period 2019-2029F
- Historical Data and Forecast of Qatar Grid-Scale Battery Market Revenues, By Type, for the Period 2019-2029F
- Historical Data and Forecast of Qatar Grid-Scale Battery Market Revenues, By Ownership Model, for the Period 2019-2029F
- Historical Data and Forecast of Qatar Grid-Scale Battery Market Revenues, By Application, for the Period 2019-2029F
- Market Opportunity Assessment By Type 2029F
- Market Opportunity Assessment By Ownership Model 2029F
- Market Opportunity Assessment By Application 2029F
- Market Drivers and Restraints
- Market Trends
- Competitive Benchmarking
- Key Strategic Recommendations
Market Scope and Segmentation
Thereportprovides a detailed analysis of the following market segments:
By Type
- Lithium-Ion
- Flow Battery
- Sodium-Based
By Ownership Model
- Third Party
- Utility
By Application
- Renewable Integration
- Peak Shift
- Microgrid
- Ancillary Services
- Back-Up Power
Frequently Asked Questions About the Market Study (FAQs):
The Qatar Grid-Scale Battery Market revenue size is projected to grow at a CAGR of 182.8% during 2023–2029.
The growth of this market is primarily attributed to growing renewable energy projects such as 800MW Al Kharsaah solar PV project near Qatar's capital, Doha, and the inauguration of Qatar's first major solar energy facility, Al Kharsaah.
Qatar's extreme climate, marked by high temperatures and humidity, poses challenges for grid-scale batteries, particularly lithium-ion types which are sensitive to heat, potentially requiring advanced thermal management and alternative technologies to enhance performance and resilience.
Segments that are covered in this market report are by type, ownership model, and application.
6Wresearch actively monitors the Qatar Grid-Scale Battery Market and publishes its comprehensive annual report, highlighting emerging trends, growth drivers, revenue analysis, and forecast outlook. Our insights help businesses to make data-backed strategic decisions with ongoing market dynamics. Our analysts track relevent industries related to the Qatar Grid-Scale Battery Market, allowing our clients with actionable intelligence and reliable forecasts tailored to emerging regional needs.
Yes, we provide customisation as per your requirements. To learn more, feel free to contact us on sales@6wresearch.com
| 1. Executive Summary |
| 2. Introduction |
| 2.1. Report Description |
| 2.2. Key Highlights of the Report |
| 2.3. Market Scope & Segmentation |
| 2.4. Research Methodology |
| 2.5. Assumptions |
| 3. Qatar Grid-Scale Battery Market Overview |
| 3.1. Qatar Grid-Scale Battery Market Revenues, 2023-2030F |
| 3.2. Qatar Grid-Scale Battery Market – Industry Life Cycle |
| 3.3. Qatar Grid-Scale Battery Market – Porter’s Five Forces |
| 4. Qatar Grid-Scale Battery Market Dynamics |
| 4.1. Impact Analysis |
| 4.2. Market Drivers |
| 4.2.1 Increasing demand for reliable and sustainable energy sources in Qatar |
| 4.2.2 Government initiatives and policies promoting the adoption of renewable energy technologies |
| 4.2.3 Growing investments in grid infrastructure development in the country |
| 4.3. Market Restraints |
| 4.3.1 High initial investment costs associated with grid-scale battery installation |
| 4.3.2 Limited technological advancements and local manufacturing capabilities in the battery market |
| 4.3.3 Challenges related to grid integration and regulatory frameworks for energy storage systems |
| 5. Qatar Grid-Scale Battery Market Trends & Evolution |
| 6. Qatar Grid-Scale Battery Market, By Type |
| 6.1. Qatar Grid-Scale Battery Market Revenues and Revenue Share, by Type, 2023-2030F |
| 6.1.1 Qatar Grid-Scale Battery Market Revenues, by Lithium Ion, 2023-2030F |
| 6.1.2 Qatar Grid-Scale Battery Market Revenues, by Flow Battery, 2023-2030F |
| 6.1.3 Qatar Grid-Scale Battery Market Revenues, by Sodium Based, 2023-2030F |
| 7. Qatar Grid-Scale Battery Market, By Ownership Model |
| 7.1. Qatar Grid-Scale Battery Market Revenues and Revenue Share, by Ownership Model, 2023-2030F |
| 7.1.1 Qatar Grid-Scale Battery Market Revenues, by Utility, 2023-2030F |
| 7.1.2 Qatar Grid-Scale Battery Market Revenues, by Third Party, 2023-2030F |
| 8. Qatar Grid-Scale Battery Market, By Application |
| 8.1. Qatar Grid-Scale Battery Market Revenues and Revenue Share, by Application, 2023-2030F |
| 8.1.1 Qatar Grid-Scale Battery Market Revenues, by Renewable Integration, 2023-2030F |
| 8.1.2 Qatar Grid-Scale Battery Market Revenues, by Peak Shift, 2023-2030F |
| 8.1.3 Qatar Grid-Scale Battery Market Revenues, by Microgrid, 2023-2030F |
| 8.1.4 Qatar Grid-Scale Battery Market Revenues, by Ancillary Services, 2023-2030F |
| 8.1.5 Qatar Grid-Scale Battery Market Revenues, by Back-Up Power, 2023-2030F |
| 9. Qatar Grid-Scale Battery Market Key Performance Indicators |
| 10. Qatar Grid-Scale Battery Market Opportunity Assessment |
| 10.1. Qatar Grid-Scale Battery Market Opportunity Assessment, By Type, 2030F |
| 10.2. Qatar Grid-Scale Battery Market Opportunity Assessment, By Ownership Model, 2030F |
| 10.3. Qatar Grid-Scale Battery Market Opportunity Assessment, By Application, 2030F |
| 11. Qatar Grid-Scale Battery Market Competitive Landscape |
| 11.1. Qatar Grid-Scale Battery Market Competitive Landscape, By Company |
| 11.2. Qatar Grid-Scale Battery Market Competitive Benchmarking, By Operating Parameters |
| 12. Company Profiles |
| 12.1 Tesla Inc. |
| 12.2 Siemens Energy AG |
| 12.3 Hitachi Energy LLC |
| 12.4 Kahramaa |
| 12.5 BYD Company Limited |
| 13. Key Strategic Recommendations |
| 14. Disclaimer |
| List of Figures |
| 1. Qatar Grid-Scale Battery Market Revenues, 2020-2030F, ($ Thousand) |
| 2. Qatar Electricity Generation 2018-2023 (TWh) |
| 3. Qatar Solar Energy Projects 2023 |
| 4. Qatar Average Temperature 2023 ( F) |
| 5. Qatar Grid-Scale Battery Market Revenue Share, By Type, 2020 & 2030F |
| 6. Qatar Grid-Scale Battery Market Revenue Share, By Ownership Model, 2020 & 2030F |
| 7. Qatar Grid-Scale Battery Market Revenue Share, By Application, 2020 & 2030F |
| 8. Qatar LNG Production Capacity 2023-2027F (MTPA) |
| 9. Total GHG Emissions from Energy Sector in Qatar 2023 (MTCO2) |
| 10. Renewable Energy Consumption by Sector (2015 & 2020) (TJ) |
| 11. Qatar Grid-Scale Battery Market Opportunity Assessment, By Type, 2030F |
| 12. Qatar Grid-Scale Battery Market Opportunity Assessment, By Ownership Model, 2030F |
| 13. Qatar Grid-Scale Battery Market Opportunity Assessment, By Application, 2030F |
| 14. Qatar Net capacity change (GW) 2017-2023 |
| 15. Qatar Total Energy Supply in 2023 |
| List of Tables |
| 1. Qatar Grid-Scale Battery Market Revenues, By Type, 2020-2030F ($ Thousand) |
| 2. Qatar Grid-Scale Battery Market Revenues, By Ownership Model, 2020-2030F ($ Thousand) |
| 3. Qatar Grid-Scale Battery Market Revenues, By Application, 2020-2030F ($ Thousand) |
| 4. Qatar Energy Generation in 2023 (GWh) |
Global Go To Market Strategy - 2030
Export potential enables firms to identify high-growth global markets with greater confidence by combining advanced trade intelligence with a structured quantitative methodology. The framework analyzes emerging demand trends and country-level import patterns while integrating macroeconomic and trade datasets such as GDP and population forecasts, bilateral import–export flows, tariff structures, elasticity differentials between developed and developing economies, geographic distance, and import demand projections. Using weighted trade values from 2020–2024 as the base period to project country-to-country export potential for 2030, these inputs are operationalized through calculated drivers such as gravity model parameters, tariff impact factors, and projected GDP per-capita growth. Through an analysis of hidden potentials, demand hotspots, and market conditions that are most favorable to success, this method enables firms to focus on target countries, maximize returns, and global expansion with data, backed by accuracy.
By factoring in the projected importer demand gap that is currently unmet and could be potential opportunity, it identifies the potential for the Exporter (Country) among 190 countries, against the general trade analysis, which identifies the biggest importer or exporter.
To discover high-growth global markets and optimize your business strategy:
Click Here
Pricing
- Single User License$ 1,995
- Department License$ 2,400
- Site License$ 3,120
- Global License$ 3,795

Leadership Perspectives from Industry Events
Search
Thought Leadership and Analyst Meet


Our Clients
6WResearch In News
- India Air Conditioner Market Set for Strong Rebound in 2026 After Weather-Led Correction and GST-Driven Recovery: 6Wresearch
- ADAS in India: How Automatic Emergency Braking, Blind Spot Detection & Driver Monitoring are Transforming Road Safety
- Doha a strategic location for EV manufacturing hub: IPA Qatar
- Demand for luxury TVs surging in the GCC, says Samsung
- Empowering Growth: The Thriving Journey of Bangladesh’s Cable Industry
- Demand for luxury TVs surging in the GCC, says Samsung
Latest Reports
- Nicaragua RPG Gaming Market (2026-2032)
- New Zealand RPG Gaming Market (2026-2032)
- Netherlands RPG Gaming Market (2026-2032)
- Nauru RPG Gaming Market (2026-2032)
- Namibia RPG Gaming Market (2026-2032)
- Mozambique RPG Gaming Market (2026-2032)
- Montenegro RPG Gaming Market (2026-2032)
- Mongolia RPG Gaming Market (2026-2032)
- Monaco RPG Gaming Market (2026-2032)
- Micronesia RPG Gaming Market (2026-2032)
Industry Events and Analyst Meet

EV India Expo 2026

HIMTEX 2026

India Refining Summit 2026

India EV Show 2026

EV tech India Expo 2026
Whitepaper
- Middle East & Africa Commercial Security Market Click here to view more.
- Middle East & Africa Fire Safety Systems & Equipment Market Click here to view more.
- GCC Drone Market Click here to view more.
- Middle East Lighting Fixture Market Click here to view more.
- GCC Physical & Perimeter Security Market Click here to view more.