Qatar Mineral Sand Market (2026-2032) Outlook | Companies, Trends, Size, Forecast, Share, Revenue, Analysis, Industry, Growth & Value
Market Forecast By Material Type (Zircon, Titanium Dioxide, Rutile, Chloride Slag, Sulfate Slag, Ilmenite), By End-user (Building & Construction, Paints & Coatings, Metal & Mining, Others) And Competitive Landscape
| Product Code: ETC101940 | Publication Date: Jun 2021 | Updated Date: Jun 2026 | Product Type: Report | |
| Publisher: 6Wresearch | Author: Ravi Bhandari | No. of Pages: 70 | No. of Figures: 35 | No. of Tables: 5 |
Qatar Mineral Sand Market Size, Share & Growth Rate
The Qatar Mineral Sand Market was estimated at USD 386 Million in 2025 and is projected to reach USD 509 Million by 2032, growing at a CAGR of 4.0% from 2026 to 2032. This growth trajectory is largely fueled by an unprecedented boom in construction activities across the nation, catalyzed by substantial investments in infrastructure. As demand for high-quality mineral sands, including titanium dioxide and zircon, continues to rise, their applications in various sectors such as paints, ceramics, and construction materials remain pivotal to market expansion.
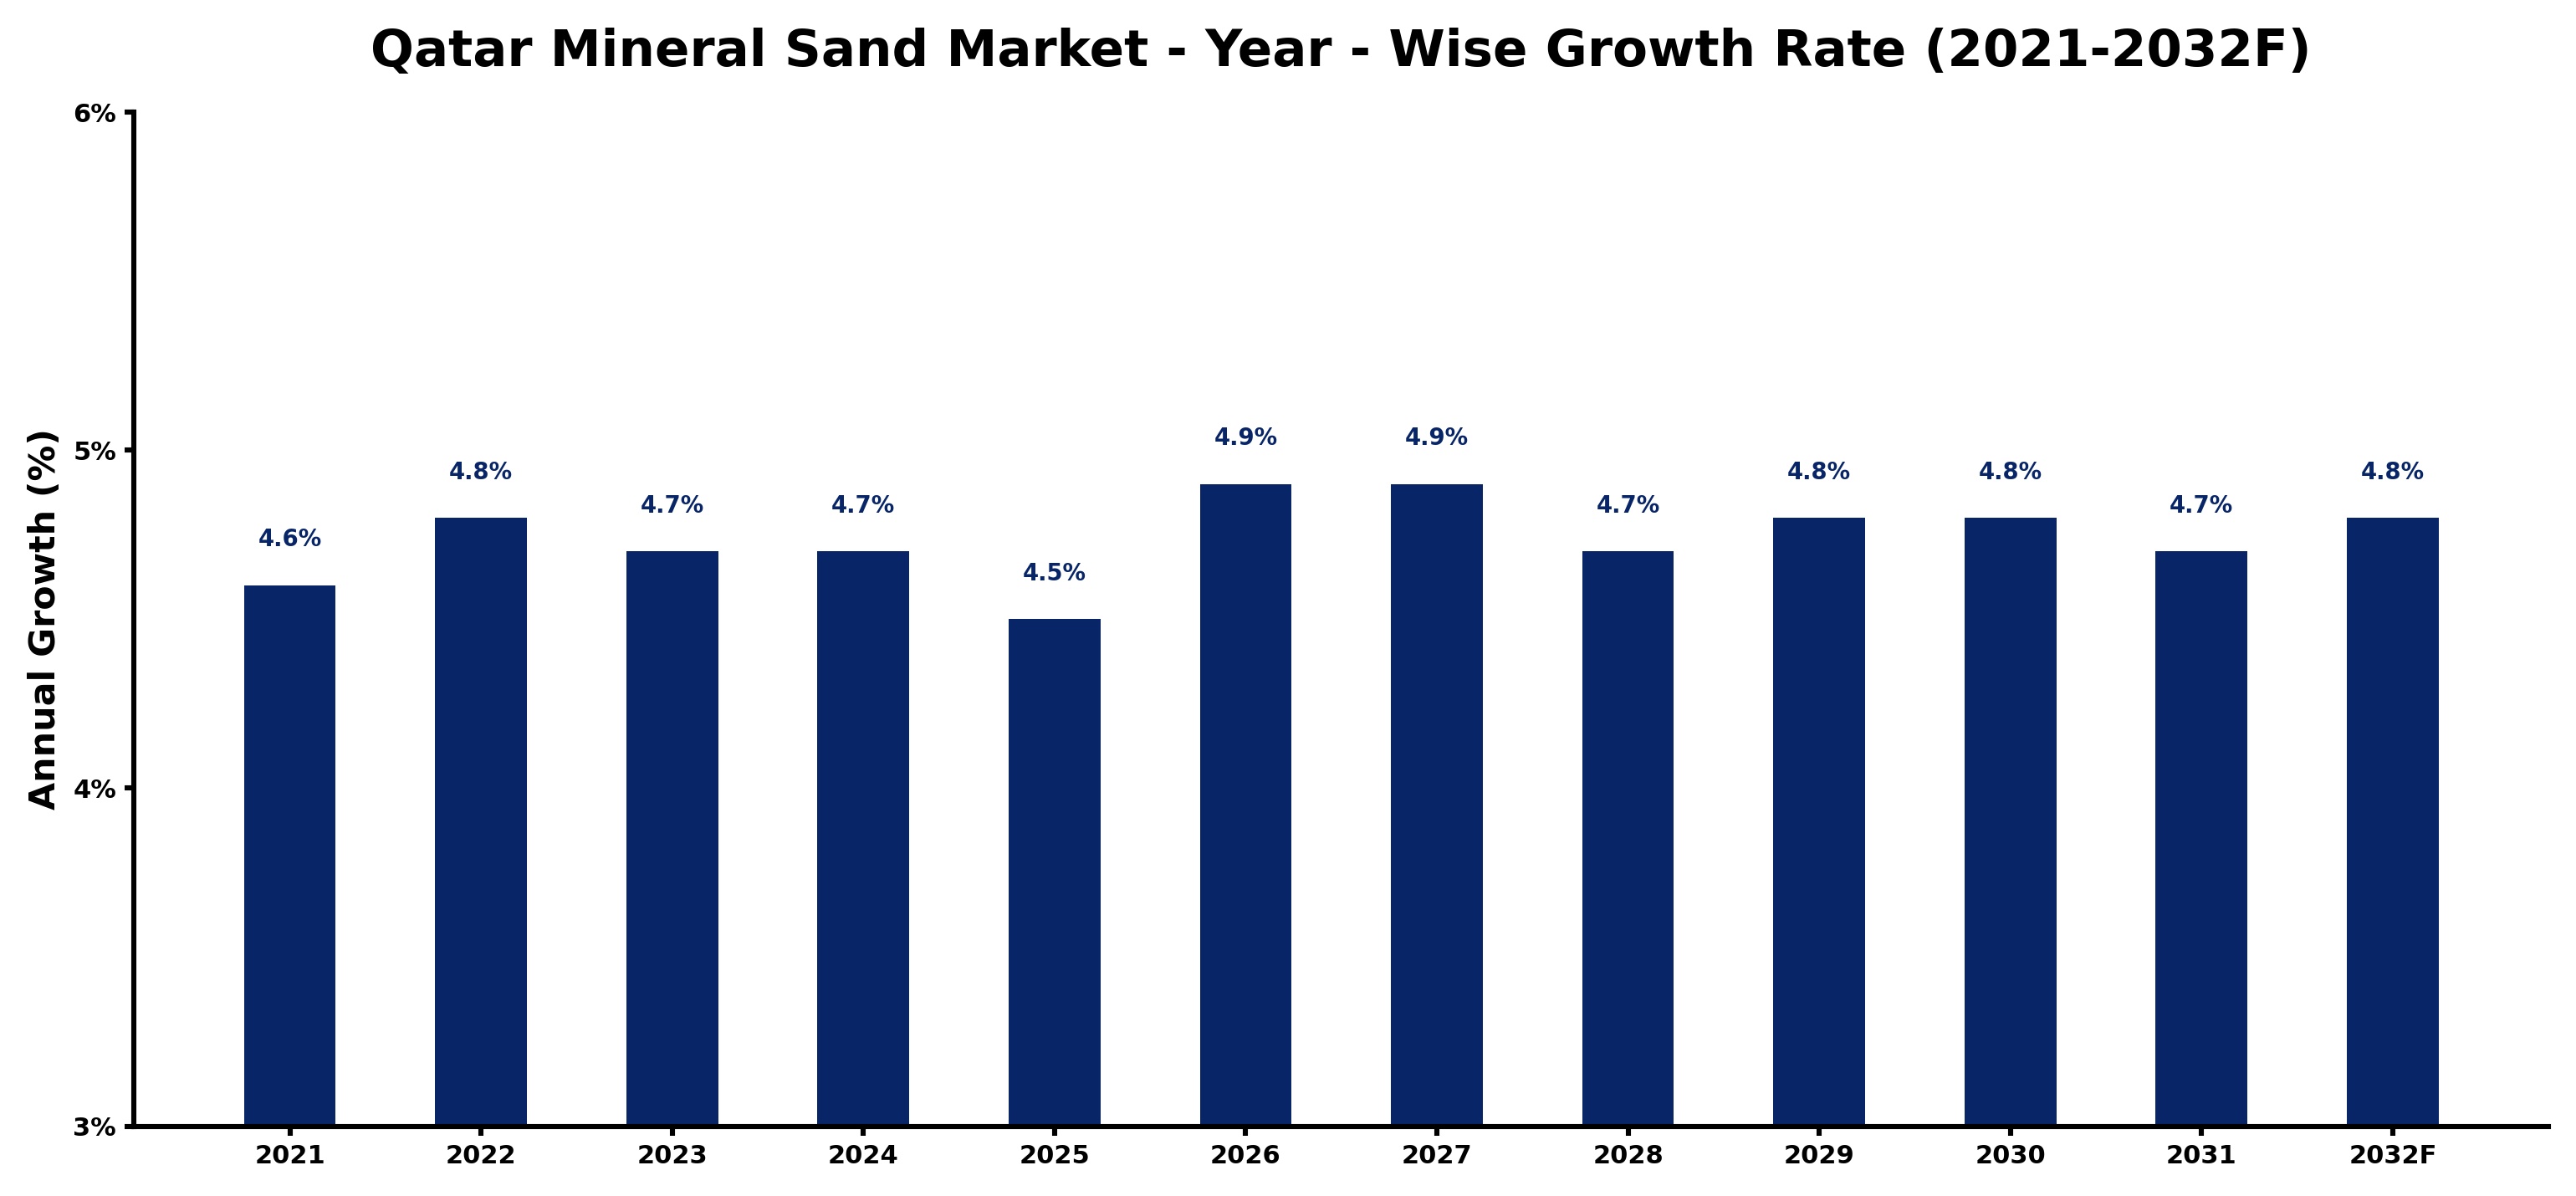
Qatar Mineral Sand Market Growth Rate Analysis (2021-2032)
The Qatar Mineral Sand Market has exhibited stable growth, with a year-on-year increase of 4.6% in 2021, followed by a slight rise to 4.8% in 2022. This upward trend is attributed to increased investments in infrastructure and a growing demand in the construction sector. The growth rate slightly fluctuated, stabilizing at 4.7% in 2023 and 2024, primarily due to consistent consumer demand and ongoing energy transition initiatives that prioritize sustainable materials. As we look ahead, projections indicate a healthy increase to 4.9% in both 2026 and 2027, driven by advancements in technology and a stronger focus on environmental policies. Overall, the market remains resilient, adapting effectively to the evolving industrial landscape.
Qatar Mineral Sand Market Year-wise Growth Rate and Key Drivers
This graph highlights how the Qatar Mineral Sand Market has steadily grown over the past five years, supported by major growth factors.
The table below presents the year‑wise growth rates along with the key drivers influencing the market
| Year | Growth Rate | Major Drivers |
| 2021 | 4.6% | Mineral sand supply chain optimization boosted local construction material production |
| 2022 | 4.8% | Export driven mineral sand demand boosts local processing facility investments |
| 2023 | 4.7% | Domestic technology upgrades optimize mineral sand extraction processes |
| 2024 | 4.7% | Construction modernization projects boosted demand for mineral sand supplies |
| 2025 | 4.5% | Domestic infrastructure upgrades demand higher capacity for mineral processing |
| 2026 | 4.9% | Domestic construction modernization boosts demand for mineral sand supplies |
| 2027 | 4.9% | Technology adoption in mineral processing boosts local sand production |
| 2028 | 4.7% | Manufacturing investments in mineral processing boost local supply chain resilience |
| 2029 | 4.8% | LNG infrastructure projects boost demand for industrial mineral products |
| 2030 | 4.8% | Technology integration in construction drives demand for mineral sands |
| 2031 | 4.7% | Modernized construction methods boost demand for high quality mineral sands |
| 2032 | 4.8% | LNG infrastructure projects boost demand for mineral sand applications |
Note - Market size estimations and growth projections presented in this report are based on 6Wresearch’s advanced forecasting approach, validated with industry datasets as of June 2026.
Qatar Mineral Sand Market Synopsis
The mineral sand sector in Qatar is a vital contributor to the economy, accounting for approximately 30% of all nonfuel commodity exports. With yearly earnings of around USD 600 Million from mineral sands alone, the market is heavily oriented towards the Asia-Pacific region, exporting to key players like Thailand, Japan, and India.
Recent shifts in Qatar’s infrastructure strategies have prioritized the use of sustainable materials, further influencing the mineral sands market. This focus not only ensures high-quality production standards but also aligns with global sustainability trends, positioning Qatar as a potential leader in responsible mineral extraction practices.
Qatar Mineral Sand Market Key Takeaways
- The market is significantly influenced by the construction sector's growth, emphasizing the need for high-quality mineral sands.
- Increasing exports to the Asia-Pacific region showcase Qatar's strong position in the global mineral sands landscape.
- Sustainable extraction methods are becoming a priority among local producers, catering to growing environmental concerns.
- As global industrial activities rebound post-pandemic, the market is set to regain its momentum.
- Technological advancements in extraction processes are expected to enhance product quality and market competitiveness.
Evaluation of Restraints in Qatar Mineral Sand Market
Despite promising growth prospects, the Qatar Mineral Sand Market faces real constraints that can affect its trajectory. Primarily, disruptions arising from the COVID-19 pandemic have led to a temporary decline in industrial activities and construction projects. As businesses gradually recover, the market must contend with the lingering effects of supply chain instability and fluctuating demand, which may challenge growth momentum in the near term.
Qatar Mineral Sand Market Trends
Several trends are shaping the Qatar Mineral Sand Market as we move further into the decade. The construction industry's rapid expansion is complemented by a shift towards using more environmentally friendly materials, driving demand for sustainable mineral extraction methods. Additionally, technological innovation in processing mineral sands is creating opportunities to enhance product applications and quality, particularly in the ceramics and paints sectors.
Qatar Mineral Sand Market Opportunities
The potential for growth in the Qatar Mineral Sand Market remains robust, especially given the nation's ambitious infrastructure projects. Investment in high-quality mineral sands for construction purposes presents a significant opportunity for stakeholders. Furthermore, with the global emphasis on sustainability, there is a clear opening for companies that prioritize environmentally conscious extraction techniques, potentially unlocking new markets and revenue streams.
Government Initiatives in the Qatar Mineral Sand Market
The Qatari government is actively promoting policies that favor infrastructure development and sustainable resource management. Public spending on large-scale construction projects is expected to continue, alongside initiatives aimed at enhancing the quality and sustainability of mineral extraction. Supportive regulations and incentives for using locally sourced materials could further bolster the mineral sands market, ensuring its alignment with national development goals.
Future Insights of the Qatar Mineral Sand Market
Looking ahead to 2026-2032, the Qatar Mineral Sand Market is poised for significant evolution. As the nation accelerates its infrastructure projects, demand for mineral sands is expected to increase steadily. The drive towards sustainability will likely shape extraction practices, with an emphasis on minimizing environmental impact while maximizing product quality. This dual focus on growth and responsibility could position Qatar as a leader in the global mineral sands market.
Qatar Mineral Sand Market Latest Developments (May 2025 - June 2026)
In the recent period, the Qatar Mineral Sand Market has witnessed a resurgence in activities as infrastructure projects are revitalized. Companies are exploring innovative techniques to enhance the efficiency of mineral extraction and processing, alongside an increased emphasis on sustainable practices. As industrial activities ramp up, there is growing collaboration among stakeholders to navigate the complexities of the supply chain and meet rising demand.
Qatar Mineral Sand Market - Key Attractiveness of the Report
- 10 Years of Market Numbers
- Historical Data Starting from 2022 to 2025
- Base Year: 2025
- Forecast Data until 2032
- Key Performance Indicators Impacting the Market
- Major Upcoming Developments and Projects
Key Highlights of the Report:
- Qatar Mineral Sand Market Outlook
- Market Size of Qatar Mineral Sand Market, 2025
- Forecast of Qatar Mineral Sand Market, 2032
- Historical Data and Forecast of Qatar Mineral Sand Revenues & Volume for the Period 2022-2032F
- Qatar Mineral Sand Market Trend Evolution
- Qatar Mineral Sand Market Drivers and Challenges
- Qatar Mineral Sand Price Trends
- Qatar Mineral Sand Porter's Five Forces
- Qatar Mineral Sand Industry Life Cycle
- Historical Data and Forecast of Qatar Mineral Sand Market Revenues & Volume By Material Type for the Period 2022-2032F
- Historical Data and Forecast of Qatar Mineral Sand Market Revenues & Volume By Zircon for the Period 2022-2032F
- Historical Data and Forecast of Qatar Mineral Sand Market Revenues & Volume By Titanium Dioxide for the Period 2022-2032F
- Historical Data and Forecast of Qatar Mineral Sand Market Revenues & Volume By Rutile for the Period 2022-2032F
- Historical Data and Forecast of Qatar Mineral Sand Market Revenues & Volume By Chloride Slag for the Period 2022-2032F
- Historical Data and Forecast of Qatar Mineral Sand Market Revenues & Volume By Sulfate Slag for the Period 2022-2032F
- Historical Data and Forecast of Qatar Mineral Sand Market Revenues & Volume By Ilmenite for the Period 2022-2032F
- Historical Data and Forecast of Qatar Mineral Sand Market Revenues & Volume By End-user for the Period 2022-2032F
- Historical Data and Forecast of Qatar Mineral Sand Market Revenues & Volume By Building & Construction for the Period 2022-2032F
- Historical Data and Forecast of Qatar Mineral Sand Market Revenues & Volume By Paints & Coatings for the Period 2022-2032F
- Historical Data and Forecast of Qatar Mineral Sand Market Revenues & Volume By Metal & Mining for the Period 2022-2032F
- Historical Data and Forecast of Qatar Mineral Sand Market Revenues & Volume By Others for the Period 2022-2032F
- Qatar Mineral Sand Import Export Trade Statistics
- Market Opportunity Assessment By Material Type
- Market Opportunity Assessment By End-user
- Qatar Mineral Sand Top Companies Market Share
- Qatar Mineral Sand Competitive Benchmarking By Technical and Operational Parameters
- Qatar Mineral Sand Company Profiles
- Qatar Mineral Sand Key Strategic Recommendations
Qatar Mineral Sand Market - Frequently Asked Questions
The Qatar Mineral Sand Market is expected to grow at a CAGR of 4.0% from 2026 to 2032, starting from an estimated size of USD 386 Million in 2025 and projected to reach USD 509 Million by 2032.
The major export markets for Qatar’s mineral sands include several Asia-Pacific countries, notably Thailand, Japan, China, South Korea, and India, reflecting the region's robust demand for high-quality industrial materials.
Sustainable extraction is becoming increasingly important in the Qatar Mineral Sand Market, as companies aim to meet global environmental standards while also catering to the growing demand for eco-friendly construction materials.
The COVID-19 pandemic led to reduced industrial and construction activities, resulting in a temporary decline in demand for mineral sands. However, as the economy recovers, demand is expected to rebound as projects resume.
The growth of the Qatar Mineral Sand Market is primarily driven by a construction boom fueled by substantial investments in infrastructure, which in turn increases the demand for mineral sands such as titanium dioxide and zircon for various applications.
6Wresearch actively monitors the Qatar Mineral Sand Market and publishes its comprehensive annual report, highlighting emerging trends, growth drivers, revenue analysis, and forecast outlook. Our insights help businesses to make data-backed strategic decisions with ongoing market dynamics. Our analysts track relevent industries related to the Qatar Mineral Sand Market, allowing our clients with actionable intelligence and reliable forecasts tailored to emerging regional needs.
Yes, we provide customisation as per your requirements. To learn more, feel free to contact us on sales@6wresearch.com
1 Executive Summary |
2 Introduction |
2.1 Key Highlights of the Report |
2.2 Report Description |
2.3 Market Scope & Segmentation |
2.4 Research Methodology |
2.5 Assumptions |
3 Qatar Mineral Sand Market Overview |
3.1 Qatar Country Macro Economic Indicators |
3.2 Qatar Mineral Sand Market Revenues & Volume, 2022 & 2032F |
3.3 Qatar Mineral Sand Market - Industry Life Cycle |
3.4 Qatar Mineral Sand Market - Porter's Five Forces |
3.5 Qatar Mineral Sand Market Revenues & Volume Share, By Material Type, 2022 & 2032F |
3.6 Qatar Mineral Sand Market Revenues & Volume Share, By End-user, 2022 & 2032F |
4 Qatar Mineral Sand Market Dynamics |
4.1 Impact Analysis |
4.2 Market Drivers |
4.3 Market Restraints |
5 Qatar Mineral Sand Market Trends |
6 Qatar Mineral Sand Market, By Types |
6.1 Qatar Mineral Sand Market, By Material Type |
6.1.1 Overview and Analysis |
6.1.2 Qatar Mineral Sand Market Revenues & Volume, By Material Type, 2022-2032F |
6.1.3 Qatar Mineral Sand Market Revenues & Volume, By Zircon, 2022-2032F |
6.1.4 Qatar Mineral Sand Market Revenues & Volume, By Titanium Dioxide, 2022-2032F |
6.1.5 Qatar Mineral Sand Market Revenues & Volume, By Rutile, 2022-2032F |
6.1.6 Qatar Mineral Sand Market Revenues & Volume, By Chloride Slag, 2022-2032F |
6.1.7 Qatar Mineral Sand Market Revenues & Volume, By Sulphate Slag, 2022-2032F |
6.1.8 Qatar Mineral Sand Market Revenues & Volume, By Ilmenite, 2022-2032F |
6.2 Qatar Mineral Sand Market, By End-user |
6.2.1 Overview and Analysis |
6.2.2 Qatar Mineral Sand Market Revenues & Volume, By Building & Construction, 2022-2032F |
6.2.3 Qatar Mineral Sand Market Revenues & Volume, By Paints & Coatings, 2022-2032F |
6.2.4 Qatar Mineral Sand Market Revenues & Volume, By Metal & Mining, 2022-2032F |
6.2.5 Qatar Mineral Sand Market Revenues & Volume, By Others, 2022-2032F |
7 Qatar Mineral Sand Market Import-Export Trade Statistics |
7.1 Qatar Mineral Sand Market Export to Major Countries |
7.2 Qatar Mineral Sand Market Imports from Major Countries |
8 Qatar Mineral Sand Market Key Performance Indicators |
9 Qatar Mineral Sand Market - Opportunity Assessment |
9.1 Qatar Mineral Sand Market Opportunity Assessment, By Material Type, 2022 & 2032F |
9.2 Qatar Mineral Sand Market Opportunity Assessment, By End-user, 2022 & 2032F |
10 Qatar Mineral Sand Market - Competitive Landscape |
10.1 Qatar Mineral Sand Market Revenue Share, By Companies, 2025 |
10.2 Qatar Mineral Sand Market Competitive Benchmarking, By Operating and Technical Parameters |
11 Company Profiles |
12 Recommendations |
13 Disclaimer |
Global Go To Market Strategy - 2030
Export potential enables firms to identify high-growth global markets with greater confidence by combining advanced trade intelligence with a structured quantitative methodology. The framework analyzes emerging demand trends and country-level import patterns while integrating macroeconomic and trade datasets such as GDP and population forecasts, bilateral import–export flows, tariff structures, elasticity differentials between developed and developing economies, geographic distance, and import demand projections. Using weighted trade values from 2020–2024 as the base period to project country-to-country export potential for 2030, these inputs are operationalized through calculated drivers such as gravity model parameters, tariff impact factors, and projected GDP per-capita growth. Through an analysis of hidden potentials, demand hotspots, and market conditions that are most favorable to success, this method enables firms to focus on target countries, maximize returns, and global expansion with data, backed by accuracy.
By factoring in the projected importer demand gap that is currently unmet and could be potential opportunity, it identifies the potential for the Exporter (Country) among 190 countries, against the general trade analysis, which identifies the biggest importer or exporter.
To discover high-growth global markets and optimize your business strategy:
Click Here
Pricing
- Single User License$ 1,995
- Department License$ 2,400
- Site License$ 3,120
- Global License$ 3,795

Leadership Perspectives from Industry Events
Search
Thought Leadership and Analyst Meet


Our Clients
6WResearch In News
- India Air Conditioner Market Set for Strong Rebound in 2026 After Weather-Led Correction and GST-Driven Recovery: 6Wresearch
- ADAS in India: How Automatic Emergency Braking, Blind Spot Detection & Driver Monitoring are Transforming Road Safety
- Doha a strategic location for EV manufacturing hub: IPA Qatar
- Demand for luxury TVs surging in the GCC, says Samsung
- Empowering Growth: The Thriving Journey of Bangladesh’s Cable Industry
- Demand for luxury TVs surging in the GCC, says Samsung
Latest Reports
- Poland Fire Protection Systems Market (2026-2032)
- Cape Verde Portable Hand-Thrown Extinguisher Market (2026-2032)
- Canada Portable Hand-Thrown Extinguisher Market (2026-2032)
- Cameroon Portable Hand-Thrown Extinguisher Market (2026-2032)
- Burundi Portable Hand-Thrown Extinguisher Market (2026-2032)
- Burkina Faso Portable Hand-Thrown Extinguisher Market (2026-2032)
- Bulgaria Portable Hand-Thrown Extinguisher Market (2026-2032)
- Brunei Portable Hand-Thrown Extinguisher Market (2026-2032)
- Botswana Portable Hand-Thrown Extinguisher Market (2026-2032)
- Bosnia and Herzegovina Portable Hand-Thrown Extinguisher Market (2026-2032)
Industry Events and Analyst Meet

HIMTEX 2026

India Refining Summit 2026

India EV Show 2026

EV tech India Expo 2026

Auto Tech Asia 2026
Whitepaper
- Middle East & Africa Commercial Security Market Click here to view more.
- Middle East & Africa Fire Safety Systems & Equipment Market Click here to view more.
- GCC Drone Market Click here to view more.
- Middle East Lighting Fixture Market Click here to view more.
- GCC Physical & Perimeter Security Market Click here to view more.