Romania Chelating Agents Market (2026-2032) Outlook | Share, Revenue, Value, Industry, Trends, Growth, Forecast, Companies, Analysis & Size
Market Forecast By Type (Non-biodegradable Chelating Agents, Biodegradable Chelating Agents), By Application (Pulp & Paper, Cleaning, Water Treatment, Agrochemicals, Personal Care, Others) And Competitive Landscape
| Product Code: ETC4476019 | Publication Date: Jul 2023 | Updated Date: Mar 2026 | Product Type: Report | |
| Publisher: 6Wresearch | Author: Dhaval Chaurasia | No. of Pages: 85 | No. of Figures: 45 | No. of Tables: 25 |
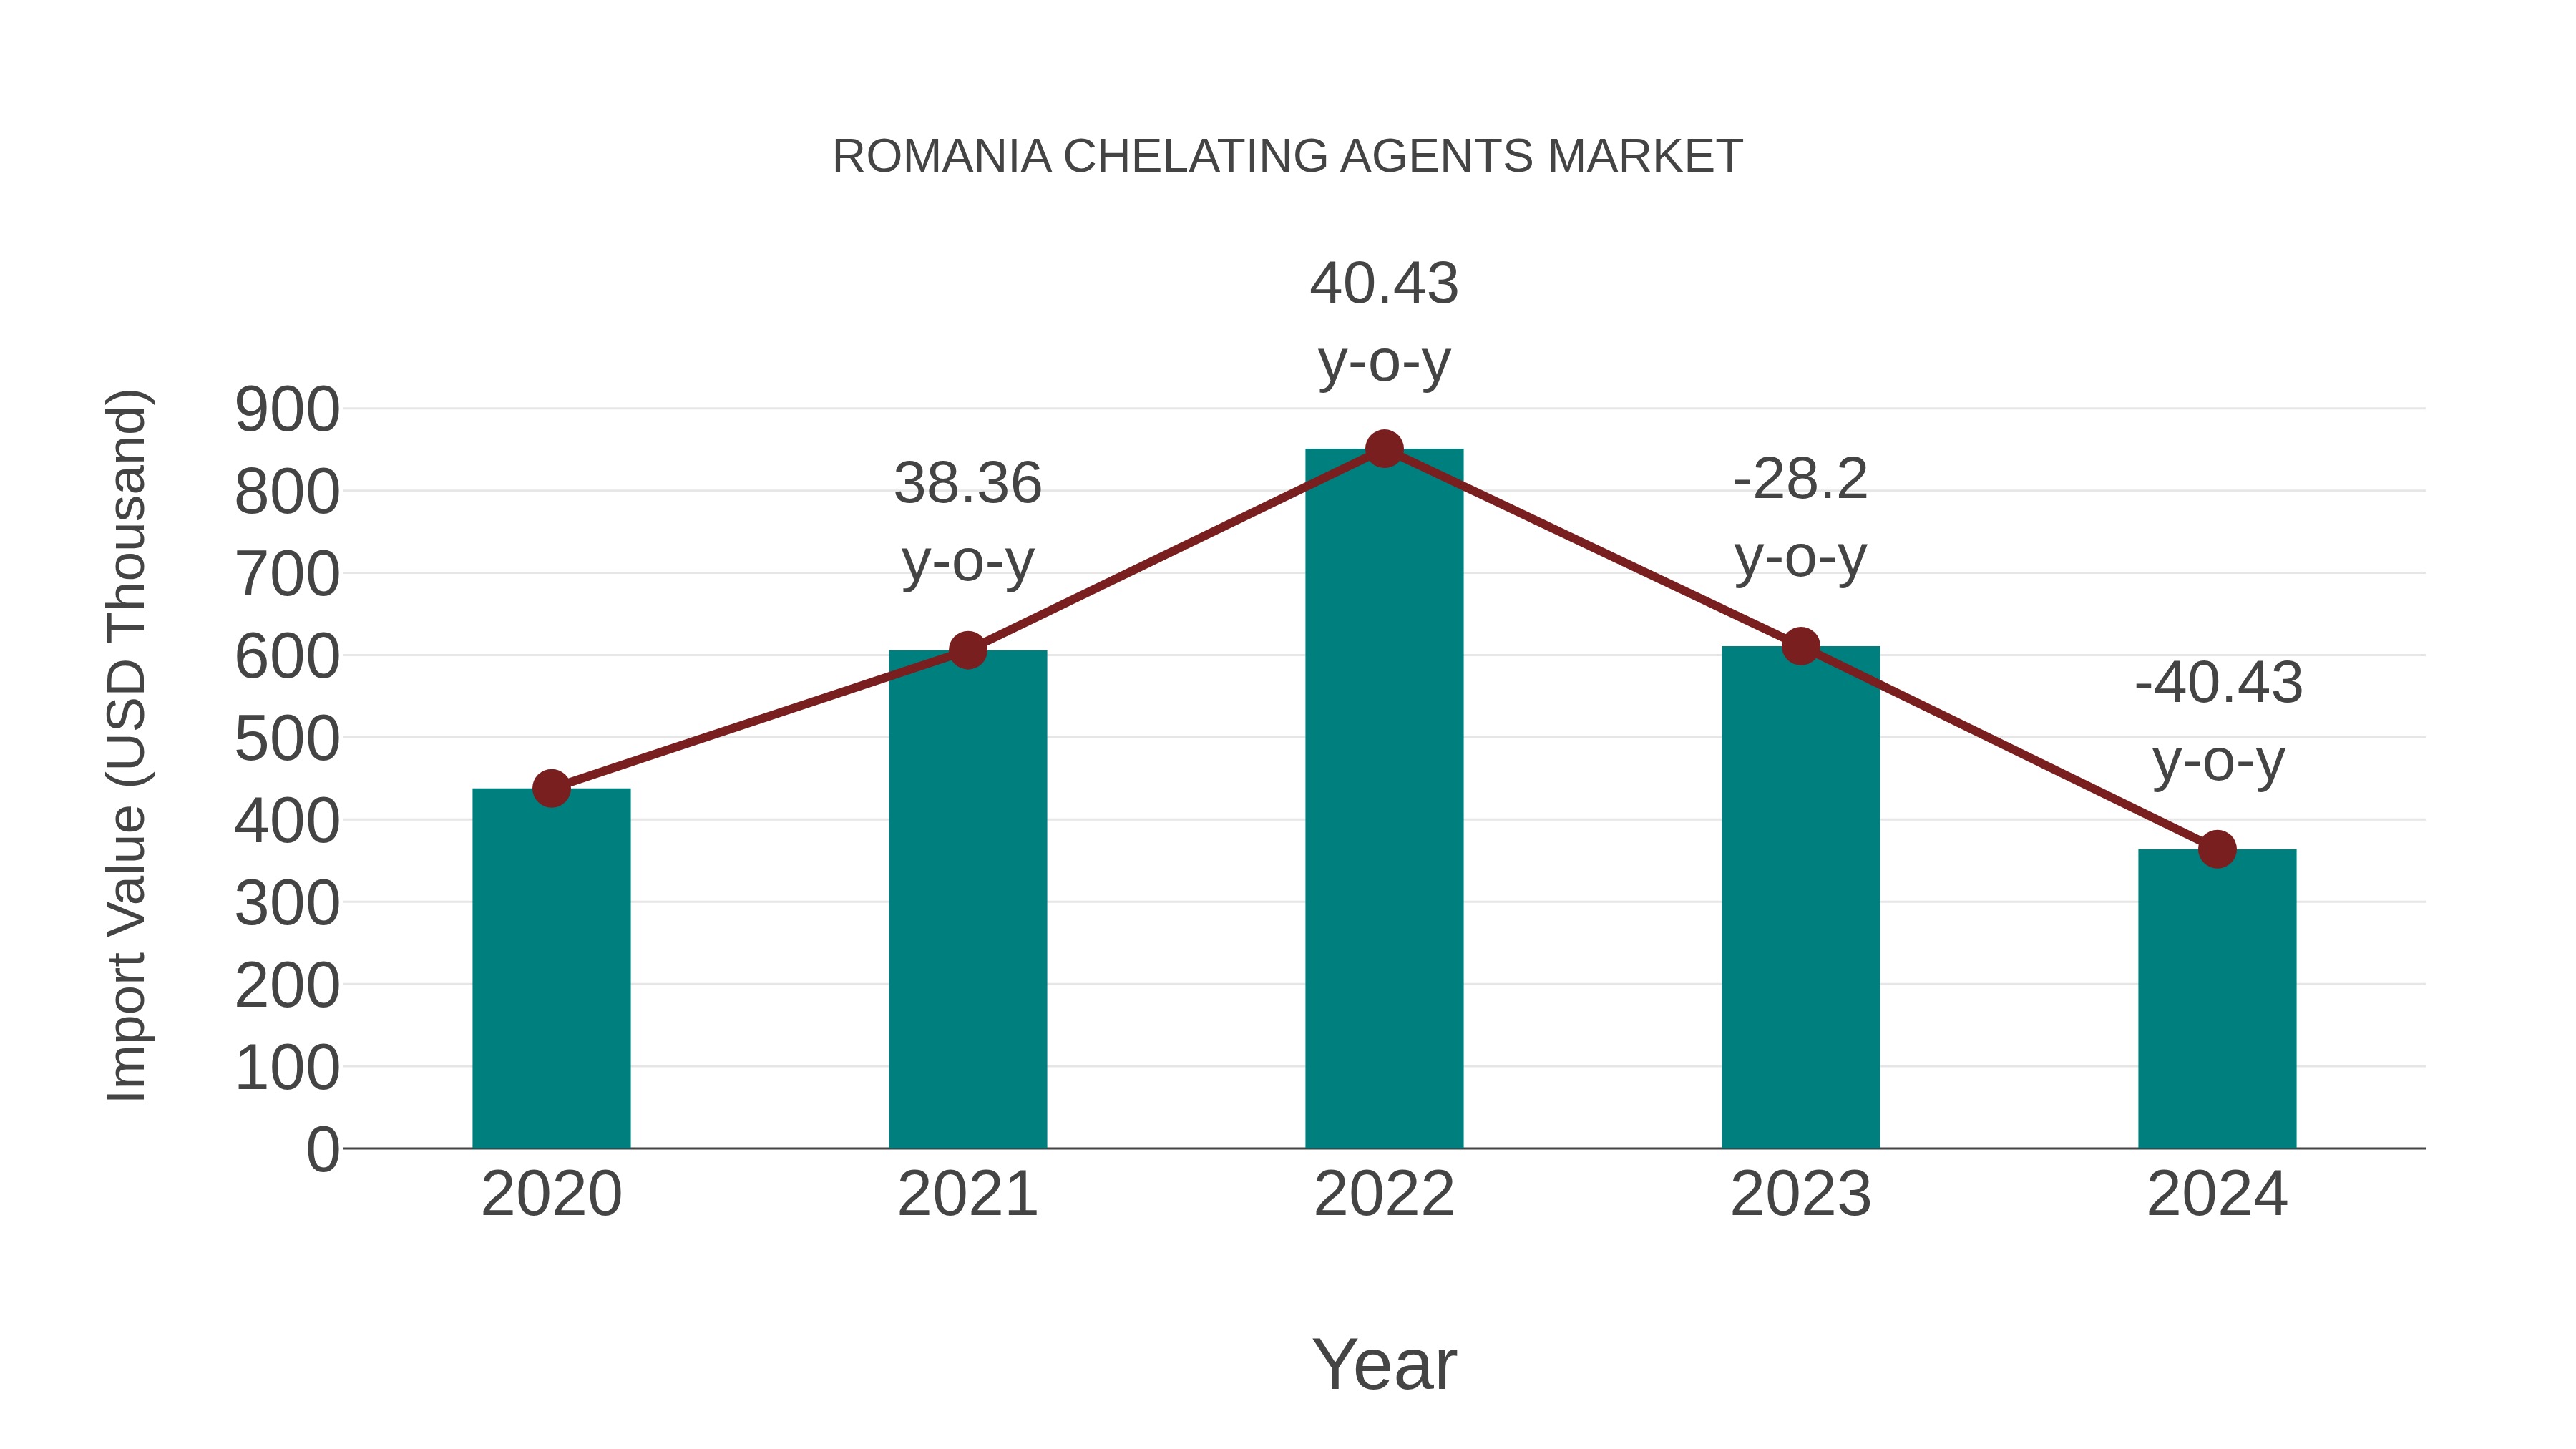
Romania Chelating Agents Market: Import Trend Analysis
In the Romania chelating agents market, the import trend experienced a notable decline from 2023 to 2024, with a growth rate of -40.43%. The compound annual growth rate (CAGR) for imports from 2020 to 2024 stood at -4.52%. This decline could be attributed to shifts in demand dynamics or changes in trade policies impacting the market`s import momentum.
Romania Chelating Agents Market Overview
The chelating agents market in Romania plays a crucial role in diverse industrial sectors, including agriculture, water treatment, and pharmaceuticals. Chelating agents are essential for managing metal ions and improving the efficacy of chemical processes, thereby ensuring product quality and environmental compliance. The market is witnessing growing demand for biodegradable and eco-friendly chelating agents, driven by regulatory pressures and sustainability initiatives. Key suppliers are focusing on developing innovative formulations that offer superior performance while minimizing environmental impact, addressing the evolving needs of end-users across various applications.
Drivers of the market
Chelating agents find widespread applications in agriculture, water treatment, and the pharmaceutical industry in Romania. The market is driven by the need for water softening, metal ion control, and enhanced product stability in various industrial processes.
Challenges of the market
Challenges in the chelating agents market in Romania include the complexity of regulatory compliance, environmental concerns regarding wastewater treatment and disposal of chemicals, and the competitive landscape dominated by multinational corporations. Developing cost-effective and sustainable chelating agents remains a key challenge for local manufacturers.
Government Policy of the market
Chelating agents used in various industrial processes are regulated for environmental impact and safety. The government sets limits on usage and discharge to prevent pollution and ensure compliance with environmental standards.
Key Highlights of the Report:
- Romania Chelating Agents Market Outlook
- Market Size of Romania Chelating Agents Market, 2025
- Forecast of Romania Chelating Agents Market, 2032
- Historical Data and Forecast of Romania Chelating Agents Revenues & Volume for the Period 2022-2032F
- Romania Chelating Agents Market Trend Evolution
- Romania Chelating Agents Market Drivers and Challenges
- Romania Chelating Agents Price Trends
- Romania Chelating Agents Porter's Five Forces
- Romania Chelating Agents Industry Life Cycle
- Historical Data and Forecast of Romania Chelating Agents Market Revenues & Volume By Type for the Period 2022-2032F
- Historical Data and Forecast of Romania Chelating Agents Market Revenues & Volume By Non-biodegradable Chelating Agents for the Period 2022-2032F
- Historical Data and Forecast of Romania Chelating Agents Market Revenues & Volume By Biodegradable Chelating Agents for the Period 2022-2032F
- Historical Data and Forecast of Romania Chelating Agents Market Revenues & Volume By Application for the Period 2022-2032F
- Historical Data and Forecast of Romania Chelating Agents Market Revenues & Volume By Pulp & Paper for the Period 2022-2032F
- Historical Data and Forecast of Romania Chelating Agents Market Revenues & Volume By Cleaning for the Period 2022-2032F
- Historical Data and Forecast of Romania Chelating Agents Market Revenues & Volume By Water Treatment for the Period 2022-2032F
- Historical Data and Forecast of Romania Chelating Agents Market Revenues & Volume By Agrochemicals for the Period 2022-2032F
- Historical Data and Forecast of Romania Chelating Agents Market Revenues & Volume By Personal Care for the Period 2022-2032F
- Historical Data and Forecast of Romania Chelating Agents Market Revenues & Volume By Others for the Period 2022-2032F
- Romania Chelating Agents Import Export Trade Statistics
- Market Opportunity Assessment By Type
- Market Opportunity Assessment By Application
- Romania Chelating Agents Top Companies Market Share
- Romania Chelating Agents Competitive Benchmarking By Technical and Operational Parameters
- Romania Chelating Agents Company Profiles
- Romania Chelating Agents Key Strategic Recommendations
Romania Chelating Agents Market (2026-2032): FAQs
6Wresearch actively monitors the Romania Chelating Agents Market and publishes its comprehensive annual report, highlighting emerging trends, growth drivers, revenue analysis, and forecast outlook. Our insights help businesses to make data-backed strategic decisions with ongoing market dynamics. Our analysts track relevent industries related to the Romania Chelating Agents Market, allowing our clients with actionable intelligence and reliable forecasts tailored to emerging regional needs.
Yes, we provide customisation as per your requirements. To learn more, feel free to contact us on sales@6wresearch.com
1 Executive Summary |
2 Introduction |
2.1 Key Highlights of the Report |
2.2 Report Description |
2.3 Market Scope & Segmentation |
2.4 Research Methodology |
2.5 Assumptions |
3 Romania Chelating Agents Market Overview |
3.1 Romania Country Macro Economic Indicators |
3.2 Romania Chelating Agents Market Revenues & Volume, 2022 & 2032F |
3.3 Romania Chelating Agents Market - Industry Life Cycle |
3.4 Romania Chelating Agents Market - Porter's Five Forces |
3.5 Romania Chelating Agents Market Revenues & Volume Share, By Type, 2022 & 2032F |
3.6 Romania Chelating Agents Market Revenues & Volume Share, By Application, 2022 & 2032F |
4 Romania Chelating Agents Market Dynamics |
4.1 Impact Analysis |
4.2 Market Drivers |
4.2.1 Growing awareness about environmental concerns and the need for sustainable practices driving demand for eco-friendly chelating agents. |
4.2.2 Increasing industrial activities and infrastructure development in Romania leading to higher demand for chelating agents in various applications. |
4.2.3 Rising adoption of chelating agents in agriculture for enhancing nutrient uptake and soil quality. |
4.3 Market Restraints |
4.3.1 Fluctuating prices of raw materials used in chelating agents production impacting profit margins. |
4.3.2 Stringent regulations and compliance requirements for chelating agents affecting market entry and product development. |
4.3.3 Competition from alternative solutions and substitutes posing a challenge to the growth of the chelating agents market in Romania. |
5 Romania Chelating Agents Market Trends |
6 Romania Chelating Agents Market, By Types |
6.1 Romania Chelating Agents Market, By Type |
6.1.1 Overview and Analysis |
6.1.2 Romania Chelating Agents Market Revenues & Volume, By Type, 2022-2032F |
6.1.3 Romania Chelating Agents Market Revenues & Volume, By Non-biodegradable Chelating Agents, 2022-2032F |
6.1.4 Romania Chelating Agents Market Revenues & Volume, By Biodegradable Chelating Agents, 2022-2032F |
6.2 Romania Chelating Agents Market, By Application |
6.2.1 Overview and Analysis |
6.2.2 Romania Chelating Agents Market Revenues & Volume, By Pulp & Paper, 2022-2032F |
6.2.3 Romania Chelating Agents Market Revenues & Volume, By Cleaning, 2022-2032F |
6.2.4 Romania Chelating Agents Market Revenues & Volume, By Water Treatment, 2022-2032F |
6.2.5 Romania Chelating Agents Market Revenues & Volume, By Agrochemicals, 2022-2032F |
6.2.6 Romania Chelating Agents Market Revenues & Volume, By Personal Care, 2022-2032F |
6.2.7 Romania Chelating Agents Market Revenues & Volume, By Others, 2022-2032F |
7 Romania Chelating Agents Market Import-Export Trade Statistics |
7.1 Romania Chelating Agents Market Export to Major Countries |
7.2 Romania Chelating Agents Market Imports from Major Countries |
8 Romania Chelating Agents Market Key Performance Indicators |
8.1 Environmental impact assessment of chelating agents used in various industries. |
8.2 Adoption rate of sustainable chelating agents in different applications. |
8.3 Research and development investment in innovative chelating agent formulations. |
8.4 Number of collaborations and partnerships for expanding market reach. |
8.5 Efficiency improvement in chelating agent manufacturing processes. |
9 Romania Chelating Agents Market - Opportunity Assessment |
9.1 Romania Chelating Agents Market Opportunity Assessment, By Type, 2022 & 2032F |
9.2 Romania Chelating Agents Market Opportunity Assessment, By Application, 2022 & 2032F |
10 Romania Chelating Agents Market - Competitive Landscape |
10.1 Romania Chelating Agents Market Revenue Share, By Companies, 2025 |
10.2 Romania Chelating Agents Market Competitive Benchmarking, By Operating and Technical Parameters |
11 Company Profiles |
12 Recommendations |
13 Disclaimer |
Export potential assessment - trade Analytics for 2030
Export potential enables firms to identify high-growth global markets with greater confidence by combining advanced trade intelligence with a structured quantitative methodology. The framework analyzes emerging demand trends and country-level import patterns while integrating macroeconomic and trade datasets such as GDP and population forecasts, bilateral import–export flows, tariff structures, elasticity differentials between developed and developing economies, geographic distance, and import demand projections. Using weighted trade values from 2020–2024 as the base period to project country-to-country export potential for 2030, these inputs are operationalized through calculated drivers such as gravity model parameters, tariff impact factors, and projected GDP per-capita growth. Through an analysis of hidden potentials, demand hotspots, and market conditions that are most favorable to success, this method enables firms to focus on target countries, maximize returns, and global expansion with data, backed by accuracy.
By factoring in the projected importer demand gap that is currently unmet and could be potential opportunity, it identifies the potential for the Exporter (Country) among 190 countries, against the general trade analysis, which identifies the biggest importer or exporter.
To discover high-growth global markets and optimize your business strategy:
Click Here
Pricing
- Single User License$ 1,995
- Department License$ 2,400
- Site License$ 3,120
- Global License$ 3,795

Search
Thought Leadership and Analyst Meet


Our Clients
Latest Reports
- United Kingdom (UK) Long-term Care Insurance Market (2026-2032) | Growth, Share, Consumer Insights, Drivers, Opportunities, Competition, Pricing Analysis, Segments, Restraints, Companies, Competitive, Value, Outlook, Size, Demand, Analysis, Challenges, Strategic Insights, Investment Trends, Revenue, Trends, Supply, Forecast
- United Kingdom (UK) Long Term Care Market (2026-2032) | Companies, Outlook, Analysis, Trends, Value, Revenue, Segmentation, Share, Forecast, Competitive Landscape, Growth, Size & Forecast
- Iraq Insulation and Waterproofing Market (2026-2032) | Outlook, Drivers, Growth, Size, Share, Industry, Revenue, Trends, Demand, Competitive, Strategic Insights, Opportunities, Segments, Companies, Challenges, Strategy, Consumer Insights, Analysis, Investment Trends, Value, Segmentation, Forecast, Restraints
- India Switchgear Market Outlook (2026-2032) | Size, Share, Trends, Growth, Revenue, Forecast, Analysis, Value, Outlook
- Pakistan Contraceptive Implants Market (2025-2031) | Demand, Growth, Size, Share, Industry, Pricing Analysis, Competitive, Strategic Insights, Strategy, Consumer Insights, Analysis, Investment Trends, Opportunities, Revenue, Segments, Value, Segmentation, Supply, Forecast, Restraints, Outlook, Competition, Drivers, Trends, Companies, Challenges
- Sri Lanka Packaging Market (2026-2032) | Outlook, Competition, Drivers, Trends, Demand, Pricing Analysis, Competitive, Strategic Insights, Companies, Challenges, Strategy, Consumer Insights, Analysis, Investment Trends, Opportunities, Growth, Size, Share, Industry, Revenue, Segments, Value, Segmentation, Supply, Forecast, Restraints
- India Kids Watches Market (2026-2032) | Strategy, Consumer Insights, Analysis, Investment Trends, Opportunities, Growth, Size, Share, Industry, Revenue, Segments, Value, Segmentation, Supply, Forecast, Restraints, Outlook, Competition, Drivers, Trends, Demand, Pricing Analysis, Competitive, Strategic Insights, Companies, Challenges
- Saudi Arabia Core Assurance Service Market (2025-2031) | Strategy, Consumer Insights, Analysis, Investment Trends, Opportunities, Growth, Size, Share, Industry, Revenue, Segments, Value, Segmentation, Supply, Forecast, Restraints, Outlook, Competition, Drivers, Trends, Demand, Pricing Analysis, Competitive, Strategic Insights, Companies, Challenges
- Romania Uninterruptible Power Supply (UPS) Market (2026-2032) | Industry, Analysis, Revenue, Size, Forecast, Outlook, Value, Trends, Share, Growth & Companies
- Saudi Arabia Car Window Tinting Film, Paint Protection Film (PPF), and Ceramic Coating Market (2025-2031) | Strategy, Consumer Insights, Analysis, Investment Trends, Opportunities, Growth, Size, Share, Industry, Revenue, Segments, Value, Segmentation, Supply, Forecast, Restraints, Outlook, Competition, Drivers, Trends, Demand, Pricing Analysis, Competitive, Strategic Insights, Companies, Challenges
Industry Events and Analyst Meet

India EV Show 2026

EV tech India Expo 2026

Auto Tech Asia 2026

Battery Tech India 2026

Smart Production Solutions Guangzhou 2026
Whitepaper
- Middle East & Africa Commercial Security Market Click here to view more.
- Middle East & Africa Fire Safety Systems & Equipment Market Click here to view more.
- GCC Drone Market Click here to view more.
- Middle East Lighting Fixture Market Click here to view more.
- GCC Physical & Perimeter Security Market Click here to view more.
6WResearch In News
- Doha a strategic location for EV manufacturing hub: IPA Qatar
- Demand for luxury TVs surging in the GCC, says Samsung
- Empowering Growth: The Thriving Journey of Bangladesh’s Cable Industry
- Demand for luxury TVs surging in the GCC, says Samsung
- Video call with a traditional healer? Once unthinkable, it’s now common in South Africa
- Intelligent Buildings To Smooth GCC’s Path To Net Zero