Romania Interactive Tables Market (2026-2032) Outlook | Value, Analysis, Companies, Trends, Growth, Industry, Forecast, Revenue, Share & Size
Market Forecast By Technology (LCD, LED, Capacitive, Others), By Screen Size (32-65 Inch, 65 Inch & Above), By Application (Exhibition & Trade Shows, Education, Retail, Control Room, Hospitality, Transportation, Others) And Competitive Landscape
| Product Code: ETC275058 | Publication Date: Aug 2022 | Updated Date: Jul 2026 | Product Type: Market Research Report | |
| Publisher: 6Wresearch | Author: Ravi Bhandari | No. of Pages: 75 | No. of Figures: 35 | No. of Tables: 20 |
Romania Interactive Tables Market Size, Share & Growth Rate
The Romania Interactive Tables Market was estimated at USD 434 Million in 2025 and is projected to reach USD 604 Million by 2032, growing at a CAGR of 4.8% from 2026 to 2032. This growth trajectory is propelled by the increasing adoption of interactive technologies across educational and corporate sectors, with a particular focus on enhancing collaborative environments. Furthermore, the rising trend of integrating touch-enabled solutions into public spaces, retail, and hospitality sectors bolsters demand, ensuring a robust market outlook.
Romania Interactive Tables Market Year-wise Growth Rate and Key Drivers
This graph highlights how the Romania Interactive Tables Market has steadily grown over the years, supported by major growth factors.
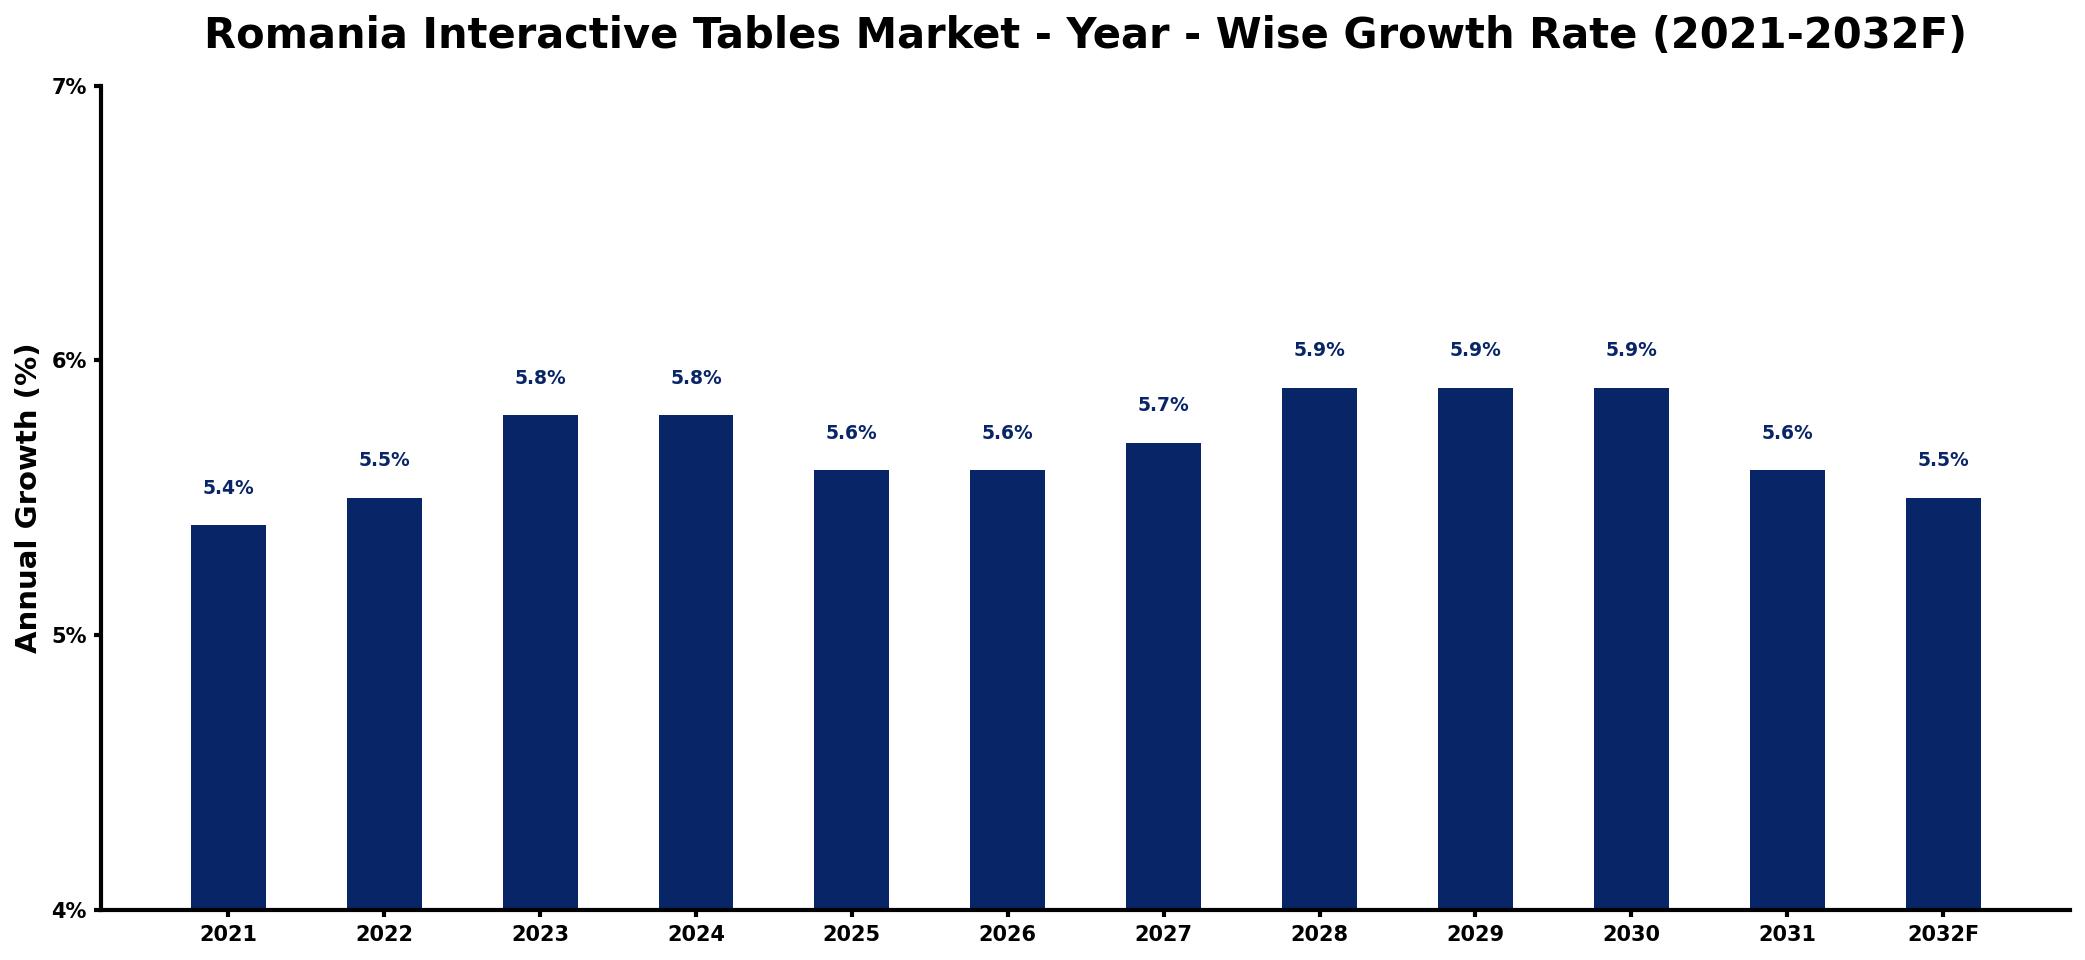
The table below presents the year‑wise growth rates along with the key drivers influencing the market
| Year | Growth Rate | Major Drivers |
| 2021 | 5.4% | increased demand for digital solutions |
| 2022 | 5.5% | growing interest in collaborative technologies |
| 2023 | 5.8% | expansion of smart office environments |
| 2024 | 5.8% | rising investments in education technology |
| 2025 | 5.6% | enhanced focus on remote engagement |
| 2026 | 5.6% | development of innovative user interfaces |
| 2027 | 5.7% | adoption of new business models |
| 2028 | 5.9% | emergence of hybrid workplace strategies |
| 2029 | 5.9% | growing downstream application demand |
| 2030 | 5.9% | increased use in training programs |
| 2031 | 5.6% | growing popularity in public spaces |
| 2032 | 5.5% | enhanced integration with IoT devices |
Note: Market size estimations and growth projections presented in this report are based on 6Wresearch's proprietary forecasting methodology, utilizing the latest available industry data, government publications, and primary research inputs.
Romania Interactive Tables Market Synopsis
In Romania, there is a notable surge in the use of touchscreen tables in both educational and corporate environments. Institutions are leveraging these technologies to foster collaborative learning, driving significant demand in the education sector.
Additionally, retail and hospitality venues are increasingly adopting interactive tables to enhance customer experiences. This trend reflects a broader movement towards integrating technology that promotes engagement and interactivity within various settings.
Romania Interactive Tables Market Key Takeaways
- The market is witnessing a transition towards advanced touchscreen technologies across various sectors.
- Demand for interactive tables is strong in educational institutions, boosting overall market growth.
- Retail and hospitality sectors are prominent users of interactive tables, enhancing customer engagement.
- Integration challenges persist, particularly regarding compatibility with existing systems.
- Advancements in technology are critical for sustaining growth and innovation in the market.
Evaluation of Restraints in Romania Interactive Tables Market
Despite a promising outlook, the Romania Interactive Tables Market faces significant restraints that can inhibit growth. High costs associated with advanced interactive table technologies present a barrier for many institutions and businesses. Furthermore, the need for continuous innovation to enhance functionality and user experience adds pressure on manufacturers to invest heavily in R&D. Compatibility issues with existing systems complicate the integration process, which can deter potential buyers. Additionally, a shortage of skilled professionals trained in the design, implementation, and maintenance of these systems further restricts market potential, creating an environment where many companies may hesitate to invest heavily.
Romania Interactive Tables Market Trends
Current trends indicate a strong shift towards more immersive and interactive technologies within educational and corporate environments. The rise of gamification in learning settings has made interactive tables a popular choice among educators looking to increase engagement. Moreover, the integration of augmented reality (AR) features into interactive tables is gaining traction, offering new possibilities for interactive experiences in retail and hospitality settings.
Romania Interactive Tables Market Opportunities
The market offers considerable growth and investment opportunities, particularly in the educational sector where institutions are increasingly prioritizing technology-enhanced learning environments. Additionally, the burgeoning tourism and hospitality industry presents a fertile ground for interactive table applications, from enhancing dining experiences to improving customer service interactions. Furthermore, as more businesses focus on remote work and collaborative tools, the demand for interactive tables in corporate settings will likely rise, encouraging investment in this technology.
Government Initiatives in the Romania Interactive Tables Market
Government policies are becoming increasingly favorable for the interactive tables market, with initiatives aimed at encouraging the adoption of technology in educational and collaborative settings. Programs that provide grants for institutions and businesses investing in interactive technologies are crucial in promoting market growth. Additionally, government support for digital transformation initiatives is likely to enhance the adoption of interactive tables across various sectors.
Future Insights of the Romania Interactive Tables Market
Looking ahead to 2026-2032, the Romania Interactive Tables Market is poised for significant evolution. As businesses and educational institutions continue to seek innovative ways to enhance engagement and collaboration, the market will benefit from technological advancements. The integration of artificial intelligence and machine learning capabilities into interactive tables will likely redefine user experience, paving the way for personalized and adaptive solutions. Furthermore, increasing competition among suppliers will drive prices down, making advanced technologies more accessible to a broader range of users.
Romania Interactive Tables Market Latest Developments (2025 - 2026)
The industry has seen recent advancements focusing on enhancing the user interface and experience of interactive tables. Companies are innovating with features that incorporate real-time data analytics and cloud integration to improve functionality. Additionally, there has been a notable increase in partnerships between technology providers and educational institutions, aimed at pilot programs that test and develop interactive table applications for classroom use. These developments signal a vibrant and evolving market landscape.
Romania Interactive Tables Market - Key Attractiveness of the Report
- 10 Years of Market Numbers
- Historical Data Starting from 2022 to 2025
- Base Year: 2025
- Forecast Data until 2032
- Key Performance Indicators Impacting the Market
- Major Upcoming Developments and Projects
Key Highlights of the Report:
- Romania Interactive Tables Market Outlook
- Market Size of Romania Interactive Tables Market, 2025
- Forecast of Romania Interactive Tables Market, 2032
- Historical Data and Forecast of Romania Interactive Tables Revenues & Volume for the Period 2022-2032F
- Romania Interactive Tables Market Trend Evolution
- Romania Interactive Tables Market Drivers and Challenges
- Romania Interactive Tables Price Trends
- Romania Interactive Tables Porter's Five Forces
- Romania Interactive Tables Industry Life Cycle
- Historical Data and Forecast of Romania Interactive Tables Market Revenues & Volume By Technology for the Period 2022-2032F
- Historical Data and Forecast of Romania Interactive Tables Market Revenues & Volume By LCD for the Period 2022-2032F
- Historical Data and Forecast of Romania Interactive Tables Market Revenues & Volume By LED for the Period 2022-2032F
- Historical Data and Forecast of Romania Interactive Tables Market Revenues & Volume By Capacitive for the Period 2022-2032F
- Historical Data and Forecast of Romania Interactive Tables Market Revenues & Volume By Others for the Period 2022-2032F
- Historical Data and Forecast of Romania Interactive Tables Market Revenues & Volume By Screen Size for the Period 2022-2032F
- Historical Data and Forecast of Romania Interactive Tables Market Revenues & Volume By 32-65 Inch for the Period 2022-2032F
- Historical Data and Forecast of Romania Interactive Tables Market Revenues & Volume By 65 Inch & Above for the Period 2022-2032F
- Historical Data and Forecast of Romania Interactive Tables Market Revenues & Volume By Application for the Period 2022-2032F
- Historical Data and Forecast of Romania Interactive Tables Market Revenues & Volume By Exhibition & Trade Shows for the Period 2022-2032F
- Historical Data and Forecast of Romania Interactive Tables Market Revenues & Volume By Education for the Period 2022-2032F
- Historical Data and Forecast of Romania Interactive Tables Market Revenues & Volume By Retail for the Period 2022-2032F
- Historical Data and Forecast of Romania Interactive Tables Market Revenues & Volume By Control Room for the Period 2022-2032F
- Historical Data and Forecast of Romania Interactive Tables Market Revenues & Volume By Hospitality for the Period 2022-2032F
- Historical Data and Forecast of Romania Interactive Tables Market Revenues & Volume By Transportation for the Period 2022-2032F
- Historical Data and Forecast of Romania Interactive Tables Market Revenues & Volume By Others for the Period 2022-2032F
- Romania Interactive Tables Import Export Trade Statistics
- Market Opportunity Assessment By Technology
- Market Opportunity Assessment By Screen Size
- Market Opportunity Assessment By Application
- Romania Interactive Tables Top Companies Market Share
- Romania Interactive Tables Competitive Benchmarking By Technical and Operational Parameters
- Romania Interactive Tables Company Profiles
- Romania Interactive Tables Key Strategic Recommendations
Frequently Asked Questions About the Market Study (FAQs):
The Romania Interactive Tables Market is projected to grow at a CAGR of 4.8% from 2026 to 2032, reaching USD 604 Million by 2032 from an estimated USD 434 Million in 2025.
The educational and corporate sectors are leading the adoption of interactive tables, driven by the need for collaborative tools that foster engagement and interactivity.
Advances in touchscreen and display technologies, as well as the integration of augmented reality and artificial intelligence, are shaping the future of interactive tables in Romania.
Government initiatives that promote digital transformation and provide funding for educational institutions investing in interactive technologies significantly support market growth.
High costs of technology, integration complexities, and a shortage of skilled professionals are primary challenges hindering market expansion.
Interactive tables in retail settings are being used to engage customers through gamified experiences and personalized service, transforming traditional shopping into an interactive journey.
6Wresearch actively monitors the Romania Interactive Tables Market and publishes its comprehensive annual report, highlighting emerging trends, growth drivers, revenue analysis, and forecast outlook. Our insights help businesses to make data-backed strategic decisions with ongoing market dynamics. Our analysts track relevent industries related to the Romania Interactive Tables Market, allowing our clients with actionable intelligence and reliable forecasts tailored to emerging regional needs.
Yes, we provide customisation as per your requirements. To learn more, feel free to contact us on sales@6wresearch.com
1 Executive Summary |
2 Introduction |
2.1 Key Highlights of the Report |
2.2 Report Description |
2.3 Market Scope & Segmentation |
2.4 Research Methodology |
2.5 Assumptions |
3 Romania Interactive Tables Market Overview |
3.1 Romania Country Macro Economic Indicators |
3.2 Romania Interactive Tables Market Revenues & Volume, 2022 & 2032F |
3.3 Romania Interactive Tables Market - Industry Life Cycle |
3.4 Romania Interactive Tables Market - Porter's Five Forces |
3.5 Romania Interactive Tables Market Revenues & Volume Share, By Technology, 2022 & 2032F |
3.6 Romania Interactive Tables Market Revenues & Volume Share, By Screen Size, 2022 & 2032F |
3.7 Romania Interactive Tables Market Revenues & Volume Share, By Application, 2022 & 2032F |
4 Romania Interactive Tables Market Dynamics |
4.1 Impact Analysis |
4.2 Market Drivers |
4.2.1 Increasing demand for interactive and engaging technology in educational institutions and corporate settings |
4.2.2 Growing trend of digitization and modernization across various industries in Romania |
4.2.3 Rise in adoption of interactive tables for enhancing customer experience in retail and hospitality sectors |
4.3 Market Restraints |
4.3.1 High initial investment and installation costs associated with interactive tables |
4.3.2 Limited awareness and understanding of the benefits of interactive tables among potential end-users in Romania |
4.3.3 Lack of skilled professionals to operate and maintain interactive table systems effectively |
5 Romania Interactive Tables Market Trends |
6 Romania Interactive Tables Market, By Types |
6.1 Romania Interactive Tables Market, By Technology |
6.1.1 Overview and Analysis |
6.1.2 Romania Interactive Tables Market Revenues & Volume, By Technology, 2022-2032F |
6.1.3 Romania Interactive Tables Market Revenues & Volume, By LCD, 2022-2032F |
6.1.4 Romania Interactive Tables Market Revenues & Volume, By LED, 2022-2032F |
6.1.5 Romania Interactive Tables Market Revenues & Volume, By Capacitive, 2022-2032F |
6.1.6 Romania Interactive Tables Market Revenues & Volume, By Others, 2022-2032F |
6.2 Romania Interactive Tables Market, By Screen Size |
6.2.1 Overview and Analysis |
6.2.2 Romania Interactive Tables Market Revenues & Volume, By 32-65 Inch, 2022-2032F |
6.2.3 Romania Interactive Tables Market Revenues & Volume, By 65 Inch & Above, 2022-2032F |
6.3 Romania Interactive Tables Market, By Application |
6.3.1 Overview and Analysis |
6.3.2 Romania Interactive Tables Market Revenues & Volume, By Exhibition & Trade Shows, 2022-2032F |
6.3.3 Romania Interactive Tables Market Revenues & Volume, By Education, 2022-2032F |
6.3.4 Romania Interactive Tables Market Revenues & Volume, By Retail, 2022-2032F |
6.3.5 Romania Interactive Tables Market Revenues & Volume, By Control Room, 2022-2032F |
6.3.6 Romania Interactive Tables Market Revenues & Volume, By Hospitality, 2022-2032F |
6.3.7 Romania Interactive Tables Market Revenues & Volume, By Transportation, 2022-2032F |
7 Romania Interactive Tables Market Import-Export Trade Statistics |
7.1 Romania Interactive Tables Market Export to Major Countries |
7.2 Romania Interactive Tables Market Imports from Major Countries |
8 Romania Interactive Tables Market Key Performance Indicators |
8.1 Average session duration on interactive tables |
8.2 Frequency of software updates and new feature releases |
8.3 Rate of return customers who have engaged with interactive tables |
9 Romania Interactive Tables Market - Opportunity Assessment |
9.1 Romania Interactive Tables Market Opportunity Assessment, By Technology, 2022 & 2032F |
9.2 Romania Interactive Tables Market Opportunity Assessment, By Screen Size, 2022 & 2032F |
9.3 Romania Interactive Tables Market Opportunity Assessment, By Application, 2022 & 2032F |
10 Romania Interactive Tables Market - Competitive Landscape |
10.1 Romania Interactive Tables Market Revenue Share, By Companies, 2025 |
10.2 Romania Interactive Tables Market Competitive Benchmarking, By Operating and Technical Parameters |
11 Company Profiles |
12 Recommendations |
13 Disclaimer |
Global Go To Market Strategy - 2030
Export potential enables firms to identify high-growth global markets with greater confidence by combining advanced trade intelligence with a structured quantitative methodology. The framework analyzes emerging demand trends and country-level import patterns while integrating macroeconomic and trade datasets such as GDP and population forecasts, bilateral import–export flows, tariff structures, elasticity differentials between developed and developing economies, geographic distance, and import demand projections. Using weighted trade values from 2020–2024 as the base period to project country-to-country export potential for 2030, these inputs are operationalized through calculated drivers such as gravity model parameters, tariff impact factors, and projected GDP per-capita growth. Through an analysis of hidden potentials, demand hotspots, and market conditions that are most favorable to success, this method enables firms to focus on target countries, maximize returns, and global expansion with data, backed by accuracy.
By factoring in the projected importer demand gap that is currently unmet and could be potential opportunity, it identifies the potential for the Exporter (Country) among 190 countries, against the general trade analysis, which identifies the biggest importer or exporter.
To discover high-growth global markets and optimize your business strategy:
Click Here
Pricing
- Single User License$ 1,995
- Department License$ 2,400
- Site License$ 3,120
- Global License$ 3,795

Leadership Perspectives from Industry Events
Search
Thought Leadership and Analyst Meet


Our Clients
6WResearch In News
- India Air Conditioner Market Set for Strong Rebound in 2026 After Weather-Led Correction and GST-Driven Recovery: 6Wresearch
- ADAS in India: How Automatic Emergency Braking, Blind Spot Detection & Driver Monitoring are Transforming Road Safety
- Doha a strategic location for EV manufacturing hub: IPA Qatar
- Demand for luxury TVs surging in the GCC, says Samsung
- Empowering Growth: The Thriving Journey of Bangladesh’s Cable Industry
- Demand for luxury TVs surging in the GCC, says Samsung
Latest Reports
- Nicaragua RPG Gaming Market (2026-2032)
- New Zealand RPG Gaming Market (2026-2032)
- Netherlands RPG Gaming Market (2026-2032)
- Nauru RPG Gaming Market (2026-2032)
- Namibia RPG Gaming Market (2026-2032)
- Mozambique RPG Gaming Market (2026-2032)
- Montenegro RPG Gaming Market (2026-2032)
- Mongolia RPG Gaming Market (2026-2032)
- Monaco RPG Gaming Market (2026-2032)
- Micronesia RPG Gaming Market (2026-2032)
Industry Events and Analyst Meet

EV India Expo 2026

HIMTEX 2026

India Refining Summit 2026

India EV Show 2026

EV tech India Expo 2026
Whitepaper
- Middle East & Africa Commercial Security Market Click here to view more.
- Middle East & Africa Fire Safety Systems & Equipment Market Click here to view more.
- GCC Drone Market Click here to view more.
- Middle East Lighting Fixture Market Click here to view more.
- GCC Physical & Perimeter Security Market Click here to view more.