Romania Inventory Tags Market (2026-2032) Outlook | Trends, Share, Industry, Size, Growth, Analysis, Value, Companies, Forecast, Revenue
Market Forecast By Technology (Barcodes, RFID), By Label Type (Plastic, Paper, Metal), By Printing technology (Digital Printing, Flexography, Lithography, Screen Printing, Gravure, Others) And Competitive Landscape
| Product Code: ETC4601299 | Publication Date: Jul 2023 | Updated Date: Mar 2026 | Product Type: Report | |
| Publisher: 6Wresearch | Author: Summon Dutta | No. of Pages: 85 | No. of Figures: 45 | No. of Tables: 25 |
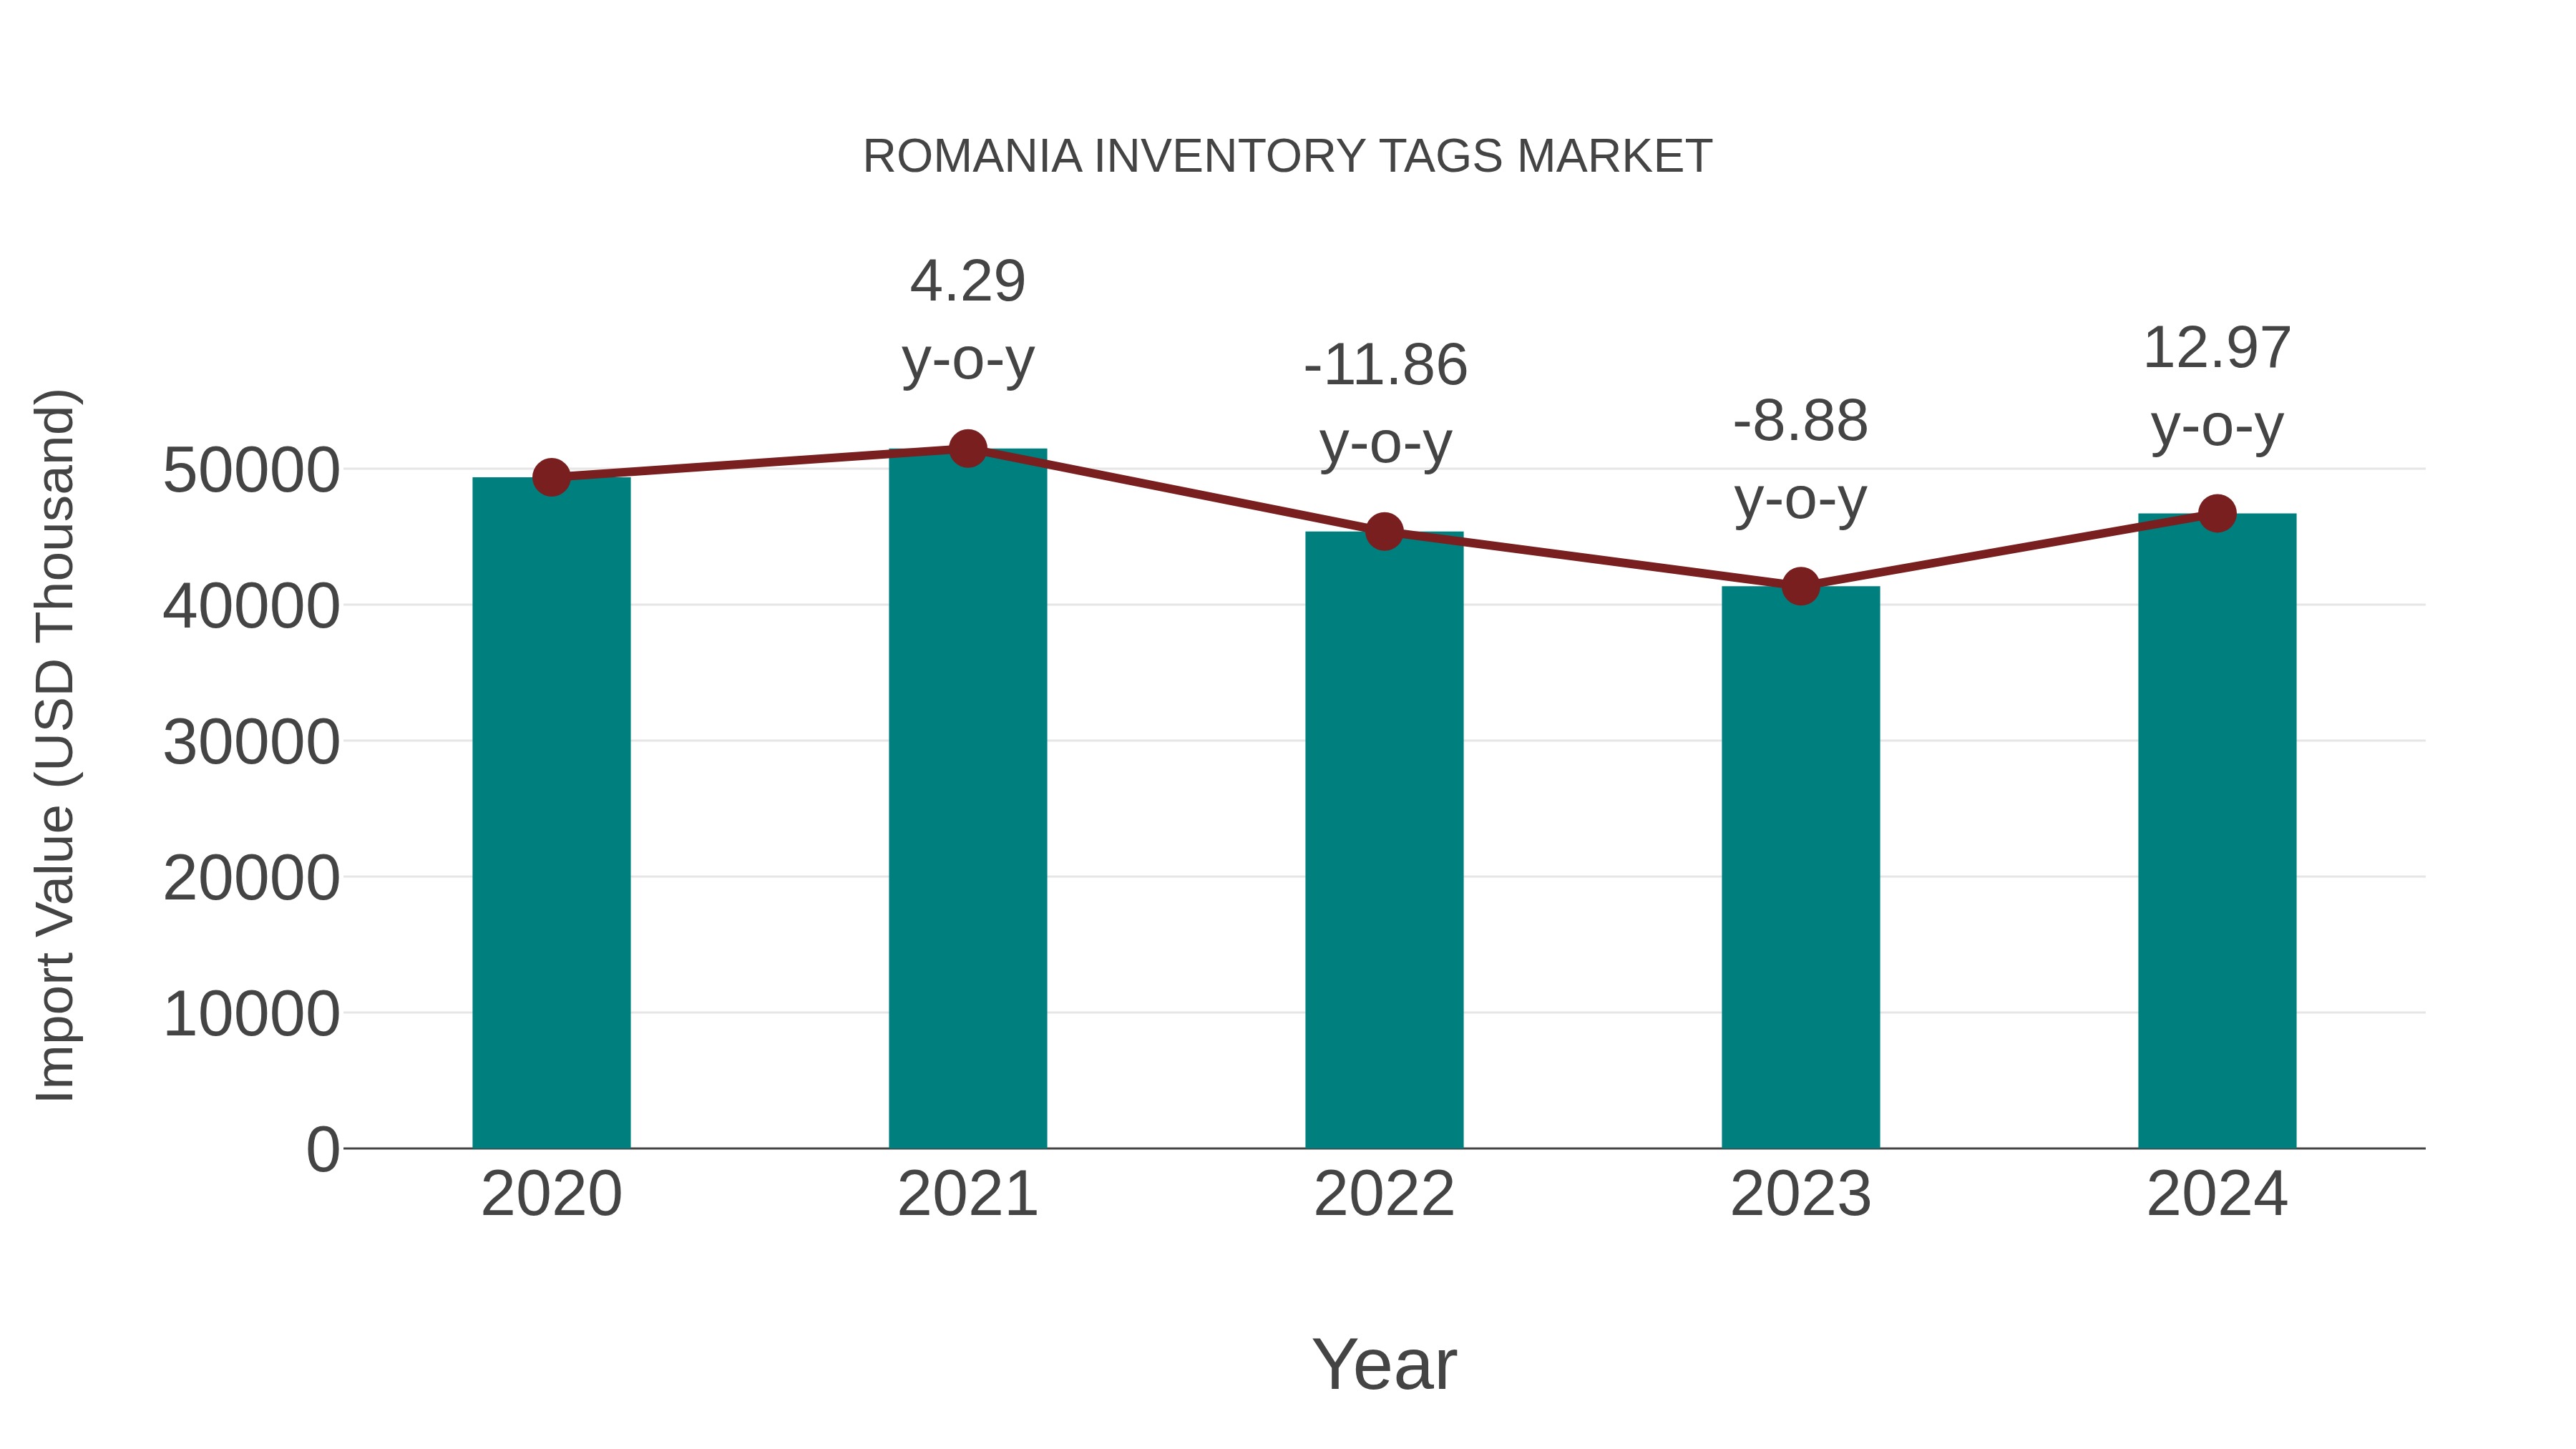
Romania Inventory Tags Market: Import Trend Analysis
In the Romania inventory tags market, the import trend showed a growth rate of 12.97% from 2023 to 2024, contrasting with a compound annual growth rate (CAGR) of -1.37% from 2020 to 2024. This shift could be attributed to increased demand for inventory management solutions or alterations in trade policies impacting imports.
Romania Inventory Tags Market Overview
The inventory tags market in Romania supports logistics and retail sectors with RFID and barcode technologies for inventory management and supply chain visibility. Adoption of real-time tracking solutions is enhancing operational efficiency.
Drivers of the market
The inventory tags market in Romania is driven by the need for efficient inventory management and tracking solutions across various industries. The increasing adoption of barcode and RFID technologies supports market growth. Additionally, the demand for real-time visibility and accuracy in supply chain operations enhances market prospects.
Challenges of the market
The inventory tags market in Romania faces challenges related to the high cost of advanced tag technologies and the need for continuous innovation to improve functionality and reliability. Ensuring compatibility with existing inventory management systems and integrating advanced features can be complex and costly. Additionally, there is a shortage of skilled professionals capable of designing, implementing, and maintaining these inventory tags effectively. The market also faces competition from international suppliers offering advanced and cost-effective inventory tag solutions.
Government Policy of the market
To support the inventory tags market, the government can promote the adoption of advanced inventory management systems, providing subsidies for companies implementing smart tagging solutions to improve inventory tracking and management.
Key Highlights of the Report:
- Romania Inventory Tags Market Outlook
- Market Size of Romania Inventory Tags Market, 2025
- Forecast of Romania Inventory Tags Market, 2032
- Historical Data and Forecast of Romania Inventory Tags Revenues & Volume for the Period 2022-2032F
- Romania Inventory Tags Market Trend Evolution
- Romania Inventory Tags Market Drivers and Challenges
- Romania Inventory Tags Price Trends
- Romania Inventory Tags Porter's Five Forces
- Romania Inventory Tags Industry Life Cycle
- Historical Data and Forecast of Romania Inventory Tags Market Revenues & Volume By Technology for the Period 2022-2032F
- Historical Data and Forecast of Romania Inventory Tags Market Revenues & Volume By Barcodes for the Period 2022-2032F
- Historical Data and Forecast of Romania Inventory Tags Market Revenues & Volume By RFID for the Period 2022-2032F
- Historical Data and Forecast of Romania Inventory Tags Market Revenues & Volume By Label Type for the Period 2022-2032F
- Historical Data and Forecast of Romania Inventory Tags Market Revenues & Volume By Plastic for the Period 2022-2032F
- Historical Data and Forecast of Romania Inventory Tags Market Revenues & Volume By Paper for the Period 2022-2032F
- Historical Data and Forecast of Romania Inventory Tags Market Revenues & Volume By Metal for the Period 2022-2032F
- Historical Data and Forecast of Romania Inventory Tags Market Revenues & Volume By Printing technology for the Period 2022-2032F
- Historical Data and Forecast of Romania Inventory Tags Market Revenues & Volume By Digital Printing for the Period 2022-2032F
- Historical Data and Forecast of Romania Inventory Tags Market Revenues & Volume By Flexography for the Period 2022-2032F
- Historical Data and Forecast of Romania Inventory Tags Market Revenues & Volume By Lithography for the Period 2022-2032F
- Historical Data and Forecast of Romania Inventory Tags Market Revenues & Volume By Screen Printing for the Period 2022-2032F
- Historical Data and Forecast of Romania Inventory Tags Market Revenues & Volume By Gravure for the Period 2022-2032F
- Historical Data and Forecast of Romania Inventory Tags Market Revenues & Volume By Others for the Period 2022-2032F
- Romania Inventory Tags Import Export Trade Statistics
- Market Opportunity Assessment By Technology
- Market Opportunity Assessment By Label Type
- Market Opportunity Assessment By Printing technology
- Romania Inventory Tags Top Companies Market Share
- Romania Inventory Tags Competitive Benchmarking By Technical and Operational Parameters
- Romania Inventory Tags Company Profiles
- Romania Inventory Tags Key Strategic Recommendations
Romania Inventory Tags Market (2026-2032): FAQs
The increasing adoption of RFID technology by major retailers such as Carrefour and Lidl in Romania is a significant factor driving the growth of the inventory tags market.
The Romania inventory tags market is seeing a shift towards RFID technology, with companies like Datalogic and Zebra Technologies introducing advanced RFID tags that offer real-time tracking and inventory management capabilities.
The Romania inventory tags market encompasses a wide range of products used for tracking and managing inventory within various industries such as retail, healthcare, manufacturing, and logistics. Companies like Zebra Technologies, Avery Dennison, and SATO offer RFID tags, barcode labels, and other tracking solutions to help businesses improve supply chain efficiency and inventory management.
Key competitors in the Romania inventory tags market include companies like Zebra Technologies, Avery Dennison, and Honeywell. Zebra Technologies is known for its innovative RFID solutions, while Avery Dennison focuses on providing high-quality barcode labels. Honeywell, on the other hand, offers a wide range of RFID and barcode scanning devices tailored for various industries. Each of these competitors has a strong market presence and unique positioning strategies in the Romania inventory tags market.
New businesses in the Romania inventory tags market have the opportunity to cater to the growing demand for advanced RFID solutions. Companies like Datamars and Zebra Technologies have successfully introduced innovative RFID tags for inventory management, creating a niche for high-quality, efficient tracking systems in industries such as retail, logistics, and healthcare. By focusing on developing cost-effective RFID solutions tailored to local market needs, new entrants can capitalize on the increasing adoption of smart inventory management technologies in Romania.
6Wresearch actively monitors the Romania Inventory Tags Market and publishes its comprehensive annual report, highlighting emerging trends, growth drivers, revenue analysis, and forecast outlook. Our insights help businesses to make data-backed strategic decisions with ongoing market dynamics. Our analysts track relevent industries related to the Romania Inventory Tags Market, allowing our clients with actionable intelligence and reliable forecasts tailored to emerging regional needs.
Yes, we provide customisation as per your requirements. To learn more, feel free to contact us on sales@6wresearch.com
1 Executive Summary |
2 Introduction |
2.1 Key Highlights of the Report |
2.2 Report Description |
2.3 Market Scope & Segmentation |
2.4 Research Methodology |
2.5 Assumptions |
3 Romania Inventory Tags Market Overview |
3.1 Romania Country Macro Economic Indicators |
3.2 Romania Inventory Tags Market Revenues & Volume, 2022 & 2032F |
3.3 Romania Inventory Tags Market - Industry Life Cycle |
3.4 Romania Inventory Tags Market - Porter's Five Forces |
3.5 Romania Inventory Tags Market Revenues & Volume Share, By Technology, 2022 & 2032F |
3.6 Romania Inventory Tags Market Revenues & Volume Share, By Label Type, 2022 & 2032F |
3.7 Romania Inventory Tags Market Revenues & Volume Share, By Printing technology, 2022 & 2032F |
4 Romania Inventory Tags Market Dynamics |
4.1 Impact Analysis |
4.2 Market Drivers |
4.2.1 Increasing adoption of inventory management systems in various industries in Romania |
4.2.2 Government regulations mandating the use of inventory tags for tracking and traceability purposes |
4.2.3 Growing focus on improving operational efficiency and reducing inventory holding costs |
4.3 Market Restraints |
4.3.1 High initial investment required for implementing inventory tagging systems |
4.3.2 Lack of awareness and understanding about the benefits of inventory tagging solutions |
4.3.3 Security and privacy concerns related to the data stored on inventory tags |
5 Romania Inventory Tags Market Trends |
6 Romania Inventory Tags Market, By Types |
6.1 Romania Inventory Tags Market, By Technology |
6.1.1 Overview and Analysis |
6.1.2 Romania Inventory Tags Market Revenues & Volume, By Technology, 2022-2032F |
6.1.3 Romania Inventory Tags Market Revenues & Volume, By Barcodes, 2022-2032F |
6.1.4 Romania Inventory Tags Market Revenues & Volume, By RFID, 2022-2032F |
6.2 Romania Inventory Tags Market, By Label Type |
6.2.1 Overview and Analysis |
6.2.2 Romania Inventory Tags Market Revenues & Volume, By Plastic, 2022-2032F |
6.2.3 Romania Inventory Tags Market Revenues & Volume, By Paper, 2022-2032F |
6.2.4 Romania Inventory Tags Market Revenues & Volume, By Metal, 2022-2032F |
6.3 Romania Inventory Tags Market, By Printing technology |
6.3.1 Overview and Analysis |
6.3.2 Romania Inventory Tags Market Revenues & Volume, By Digital Printing, 2022-2032F |
6.3.3 Romania Inventory Tags Market Revenues & Volume, By Flexography, 2022-2032F |
6.3.4 Romania Inventory Tags Market Revenues & Volume, By Lithography, 2022-2032F |
6.3.5 Romania Inventory Tags Market Revenues & Volume, By Screen Printing, 2022-2032F |
6.3.6 Romania Inventory Tags Market Revenues & Volume, By Gravure, 2022-2032F |
6.3.7 Romania Inventory Tags Market Revenues & Volume, By Others, 2022-2032F |
7 Romania Inventory Tags Market Import-Export Trade Statistics |
7.1 Romania Inventory Tags Market Export to Major Countries |
7.2 Romania Inventory Tags Market Imports from Major Countries |
8 Romania Inventory Tags Market Key Performance Indicators |
8.1 Average time saved per inventory transaction through the use of inventory tags |
8.2 Percentage reduction in inventory holding costs after implementing inventory tagging systems |
8.3 Increase in inventory accuracy rates achieved with the adoption of inventory tags and management systems |
9 Romania Inventory Tags Market - Opportunity Assessment |
9.1 Romania Inventory Tags Market Opportunity Assessment, By Technology, 2022 & 2032F |
9.2 Romania Inventory Tags Market Opportunity Assessment, By Label Type, 2022 & 2032F |
9.3 Romania Inventory Tags Market Opportunity Assessment, By Printing technology, 2022 & 2032F |
10 Romania Inventory Tags Market - Competitive Landscape |
10.1 Romania Inventory Tags Market Revenue Share, By Companies, 2025 |
10.2 Romania Inventory Tags Market Competitive Benchmarking, By Operating and Technical Parameters |
11 Company Profiles |
12 Recommendations |
13 Disclaimer |
Global Go To Market Strategy - 2030
Export potential enables firms to identify high-growth global markets with greater confidence by combining advanced trade intelligence with a structured quantitative methodology. The framework analyzes emerging demand trends and country-level import patterns while integrating macroeconomic and trade datasets such as GDP and population forecasts, bilateral import–export flows, tariff structures, elasticity differentials between developed and developing economies, geographic distance, and import demand projections. Using weighted trade values from 2020–2024 as the base period to project country-to-country export potential for 2030, these inputs are operationalized through calculated drivers such as gravity model parameters, tariff impact factors, and projected GDP per-capita growth. Through an analysis of hidden potentials, demand hotspots, and market conditions that are most favorable to success, this method enables firms to focus on target countries, maximize returns, and global expansion with data, backed by accuracy.
By factoring in the projected importer demand gap that is currently unmet and could be potential opportunity, it identifies the potential for the Exporter (Country) among 190 countries, against the general trade analysis, which identifies the biggest importer or exporter.
To discover high-growth global markets and optimize your business strategy:
Click Here
Pricing
- Single User License$ 1,995
- Department License$ 2,400
- Site License$ 3,120
- Global License$ 3,795

Leadership Perspectives from Industry Events
Search
Thought Leadership and Analyst Meet


Our Clients
6WResearch In News
- India Export Attractiveness Tracker 2026
- India Air Conditioner Market Set for Strong Rebound in 2026 After Weather-Led Correction and GST-Driven Recovery: 6Wresearch
- ADAS in India: How Automatic Emergency Braking, Blind Spot Detection & Driver Monitoring are Transforming Road Safety
- Doha a strategic location for EV manufacturing hub: IPA Qatar
- Demand for luxury TVs surging in the GCC, says Samsung
- Empowering Growth: The Thriving Journey of Bangladesh’s Cable Industry
Latest Reports
- Nicaragua RPG Gaming Market (2026-2032)
- New Zealand RPG Gaming Market (2026-2032)
- Netherlands RPG Gaming Market (2026-2032)
- Nauru RPG Gaming Market (2026-2032)
- Namibia RPG Gaming Market (2026-2032)
- Mozambique RPG Gaming Market (2026-2032)
- Montenegro RPG Gaming Market (2026-2032)
- Mongolia RPG Gaming Market (2026-2032)
- Monaco RPG Gaming Market (2026-2032)
- Micronesia RPG Gaming Market (2026-2032)
Industry Events and Analyst Meet

EV India Expo 2026

HIMTEX 2026

India Refining Summit 2026

India EV Show 2026

EV tech India Expo 2026
Whitepaper
- Middle East & Africa Commercial Security Market Click here to view more.
- Middle East & Africa Fire Safety Systems & Equipment Market Click here to view more.
- GCC Drone Market Click here to view more.
- Middle East Lighting Fixture Market Click here to view more.
- GCC Physical & Perimeter Security Market Click here to view more.