Romania Polyols Market (2026-2032) Outlook | Revenue, Growth, Industry, Share, Forecast, Trends, Analysis, Companies, Value & Size
Market Forecast By Type (Polyether polyols , Polyester polyols), By Application (Flexible Polyurethane Foam, Rigid Polyurethane Foam, CASE), By End Use Industry (Building & Construction, Automotive, Electronics) And Competitive Landscape
| Product Code: ETC4503079 | Publication Date: Jul 2023 | Updated Date: Mar 2026 | Product Type: Report | |
| Publisher: 6Wresearch | Author: Dhaval Chaurasia | No. of Pages: 85 | No. of Figures: 45 | No. of Tables: 25 |
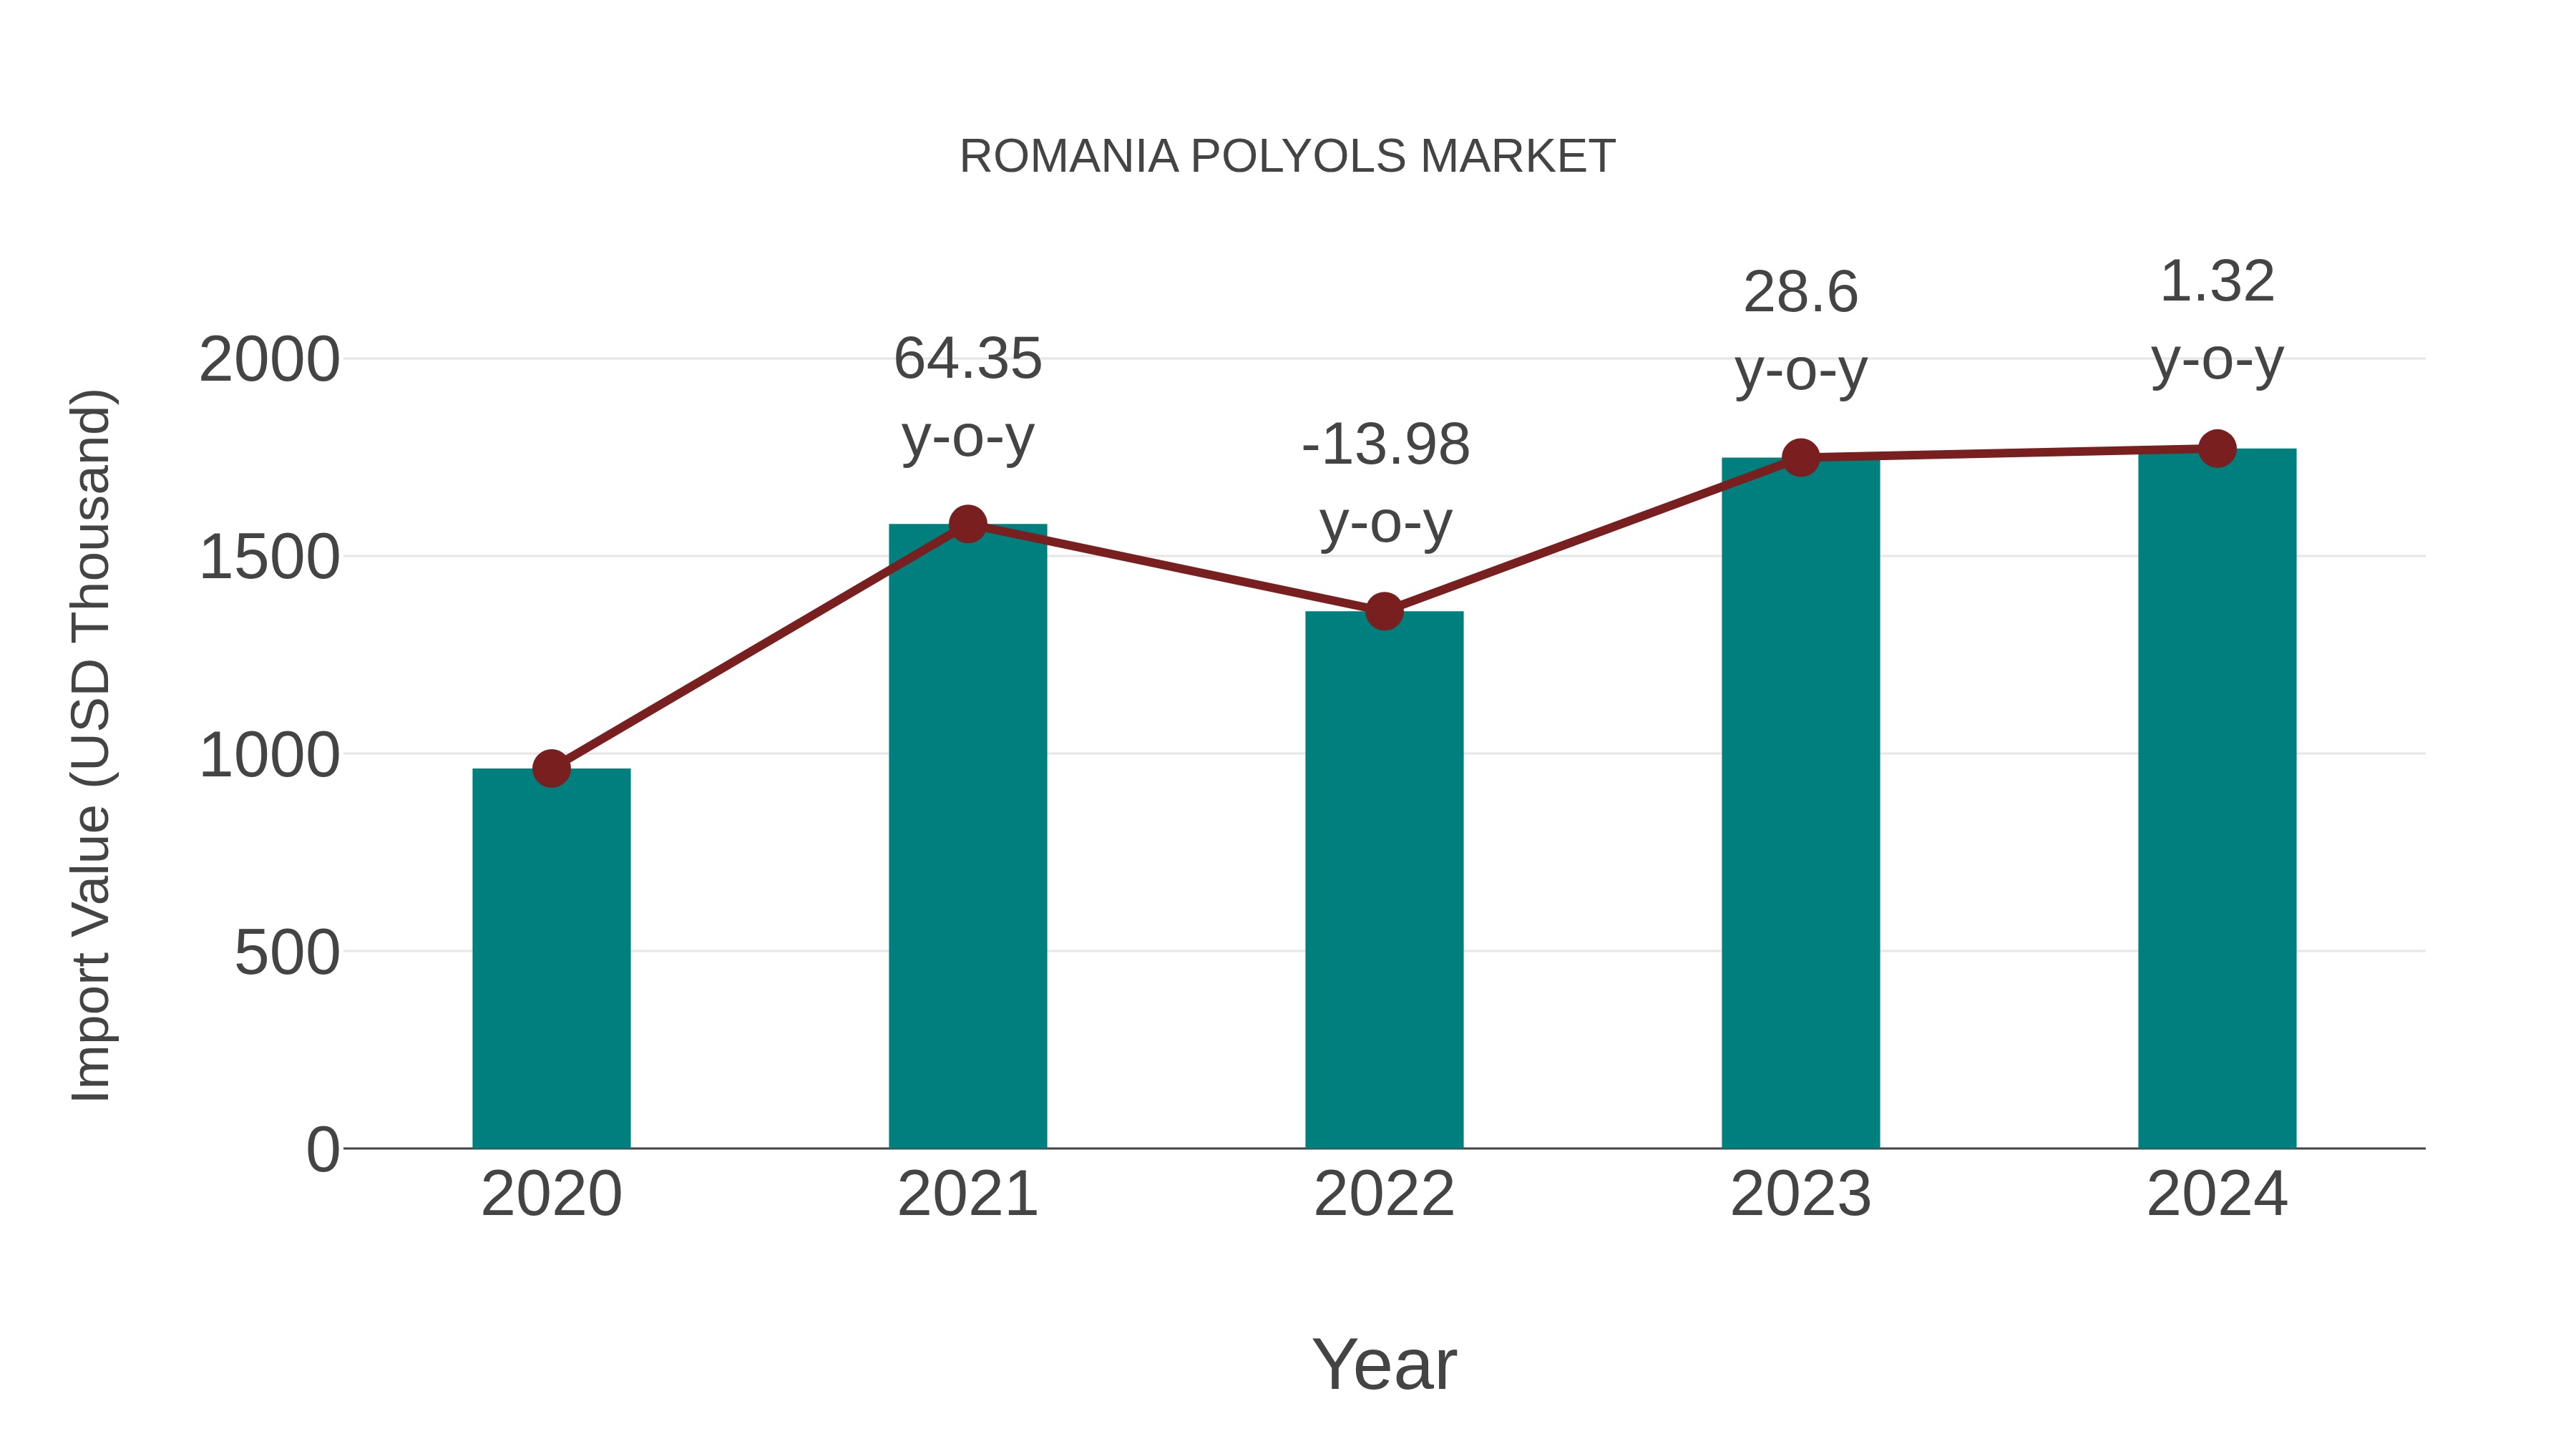
Romania Polyols Market: Import Trend Analysis
In the Romania polyols market, the import trend showed a growth rate of 1.32% from 2023 to 2024, with a compound annual growth rate (CAGR) of 16.5% from 2020 to 2024. This upward import momentum can be attributed to the increasing demand for polyols in various industries, indicating market stability and sustained growth potential.
Romania Polyols Market Overview
The polyols market in Romania is witnessing a surge, primarily fueled by the construction and automotive industries. Polyols are key components in the production of polyurethanes, which are widely used for insulation and in flexible foam products. The market growth is supported by the rising demand for energy-efficient buildings and automotive components that require high-performance materials.
Drivers of the market
The polyols market in Romania is driven by its applications in polyurethane foams, coatings, adhesives, and elastomers. Growth in construction and automotive sectors, coupled with increasing demand for energy-efficient insulation materials and eco-friendly products, fuels market expansion.
Challenges of the market
Balancing feedstock availability with production capacity and addressing quality consistency pose challenges in the Romania polyols market. Developing bio-based polyols and meeting stringent performance requirements for polyurethane foams and coatings are critical for market acceptance.
Government Policy of the market
The Romanian government regulates the polyols market to ensure product safety, chemical compatibility, and environmental compliance. Policies include polyol formulation standards, industrial hygiene guidelines, and support for eco-friendly polyol production methods.
Key Highlights of the Report:
- Romania Polyols Market Outlook
- Market Size of Romania Polyols Market, 2025
- Forecast of Romania Polyols Market, 2032
- Historical Data and Forecast of Romania Polyols Revenues & Volume for the Period 2022-2032F
- Romania Polyols Market Trend Evolution
- Romania Polyols Market Drivers and Challenges
- Romania Polyols Price Trends
- Romania Polyols Porter's Five Forces
- Romania Polyols Industry Life Cycle
- Historical Data and Forecast of Romania Polyols Market Revenues & Volume By Type for the Period 2022-2032F
- Historical Data and Forecast of Romania Polyols Market Revenues & Volume By Polyether polyols for the Period 2022-2032F
- Historical Data and Forecast of Romania Polyols Market Revenues & Volume By Polyester polyols for the Period 2022-2032F
- Historical Data and Forecast of Romania Polyols Market Revenues & Volume By Application for the Period 2022-2032F
- Historical Data and Forecast of Romania Polyols Market Revenues & Volume By Flexible Polyurethane Foam for the Period 2022-2032F
- Historical Data and Forecast of Romania Polyols Market Revenues & Volume By Rigid Polyurethane Foam for the Period 2022-2032F
- Historical Data and Forecast of Romania Polyols Market Revenues & Volume By CASE for the Period 2022-2032F
- Historical Data and Forecast of Romania Polyols Market Revenues & Volume By End Use Industry for the Period 2022-2032F
- Historical Data and Forecast of Romania Polyols Market Revenues & Volume By Building & Construction for the Period 2022-2032F
- Historical Data and Forecast of Romania Polyols Market Revenues & Volume By Automotive for the Period 2022-2032F
- Historical Data and Forecast of Romania Polyols Market Revenues & Volume By Electronics for the Period 2022-2032F
- Romania Polyols Import Export Trade Statistics
- Market Opportunity Assessment By Type
- Market Opportunity Assessment By Application
- Market Opportunity Assessment By End Use Industry
- Romania Polyols Top Companies Market Share
- Romania Polyols Competitive Benchmarking By Technical and Operational Parameters
- Romania Polyols Company Profiles
- Romania Polyols Key Strategic Recommendations
Romania Polyols Market (2026-2032): FAQs
6Wresearch actively monitors the Romania Polyols Market and publishes its comprehensive annual report, highlighting emerging trends, growth drivers, revenue analysis, and forecast outlook. Our insights help businesses to make data-backed strategic decisions with ongoing market dynamics. Our analysts track relevent industries related to the Romania Polyols Market, allowing our clients with actionable intelligence and reliable forecasts tailored to emerging regional needs.
Yes, we provide customisation as per your requirements. To learn more, feel free to contact us on sales@6wresearch.com
1 Executive Summary |
2 Introduction |
2.1 Key Highlights of the Report |
2.2 Report Description |
2.3 Market Scope & Segmentation |
2.4 Research Methodology |
2.5 Assumptions |
3 Romania Polyols Market Overview |
3.1 Romania Country Macro Economic Indicators |
3.2 Romania Polyols Market Revenues & Volume, 2022 & 2032F |
3.3 Romania Polyols Market - Industry Life Cycle |
3.4 Romania Polyols Market - Porter's Five Forces |
3.5 Romania Polyols Market Revenues & Volume Share, By Type, 2022 & 2032F |
3.6 Romania Polyols Market Revenues & Volume Share, By Application, 2022 & 2032F |
3.7 Romania Polyols Market Revenues & Volume Share, By End Use Industry, 2022 & 2032F |
4 Romania Polyols Market Dynamics |
4.1 Impact Analysis |
4.2 Market Drivers |
4.2.1 Increasing demand from end-use industries such as construction, automotive, and furniture due to economic growth and rising disposable income in Romania. |
4.2.2 Growing awareness about the benefits of using polyols in various applications, including reducing greenhouse gas emissions and enhancing product performance. |
4.2.3 Favorable government regulations promoting the use of sustainable and eco-friendly materials like polyols in manufacturing processes. |
4.3 Market Restraints |
4.3.1 Fluctuating prices of raw materials used in polyols production, such as crude oil and petrochemicals, impacting the overall cost of production and pricing strategies. |
4.3.2 Intense competition from alternative materials or substitutes that may offer similar properties as polyols but at a lower cost or with different environmental profiles. |
5 Romania Polyols Market Trends |
6 Romania Polyols Market, By Types |
6.1 Romania Polyols Market, By Type |
6.1.1 Overview and Analysis |
6.1.2 Romania Polyols Market Revenues & Volume, By Type, 2022-2032F |
6.1.3 Romania Polyols Market Revenues & Volume, By Polyether polyols , 2022-2032F |
6.1.4 Romania Polyols Market Revenues & Volume, By Polyester polyols, 2022-2032F |
6.2 Romania Polyols Market, By Application |
6.2.1 Overview and Analysis |
6.2.2 Romania Polyols Market Revenues & Volume, By Flexible Polyurethane Foam, 2022-2032F |
6.2.3 Romania Polyols Market Revenues & Volume, By Rigid Polyurethane Foam, 2022-2032F |
6.2.4 Romania Polyols Market Revenues & Volume, By CASE, 2022-2032F |
6.3 Romania Polyols Market, By End Use Industry |
6.3.1 Overview and Analysis |
6.3.2 Romania Polyols Market Revenues & Volume, By Building & Construction, 2022-2032F |
6.3.3 Romania Polyols Market Revenues & Volume, By Automotive, 2022-2032F |
6.3.4 Romania Polyols Market Revenues & Volume, By Electronics, 2022-2032F |
7 Romania Polyols Market Import-Export Trade Statistics |
7.1 Romania Polyols Market Export to Major Countries |
7.2 Romania Polyols Market Imports from Major Countries |
8 Romania Polyols Market Key Performance Indicators |
8.1 Adoption rate of polyols in key industries in Romania, indicating the level of acceptance and integration of polyols in manufacturing processes. |
8.2 Investment in research and development (RD) for new polyol formulations and applications, reflecting the industry's innovation and growth potential. |
8.3 Environmental impact metrics, such as carbon footprint reduction or waste minimization achieved through the use of polyols, showcasing the sustainability aspect of the market. |
9 Romania Polyols Market - Opportunity Assessment |
9.1 Romania Polyols Market Opportunity Assessment, By Type, 2022 & 2032F |
9.2 Romania Polyols Market Opportunity Assessment, By Application, 2022 & 2032F |
9.3 Romania Polyols Market Opportunity Assessment, By End Use Industry, 2022 & 2032F |
10 Romania Polyols Market - Competitive Landscape |
10.1 Romania Polyols Market Revenue Share, By Companies, 2025 |
10.2 Romania Polyols Market Competitive Benchmarking, By Operating and Technical Parameters |
11 Company Profiles |
12 Recommendations |
13 Disclaimer |
Global Go To Market Strategy - 2030
Export potential enables firms to identify high-growth global markets with greater confidence by combining advanced trade intelligence with a structured quantitative methodology. The framework analyzes emerging demand trends and country-level import patterns while integrating macroeconomic and trade datasets such as GDP and population forecasts, bilateral import–export flows, tariff structures, elasticity differentials between developed and developing economies, geographic distance, and import demand projections. Using weighted trade values from 2020–2024 as the base period to project country-to-country export potential for 2030, these inputs are operationalized through calculated drivers such as gravity model parameters, tariff impact factors, and projected GDP per-capita growth. Through an analysis of hidden potentials, demand hotspots, and market conditions that are most favorable to success, this method enables firms to focus on target countries, maximize returns, and global expansion with data, backed by accuracy.
By factoring in the projected importer demand gap that is currently unmet and could be potential opportunity, it identifies the potential for the Exporter (Country) among 190 countries, against the general trade analysis, which identifies the biggest importer or exporter.
To discover high-growth global markets and optimize your business strategy:
Click Here
Pricing
- Single User License$ 1,995
- Department License$ 2,400
- Site License$ 3,120
- Global License$ 3,795

Leadership Perspectives from Industry Events
Search
Thought Leadership and Analyst Meet


Our Clients
6WResearch In News
- India Export Attractiveness Tracker 2026
- India Air Conditioner Market Set for Strong Rebound in 2026 After Weather-Led Correction and GST-Driven Recovery: 6Wresearch
- ADAS in India: How Automatic Emergency Braking, Blind Spot Detection & Driver Monitoring are Transforming Road Safety
- Doha a strategic location for EV manufacturing hub: IPA Qatar
- Demand for luxury TVs surging in the GCC, says Samsung
- Empowering Growth: The Thriving Journey of Bangladesh’s Cable Industry
Latest Reports
- Nicaragua RPG Gaming Market (2026-2032)
- New Zealand RPG Gaming Market (2026-2032)
- Netherlands RPG Gaming Market (2026-2032)
- Nauru RPG Gaming Market (2026-2032)
- Namibia RPG Gaming Market (2026-2032)
- Mozambique RPG Gaming Market (2026-2032)
- Montenegro RPG Gaming Market (2026-2032)
- Mongolia RPG Gaming Market (2026-2032)
- Monaco RPG Gaming Market (2026-2032)
- Micronesia RPG Gaming Market (2026-2032)
Industry Events and Analyst Meet

EV India Expo 2026

HIMTEX 2026

India Refining Summit 2026

India EV Show 2026

EV tech India Expo 2026
Whitepaper
- Middle East & Africa Commercial Security Market Click here to view more.
- Middle East & Africa Fire Safety Systems & Equipment Market Click here to view more.
- GCC Drone Market Click here to view more.
- Middle East Lighting Fixture Market Click here to view more.
- GCC Physical & Perimeter Security Market Click here to view more.