Romania Precipitated Silica Market (2026-2032) Outlook | Growth, Industry, Value, Size, Trends, Forecast, Share, Companies, Analysis & Revenue
Market Forecast By End Use Industry (Automobiles, Cosmetics, Electronics, Agriculture), By Application (Rubber, Personal Care, Food, Battery Separator, Coating & Inks, Adhesives & Sealants) And Competitive Landscape
| Product Code: ETC4482259 | Publication Date: Jul 2023 | Updated Date: Mar 2026 | Product Type: Report | |
| Publisher: 6Wresearch | Author: Dhaval Chaurasia | No. of Pages: 85 | No. of Figures: 45 | No. of Tables: 25 |
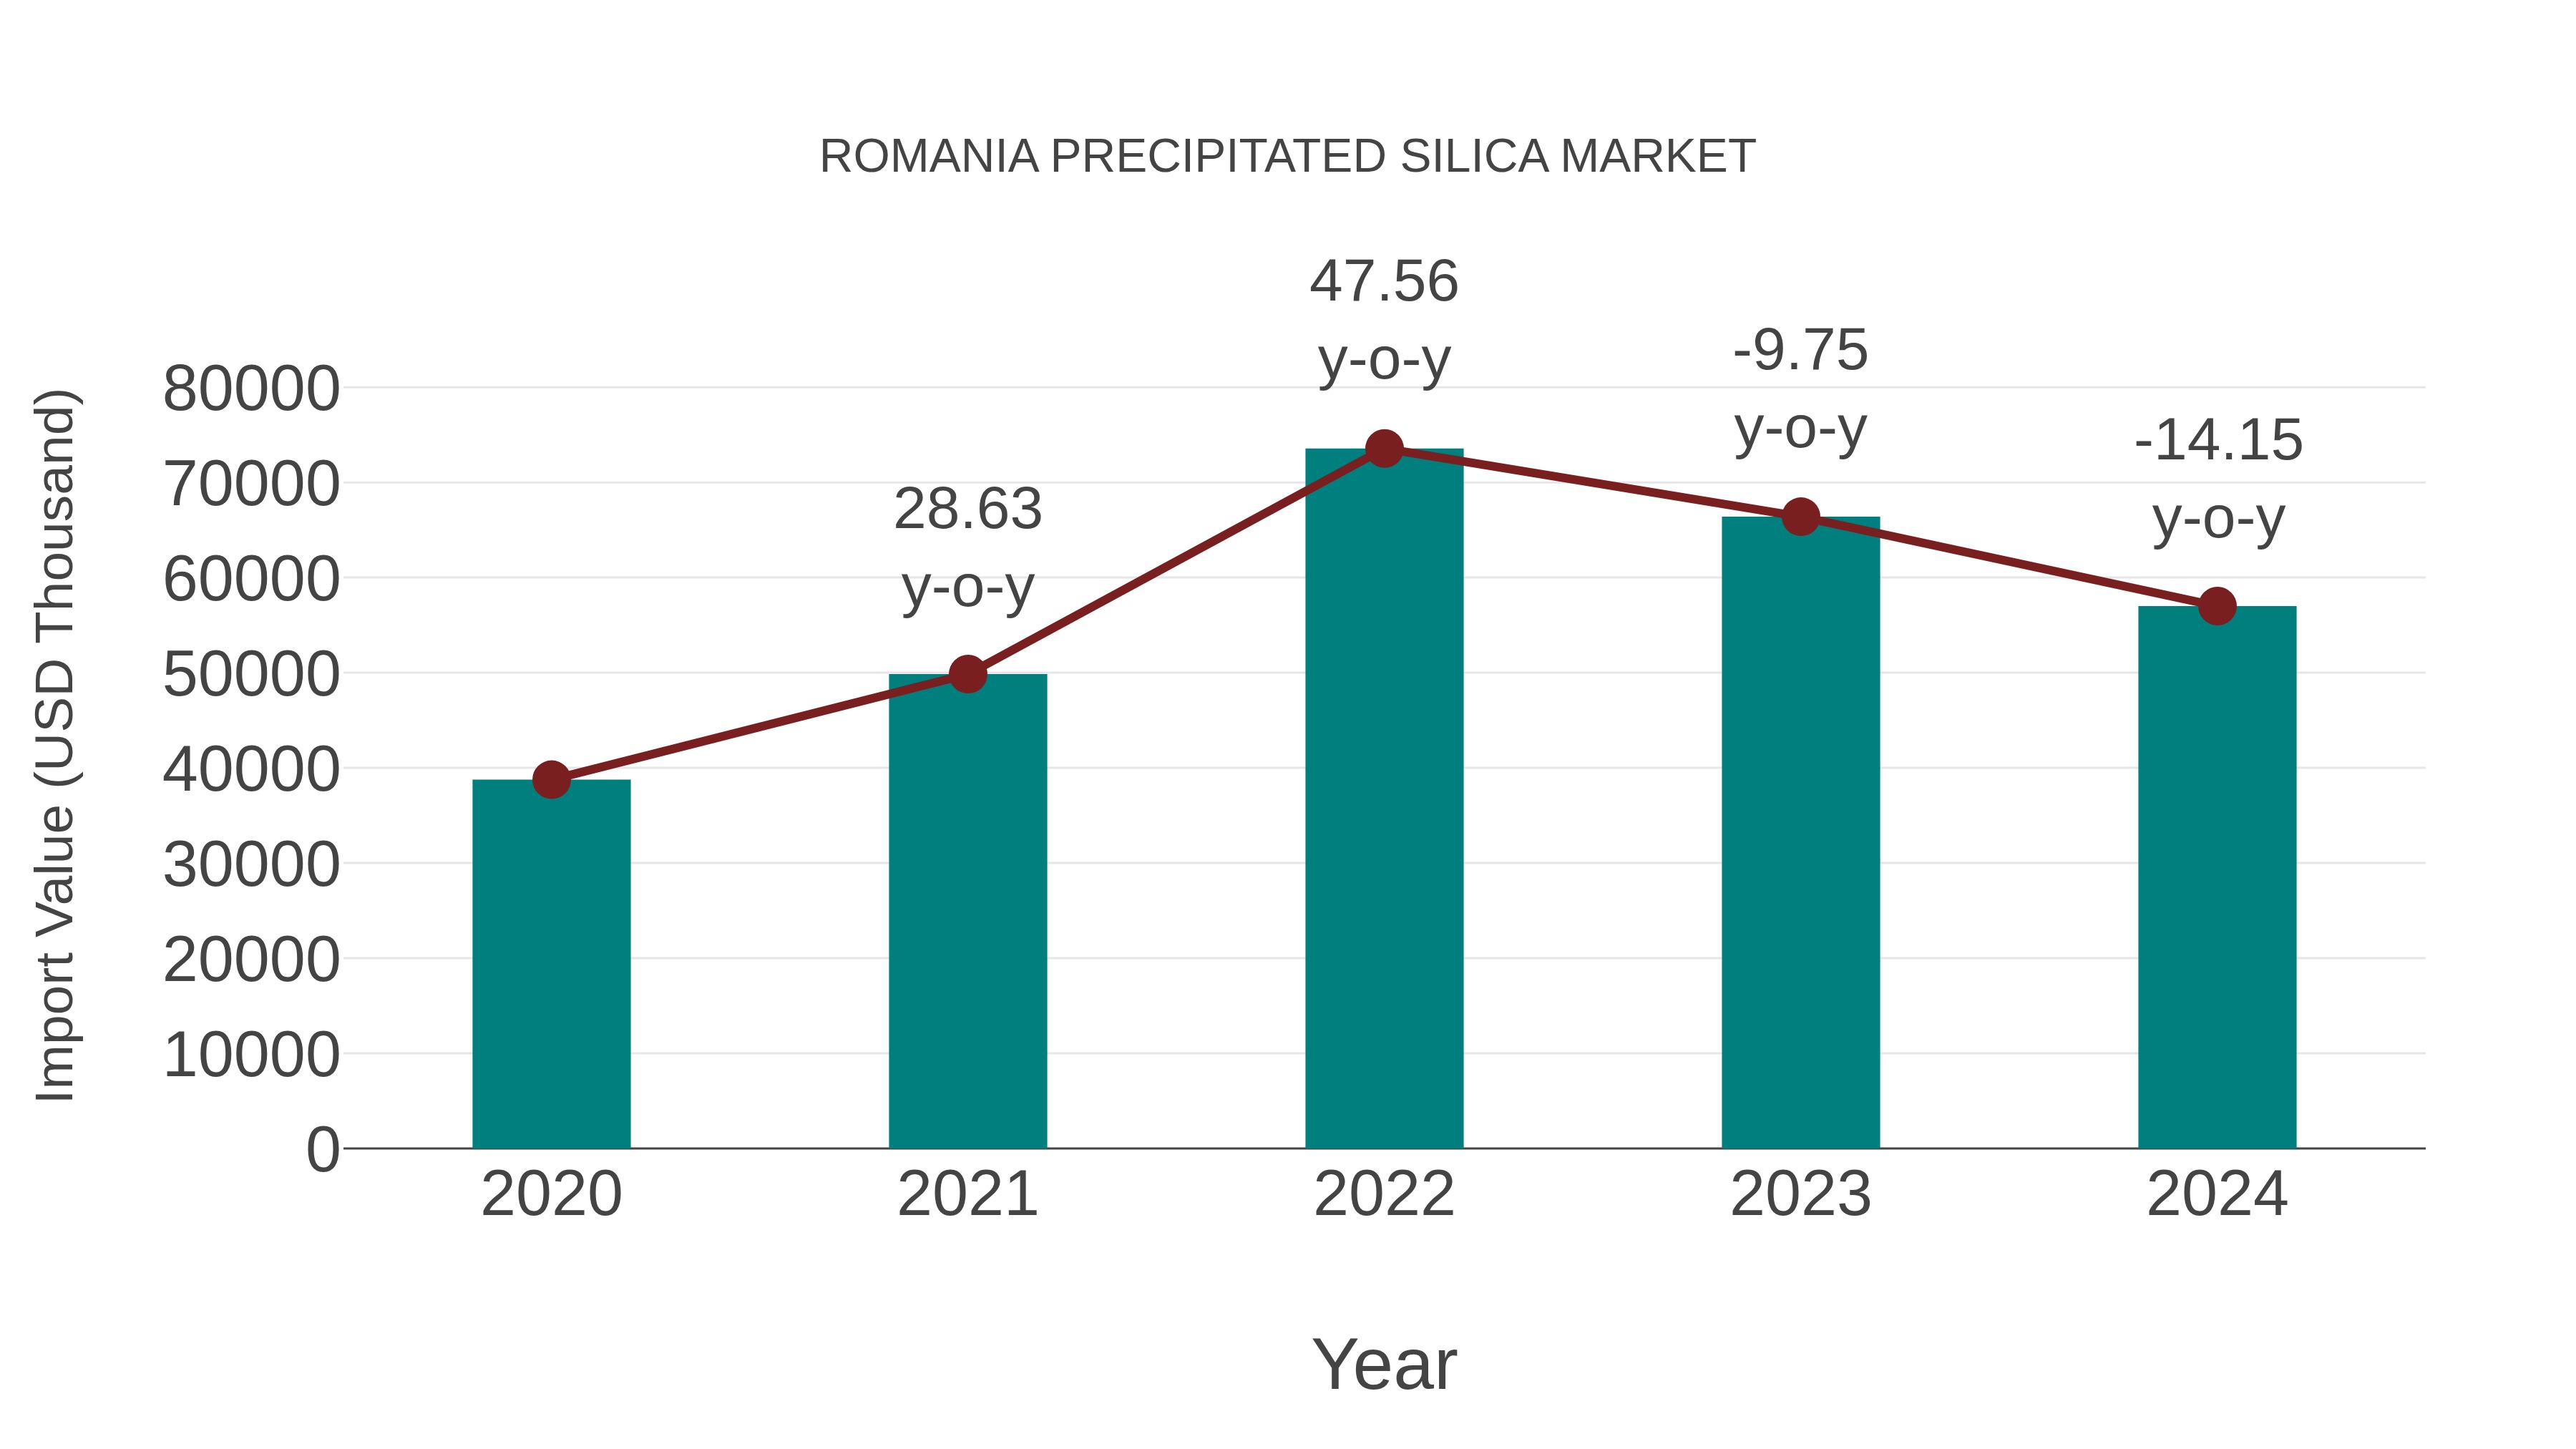
Romania Precipitated Silica Market: Import Trend Analysis
In the Romania precipitated silica market, the import trend experienced a decline from 2023 to 2024, with a growth rate of -14.15%. However, the compound annual growth rate (CAGR) for 2020-2024 stood at 10.12%. This downward import momentum in 2024 may be attributed to shifts in demand dynamics or changes in trade policies impacting market stability.
Romania Precipitated Silica Market Overview
The precipitated silica market in Romania is expanding due to its diverse applications in industries such as tires, food and beverage, personal care, and agriculture. Precipitated silica is valued for its reinforcement and abrasive properties in rubber products, as well as its use as a thickening and anti-caking agent in food and cosmetics. Market growth is driven by industrialization, technological advancements, and increasing consumer demand for high-performance materials.
Drivers of the market
The precipitated silica market in Romania is driven by its diverse applications in rubber, cosmetics, paints & coatings, and food & beverage industries. Demand for precipitated silica as a reinforcing filler, viscosity modifier, and anti-caking agent supports market growth. Technological advancements in silica particle engineering, surface modification techniques, and sustainable production methods contribute to market expansion. Regulatory requirements for product quality, safety standards, and environmental compliance further influence market dynamics.
Challenges of the market
Adapting to technological advancements and addressing environmental regulations pose challenges in the Romania precipitated silica market. Developing silica grades for tire manufacturing, oral care, and coatings while enhancing sustainability in production processes are pivotal for market acceptance and growth.
Government Policy of the market
Government policies in Romania precipitated silica market prioritize product quality, industrial applications, and environmental sustainability. Regulations include silica purity standards, emission guidelines, and support for silica production technologies.
Key Highlights of the Report:
- Romania Precipitated Silica Market Outlook
- Market Size of Romania Precipitated Silica Market, 2025
- Forecast of Romania Precipitated Silica Market, 2032
- Historical Data and Forecast of Romania Precipitated Silica Revenues & Volume for the Period 2022-2032F
- Romania Precipitated Silica Market Trend Evolution
- Romania Precipitated Silica Market Drivers and Challenges
- Romania Precipitated Silica Price Trends
- Romania Precipitated Silica Porter's Five Forces
- Romania Precipitated Silica Industry Life Cycle
- Historical Data and Forecast of Romania Precipitated Silica Market Revenues & Volume By End Use Industry for the Period 2022-2032F
- Historical Data and Forecast of Romania Precipitated Silica Market Revenues & Volume By Automobiles for the Period 2022-2032F
- Historical Data and Forecast of Romania Precipitated Silica Market Revenues & Volume By Cosmetics for the Period 2022-2032F
- Historical Data and Forecast of Romania Precipitated Silica Market Revenues & Volume By Electronics for the Period 2022-2032F
- Historical Data and Forecast of Romania Precipitated Silica Market Revenues & Volume By Agriculture for the Period 2022-2032F
- Historical Data and Forecast of Romania Precipitated Silica Market Revenues & Volume By Application for the Period 2022-2032F
- Historical Data and Forecast of Romania Precipitated Silica Market Revenues & Volume By Rubber for the Period 2022-2032F
- Historical Data and Forecast of Romania Precipitated Silica Market Revenues & Volume By Personal Care for the Period 2022-2032F
- Historical Data and Forecast of Romania Precipitated Silica Market Revenues & Volume By Food for the Period 2022-2032F
- Historical Data and Forecast of Romania Precipitated Silica Market Revenues & Volume By Battery Separator for the Period 2022-2032F
- Historical Data and Forecast of Romania Precipitated Silica Market Revenues & Volume By Coating & Inks for the Period 2022-2032F
- Historical Data and Forecast of Romania Precipitated Silica Market Revenues & Volume By Adhesives & Sealants for the Period 2022-2032F
- Romania Precipitated Silica Import Export Trade Statistics
- Market Opportunity Assessment By End Use Industry
- Market Opportunity Assessment By Application
- Romania Precipitated Silica Top Companies Market Share
- Romania Precipitated Silica Competitive Benchmarking By Technical and Operational Parameters
- Romania Precipitated Silica Company Profiles
- Romania Precipitated Silica Key Strategic Recommendations
Romania Precipitated Silica Market (2026-2032): FAQs
6Wresearch actively monitors the Romania Precipitated Silica Market and publishes its comprehensive annual report, highlighting emerging trends, growth drivers, revenue analysis, and forecast outlook. Our insights help businesses to make data-backed strategic decisions with ongoing market dynamics. Our analysts track relevent industries related to the Romania Precipitated Silica Market, allowing our clients with actionable intelligence and reliable forecasts tailored to emerging regional needs.
Yes, we provide customisation as per your requirements. To learn more, feel free to contact us on sales@6wresearch.com
1 Executive Summary |
2 Introduction |
2.1 Key Highlights of the Report |
2.2 Report Description |
2.3 Market Scope & Segmentation |
2.4 Research Methodology |
2.5 Assumptions |
3 Romania Precipitated Silica Market Overview |
3.1 Romania Country Macro Economic Indicators |
3.2 Romania Precipitated Silica Market Revenues & Volume, 2022 & 2032F |
3.3 Romania Precipitated Silica Market - Industry Life Cycle |
3.4 Romania Precipitated Silica Market - Porter's Five Forces |
3.5 Romania Precipitated Silica Market Revenues & Volume Share, By End Use Industry, 2022 & 2032F |
3.6 Romania Precipitated Silica Market Revenues & Volume Share, By Application, 2022 & 2032F |
4 Romania Precipitated Silica Market Dynamics |
4.1 Impact Analysis |
4.2 Market Drivers |
4.2.1 Growing demand from end-use industries such as rubber, cosmetics, and agriculture |
4.2.2 Increasing awareness about the benefits of using precipitated silica in various applications |
4.2.3 Rise in research and development activities leading to product innovations |
4.3 Market Restraints |
4.3.1 Fluctuating raw material prices affecting production costs |
4.3.2 Stringent regulations related to environmental impact and safety standards |
4.3.3 Competition from substitute products impacting market growth |
5 Romania Precipitated Silica Market Trends |
6 Romania Precipitated Silica Market, By Types |
6.1 Romania Precipitated Silica Market, By End Use Industry |
6.1.1 Overview and Analysis |
6.1.2 Romania Precipitated Silica Market Revenues & Volume, By End Use Industry, 2022-2032F |
6.1.3 Romania Precipitated Silica Market Revenues & Volume, By Automobiles, 2022-2032F |
6.1.4 Romania Precipitated Silica Market Revenues & Volume, By Cosmetics, 2022-2032F |
6.1.5 Romania Precipitated Silica Market Revenues & Volume, By Electronics, 2022-2032F |
6.1.6 Romania Precipitated Silica Market Revenues & Volume, By Agriculture, 2022-2032F |
6.2 Romania Precipitated Silica Market, By Application |
6.2.1 Overview and Analysis |
6.2.2 Romania Precipitated Silica Market Revenues & Volume, By Rubber, 2022-2032F |
6.2.3 Romania Precipitated Silica Market Revenues & Volume, By Personal Care, 2022-2032F |
6.2.4 Romania Precipitated Silica Market Revenues & Volume, By Food, 2022-2032F |
6.2.5 Romania Precipitated Silica Market Revenues & Volume, By Battery Separator, 2022-2032F |
6.2.6 Romania Precipitated Silica Market Revenues & Volume, By Coating & Inks, 2022-2032F |
6.2.7 Romania Precipitated Silica Market Revenues & Volume, By Adhesives & Sealants, 2022-2032F |
7 Romania Precipitated Silica Market Import-Export Trade Statistics |
7.1 Romania Precipitated Silica Market Export to Major Countries |
7.2 Romania Precipitated Silica Market Imports from Major Countries |
8 Romania Precipitated Silica Market Key Performance Indicators |
8.1 Research and development investment in new applications of precipitated silica |
8.2 Adoption rate of precipitated silica in emerging industries |
8.3 Number of patents filed for innovative precipitated silica products |
9 Romania Precipitated Silica Market - Opportunity Assessment |
9.1 Romania Precipitated Silica Market Opportunity Assessment, By End Use Industry, 2022 & 2032F |
9.2 Romania Precipitated Silica Market Opportunity Assessment, By Application, 2022 & 2032F |
10 Romania Precipitated Silica Market - Competitive Landscape |
10.1 Romania Precipitated Silica Market Revenue Share, By Companies, 2025 |
10.2 Romania Precipitated Silica Market Competitive Benchmarking, By Operating and Technical Parameters |
11 Company Profiles |
12 Recommendations |
13 Disclaimer |
Export potential assessment - trade Analytics for 2030
Export potential enables firms to identify high-growth global markets with greater confidence by combining advanced trade intelligence with a structured quantitative methodology. The framework analyzes emerging demand trends and country-level import patterns while integrating macroeconomic and trade datasets such as GDP and population forecasts, bilateral import–export flows, tariff structures, elasticity differentials between developed and developing economies, geographic distance, and import demand projections. Using weighted trade values from 2020–2024 as the base period to project country-to-country export potential for 2030, these inputs are operationalized through calculated drivers such as gravity model parameters, tariff impact factors, and projected GDP per-capita growth. Through an analysis of hidden potentials, demand hotspots, and market conditions that are most favorable to success, this method enables firms to focus on target countries, maximize returns, and global expansion with data, backed by accuracy.
By factoring in the projected importer demand gap that is currently unmet and could be potential opportunity, it identifies the potential for the Exporter (Country) among 190 countries, against the general trade analysis, which identifies the biggest importer or exporter.
To discover high-growth global markets and optimize your business strategy:
Click Here
Pricing
- Single User License$ 1,995
- Department License$ 2,400
- Site License$ 3,120
- Global License$ 3,795

Search
Thought Leadership and Analyst Meet


Our Clients
Latest Reports
- Syria Air Conditioner Market (2026-2032) | Outlook, Competition, Drivers, Trends, Demand, Competitive, Strategic Insights, Companies, Challenges, Strategy, Consumer Insights, Analysis, Opportunities, Growth, Size, Share, Industry, Revenue, Segments, Value, Segmentation, Supply, Forecast, Restraints,
- Philippines Polyhydroxybutyrate-co-Hydroxyvalerate Market (2026-2032) | Trends, Insights, Challenges, Restraints, Competition, Size, Value, Forecast, Pricing, Share, Outlook, Revenue, Investment Opportunities, Strategy, Drivers, Demand, Growth, segmentation, Analysis, Companies
- Peru Polyhydroxybutyrate-co-Hydroxyvalerate Market (2026-2032) | Growth, Demand, Challenges, Share, Trends, Analysis, Pricing, Investment Opportunities, Drivers, Value, Forecast, Competition, Size, Companies, Insights, Outlook, Restraints, segmentation, Revenue, Strategy
- Pakistan Polyhydroxybutyrate-co-Hydroxyvalerate Market (2026-2032) | Restraints, segmentation, Pricing, Forecast, Share, Strategy, Competition, Trends, Insights, Drivers, Challenges, Growth, Revenue, Outlook, Value, Investment Opportunities, Companies, Size, Analysis, Demand
- Oman Polyhydroxybutyrate-co-Hydroxyvalerate Market (2026-2032) | Drivers, segmentation, Insights, Competition, Pricing, Outlook, Size, Revenue, Challenges, Forecast, Analysis, Growth, Value, Share, Trends, Investment Opportunities, Strategy, Restraints, Companies, Demand
- Nigeria Polyhydroxybutyrate-co-Hydroxyvalerate Market (2026-2032) | Value, Investment Opportunities, Analysis, Revenue, Restraints, Pricing, Outlook, Competition, Demand, Growth, Forecast, Companies, Trends, Challenges, segmentation, Drivers, Insights, Share, Size, Strategy
- Nepal Polyhydroxybutyrate-co-Hydroxyvalerate Market (2026-2032) | Insights, Analysis, Drivers, Share, Revenue, Demand, segmentation, Investment Opportunities, Competition, Forecast, Growth, Pricing, Companies, Strategy, Trends, Restraints, Challenges, Outlook, Size, Value
- Myanmar Polyhydroxybutyrate-co-Hydroxyvalerate Market (2026-2032) | Outlook, Revenue, Strategy, Restraints, Drivers, segmentation, Share, Forecast, Competition, Insights, Growth, Pricing, Size, Demand, Value, Companies, Trends, Challenges, Investment Opportunities, Analysis
- Morocco Polyhydroxybutyrate-co-Hydroxyvalerate Market (2026-2032) | Outlook, Investment Opportunities, Restraints, Strategy, Forecast, Challenges, Drivers, Growth, Companies, segmentation, Trends, Size, Competition, Revenue, Demand, Insights, Share, Analysis, Value, Pricing
- Mexico Polyhydroxybutyrate-co-Hydroxyvalerate Market (2026-2032) | Size, Drivers, Outlook, Share, Strategy, Growth, Pricing, Challenges, Companies, Demand, Value, Investment Opportunities, Restraints, Trends, Forecast, segmentation, Analysis, Insights, Competition, Revenue
Industry Events and Analyst Meet

HIMTEX 2026

India Refining Summit 2026

India EV Show 2026

EV tech India Expo 2026

Auto Tech Asia 2026
Whitepaper
- Middle East & Africa Commercial Security Market Click here to view more.
- Middle East & Africa Fire Safety Systems & Equipment Market Click here to view more.
- GCC Drone Market Click here to view more.
- Middle East Lighting Fixture Market Click here to view more.
- GCC Physical & Perimeter Security Market Click here to view more.
6WResearch In News
- Doha a strategic location for EV manufacturing hub: IPA Qatar
- Demand for luxury TVs surging in the GCC, says Samsung
- Empowering Growth: The Thriving Journey of Bangladesh’s Cable Industry
- Demand for luxury TVs surging in the GCC, says Samsung
- Video call with a traditional healer? Once unthinkable, it’s now common in South Africa
- Intelligent Buildings To Smooth GCC’s Path To Net Zero