Rwanda Adhesive Tapes Market (2025-2031) | Industry, Companies, Trends, Size, Segmentation, Outlook, Growth, Revenue, Analysis, Forecast, Value & Share
Market Forecast By Resin Types (Acrylic, Epoxy, Rubber-based, Silicone, Polyurethane, Others), By Technology Types (Water-based, Solvent-based, Hot-melt, Reactive, Others), By Baking Material (Polypropylene (PP), Polyvinyl Chloride (PVC), Paper, Others), By End-users (Automotive, Health Care, Appliances, Others) And Competitive Landscape
| Product Code: ETC4651632 | Publication Date: Nov 2023 | Updated Date: Sep 2025 | Product Type: Market Research Report | |
| Publisher: 6Wresearch | Author: Shubham Padhi | No. of Pages: 60 | No. of Figures: 30 | No. of Tables: 5 |
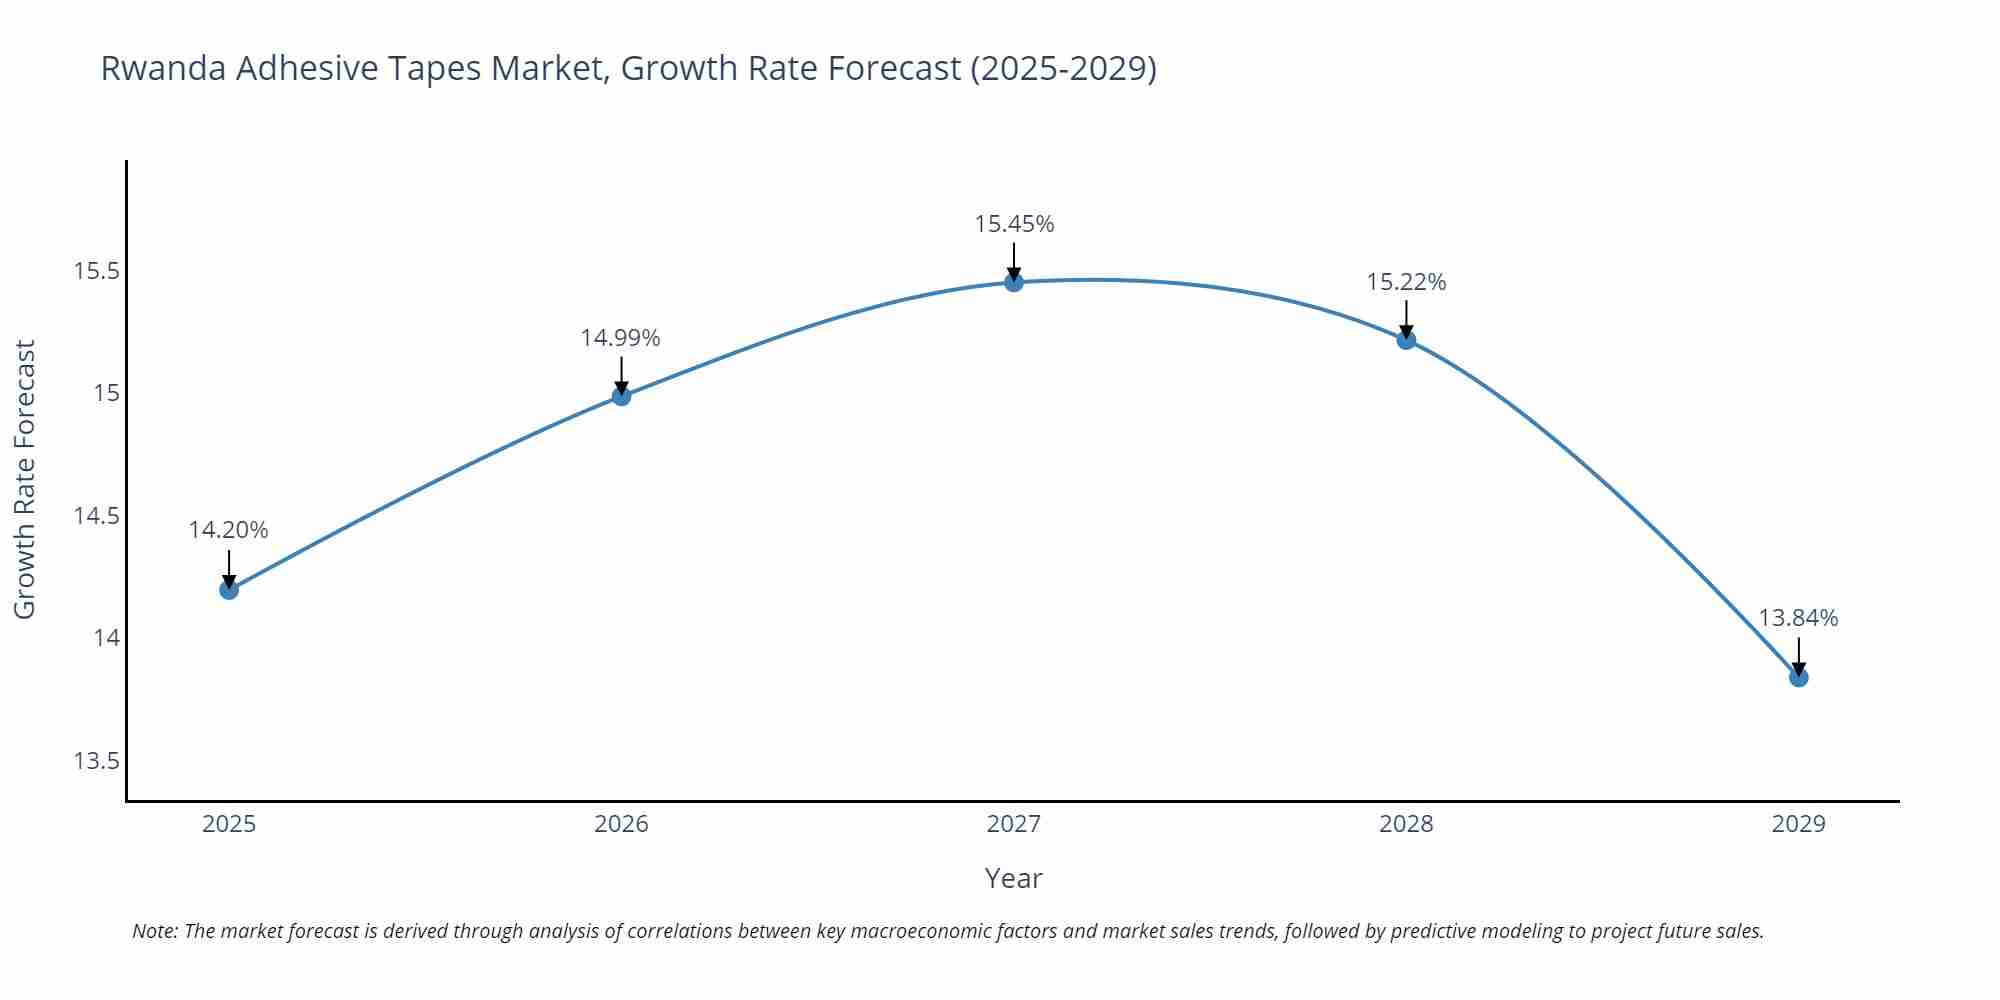
Rwanda Adhesive Tapes Market Size Growth Rate
The Rwanda Adhesive Tapes Market is projected to witness mixed growth rate patterns during 2025 to 2029. The growth rate begins at 14.20% in 2025, climbs to a high of 15.45% in 2027, and moderates to 13.84% by 2029.
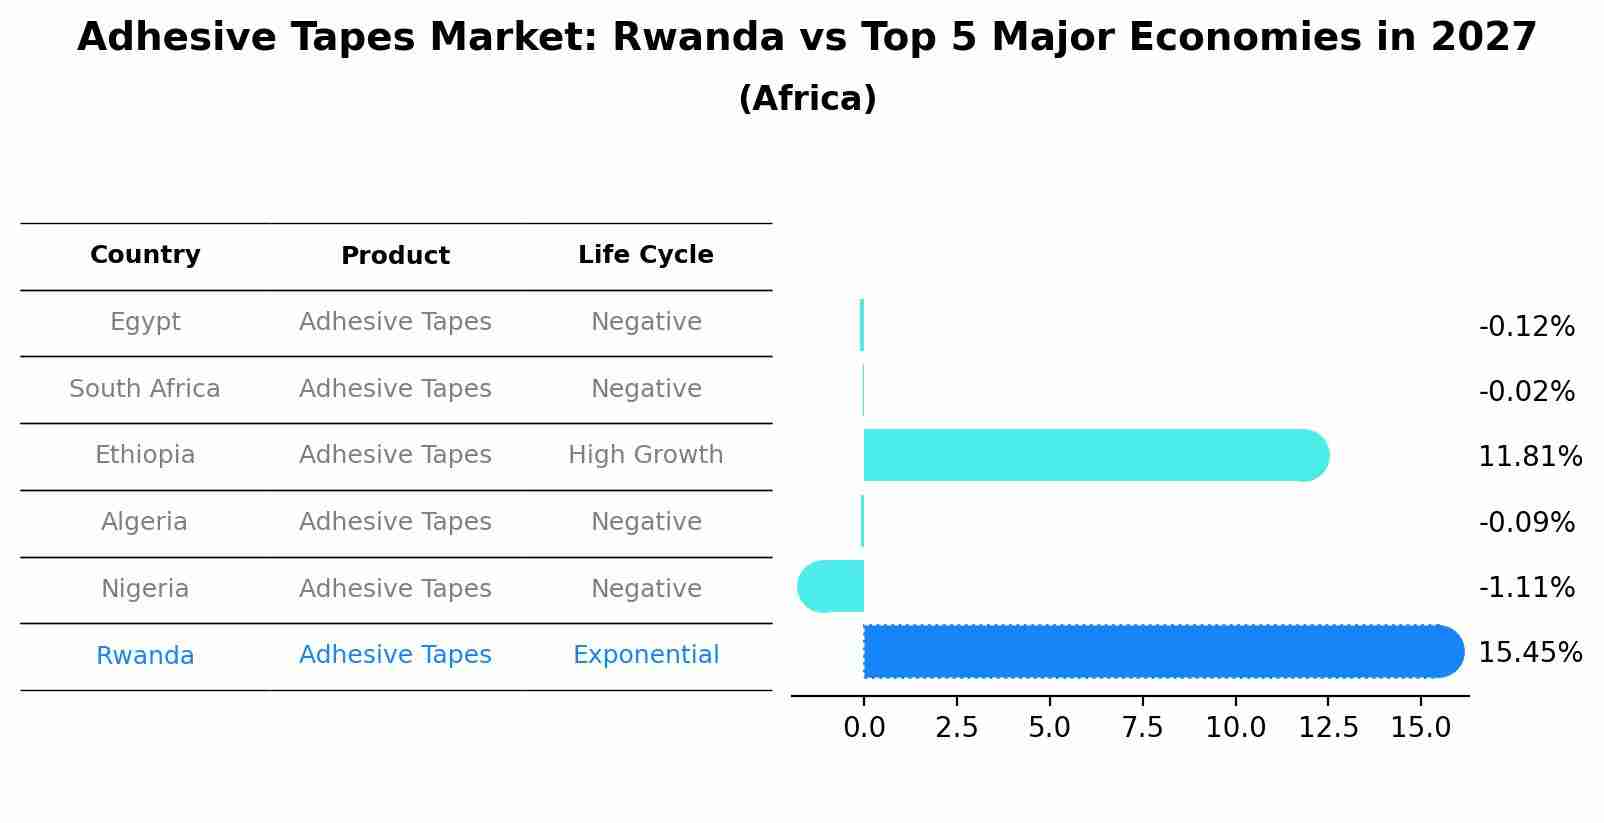
Adhesive Tapes Market: Rwanda vs Top 5 Major Economies in 2027 (Africa)
The Adhesive Tapes market in Rwanda is projected to grow at a exponential growth rate of 15.45% by 2027, within the Africa region led by Egypt, along with other countries like South Africa, Ethiopia, Algeria and Nigeria, collectively shaping a dynamic and evolving market environment driven by innovation and increasing adoption of emerging technologies.
Key Highlights of the Report:
- Rwanda Adhesive Tapes Market Outlook
- Market Size of Rwanda Adhesive Tapes Market, 2024
- Forecast of Rwanda Adhesive Tapes Market, 2031
- Historical Data and Forecast of Rwanda Adhesive Tapes Revenues & Volume for the Period 2021-2031
- Rwanda Adhesive Tapes Market Trend Evolution
- Rwanda Adhesive Tapes Market Drivers and Challenges
- Rwanda Adhesive Tapes Price Trends
- Rwanda Adhesive Tapes Porter`s Five Forces
- Rwanda Adhesive Tapes Industry Life Cycle
- Historical Data and Forecast of Rwanda Adhesive Tapes Market Revenues & Volume By Resin Types for the Period 2021-2031
- Historical Data and Forecast of Rwanda Adhesive Tapes Market Revenues & Volume By Acrylic for the Period 2021-2031
- Historical Data and Forecast of Rwanda Adhesive Tapes Market Revenues & Volume By Epoxy for the Period 2021-2031
- Historical Data and Forecast of Rwanda Adhesive Tapes Market Revenues & Volume By Rubber-based for the Period 2021-2031
- Historical Data and Forecast of Rwanda Adhesive Tapes Market Revenues & Volume By Silicone for the Period 2021-2031
- Historical Data and Forecast of Rwanda Adhesive Tapes Market Revenues & Volume By Polyurethane for the Period 2021-2031
- Historical Data and Forecast of Rwanda Adhesive Tapes Market Revenues & Volume By Others for the Period 2021-2031
- Historical Data and Forecast of Rwanda Adhesive Tapes Market Revenues & Volume By Technology Types for the Period 2021-2031
- Historical Data and Forecast of Rwanda Adhesive Tapes Market Revenues & Volume By Water-based for the Period 2021-2031
- Historical Data and Forecast of Rwanda Adhesive Tapes Market Revenues & Volume By Solvent-based for the Period 2021-2031
- Historical Data and Forecast of Rwanda Adhesive Tapes Market Revenues & Volume By Hot-melt for the Period 2021-2031
- Historical Data and Forecast of Rwanda Adhesive Tapes Market Revenues & Volume By Reactive for the Period 2021-2031
- Historical Data and Forecast of Rwanda Adhesive Tapes Market Revenues & Volume By Others for the Period 2021-2031
- Historical Data and Forecast of Rwanda Adhesive Tapes Market Revenues & Volume By Baking Material for the Period 2021-2031
- Historical Data and Forecast of Rwanda Adhesive Tapes Market Revenues & Volume By Polypropylene (PP) for the Period 2021-2031
- Historical Data and Forecast of Rwanda Adhesive Tapes Market Revenues & Volume By Polyvinyl Chloride (PVC) for the Period 2021-2031
- Historical Data and Forecast of Rwanda Adhesive Tapes Market Revenues & Volume By Paper for the Period 2021-2031
- Historical Data and Forecast of Rwanda Adhesive Tapes Market Revenues & Volume By Others for the Period 2021-2031
- Historical Data and Forecast of Rwanda Adhesive Tapes Market Revenues & Volume By End-users for the Period 2021-2031
- Historical Data and Forecast of Rwanda Adhesive Tapes Market Revenues & Volume By Automotive for the Period 2021-2031
- Historical Data and Forecast of Rwanda Adhesive Tapes Market Revenues & Volume By Health Care for the Period 2021-2031
- Historical Data and Forecast of Rwanda Adhesive Tapes Market Revenues & Volume By Appliances for the Period 2021-2031
- Historical Data and Forecast of Rwanda Adhesive Tapes Market Revenues & Volume By Others for the Period 2021-2031
- Rwanda Adhesive Tapes Import Export Trade Statistics
- Market Opportunity Assessment By Resin Types
- Market Opportunity Assessment By Technology Types
- Market Opportunity Assessment By Baking Material
- Market Opportunity Assessment By End-users
- Rwanda Adhesive Tapes Top Companies Market Share
- Rwanda Adhesive Tapes Competitive Benchmarking By Technical and Operational Parameters
- Rwanda Adhesive Tapes Company Profiles
- Rwanda Adhesive Tapes Key Strategic Recommendations
Frequently Asked Questions About the Market Study (FAQs):
6Wresearch actively monitors the Rwanda Adhesive Tapes Market and publishes its comprehensive annual report, highlighting emerging trends, growth drivers, revenue analysis, and forecast outlook. Our insights help businesses to make data-backed strategic decisions with ongoing market dynamics. Our analysts track relevent industries related to the Rwanda Adhesive Tapes Market, allowing our clients with actionable intelligence and reliable forecasts tailored to emerging regional needs.
Yes, we provide customisation as per your requirements. To learn more, feel free to contact us on sales@6wresearch.com
1 Executive Summary |
2 Introduction |
2.1 Key Highlights of the Report |
2.2 Report Description |
2.3 Market Scope & Segmentation |
2.4 Research Methodology |
2.5 Assumptions |
3 Rwanda Adhesive Tapes Market Overview |
3.1 Rwanda Country Macro Economic Indicators |
3.2 Rwanda Adhesive Tapes Market Revenues & Volume, 2021 & 2031F |
3.3 Rwanda Adhesive Tapes Market - Industry Life Cycle |
3.4 Rwanda Adhesive Tapes Market - Porter's Five Forces |
3.5 Rwanda Adhesive Tapes Market Revenues & Volume Share, By Resin Types, 2021 & 2031F |
3.6 Rwanda Adhesive Tapes Market Revenues & Volume Share, By Technology Types, 2021 & 2031F |
3.7 Rwanda Adhesive Tapes Market Revenues & Volume Share, By Baking Material, 2021 & 2031F |
3.8 Rwanda Adhesive Tapes Market Revenues & Volume Share, By End-users, 2021 & 2031F |
4 Rwanda Adhesive Tapes Market Dynamics |
4.1 Impact Analysis |
4.2 Market Drivers |
4.2.1 Increasing industrialization and infrastructure development in Rwanda leading to higher demand for adhesive tapes in construction and manufacturing sectors. |
4.2.2 Growth in the e-commerce sector driving the need for packaging materials, including adhesive tapes, for shipping and logistics purposes. |
4.2.3 Rising awareness about the benefits of using adhesive tapes over traditional sealing methods, leading to a shift towards their usage in various applications. |
4.3 Market Restraints |
4.3.1 Fluctuations in raw material prices impacting the production costs of adhesive tapes. |
4.3.2 Competition from alternative packaging and sealing solutions affecting the market share of adhesive tapes. |
4.3.3 Lack of awareness about the diverse applications and benefits of specialized adhesive tapes hindering market growth. |
5 Rwanda Adhesive Tapes Market Trends |
6 Rwanda Adhesive Tapes Market Segmentations |
6.1 Rwanda Adhesive Tapes Market, By Resin Types |
6.1.1 Overview and Analysis |
6.1.2 Rwanda Adhesive Tapes Market Revenues & Volume, By Acrylic, 2021-2031F |
6.1.3 Rwanda Adhesive Tapes Market Revenues & Volume, By Epoxy, 2021-2031F |
6.1.4 Rwanda Adhesive Tapes Market Revenues & Volume, By Rubber-based, 2021-2031F |
6.1.5 Rwanda Adhesive Tapes Market Revenues & Volume, By Silicone, 2021-2031F |
6.1.6 Rwanda Adhesive Tapes Market Revenues & Volume, By Polyurethane, 2021-2031F |
6.1.7 Rwanda Adhesive Tapes Market Revenues & Volume, By Others, 2021-2031F |
6.2 Rwanda Adhesive Tapes Market, By Technology Types |
6.2.1 Overview and Analysis |
6.2.2 Rwanda Adhesive Tapes Market Revenues & Volume, By Water-based, 2021-2031F |
6.2.3 Rwanda Adhesive Tapes Market Revenues & Volume, By Solvent-based, 2021-2031F |
6.2.4 Rwanda Adhesive Tapes Market Revenues & Volume, By Hot-melt, 2021-2031F |
6.2.5 Rwanda Adhesive Tapes Market Revenues & Volume, By Reactive, 2021-2031F |
6.2.6 Rwanda Adhesive Tapes Market Revenues & Volume, By Others, 2021-2031F |
6.3 Rwanda Adhesive Tapes Market, By Baking Material |
6.3.1 Overview and Analysis |
6.3.2 Rwanda Adhesive Tapes Market Revenues & Volume, By Polypropylene (PP), 2021-2031F |
6.3.3 Rwanda Adhesive Tapes Market Revenues & Volume, By Polyvinyl Chloride (PVC), 2021-2031F |
6.3.4 Rwanda Adhesive Tapes Market Revenues & Volume, By Paper, 2021-2031F |
6.3.5 Rwanda Adhesive Tapes Market Revenues & Volume, By Others, 2021-2031F |
6.4 Rwanda Adhesive Tapes Market, By End-users |
6.4.1 Overview and Analysis |
6.4.2 Rwanda Adhesive Tapes Market Revenues & Volume, By Automotive, 2021-2031F |
6.4.3 Rwanda Adhesive Tapes Market Revenues & Volume, By Health Care, 2021-2031F |
6.4.4 Rwanda Adhesive Tapes Market Revenues & Volume, By Appliances, 2021-2031F |
6.4.5 Rwanda Adhesive Tapes Market Revenues & Volume, By Others, 2021-2031F |
7 Rwanda Adhesive Tapes Market Import-Export Trade Statistics |
7.1 Rwanda Adhesive Tapes Market Export to Major Countries |
7.2 Rwanda Adhesive Tapes Market Imports from Major Countries |
8 Rwanda Adhesive Tapes Market Key Performance Indicators |
8.1 Manufacturing capacity utilization rate: Indicates the efficiency of production processes and the ability to meet market demand. |
8.2 Percentage of repeat customers: Reflects customer satisfaction and loyalty towards adhesive tape products. |
8.3 Innovation rate: Measures the frequency of new product launches and technological advancements, which can drive market growth. |
8.4 Supplier performance metrics: Evaluates the reliability and quality of raw material suppliers, impacting the production and pricing of adhesive tapes. |
8.5 Environmental impact indicators: Tracks the sustainability practices and eco-friendliness of adhesive tape manufacturers, which can influence consumer preferences and market growth. |
9 Rwanda Adhesive Tapes Market - Opportunity Assessment |
9.1 Rwanda Adhesive Tapes Market Opportunity Assessment, By Resin Types, 2021 & 2031F |
9.2 Rwanda Adhesive Tapes Market Opportunity Assessment, By Technology Types, 2021 & 2031F |
9.3 Rwanda Adhesive Tapes Market Opportunity Assessment, By Baking Material, 2021 & 2031F |
9.4 Rwanda Adhesive Tapes Market Opportunity Assessment, By End-users, 2021 & 2031F |
10 Rwanda Adhesive Tapes Market - Competitive Landscape |
10.1 Rwanda Adhesive Tapes Market Revenue Share, By Companies, 2024 |
10.2 Rwanda Adhesive Tapes Market Competitive Benchmarking, By Operating and Technical Parameters |
11 Company Profiles |
12 Recommendations | 13 Disclaimer |
Global Go To Market Strategy - 2030
Export potential enables firms to identify high-growth global markets with greater confidence by combining advanced trade intelligence with a structured quantitative methodology. The framework analyzes emerging demand trends and country-level import patterns while integrating macroeconomic and trade datasets such as GDP and population forecasts, bilateral import–export flows, tariff structures, elasticity differentials between developed and developing economies, geographic distance, and import demand projections. Using weighted trade values from 2020–2024 as the base period to project country-to-country export potential for 2030, these inputs are operationalized through calculated drivers such as gravity model parameters, tariff impact factors, and projected GDP per-capita growth. Through an analysis of hidden potentials, demand hotspots, and market conditions that are most favorable to success, this method enables firms to focus on target countries, maximize returns, and global expansion with data, backed by accuracy.
By factoring in the projected importer demand gap that is currently unmet and could be potential opportunity, it identifies the potential for the Exporter (Country) among 190 countries, against the general trade analysis, which identifies the biggest importer or exporter.
To discover high-growth global markets and optimize your business strategy:
Click Here
Pricing
- Single User License$ 1,995
- Department License$ 2,400
- Site License$ 3,120
- Global License$ 3,795

Leadership Perspectives from Industry Events
Search
Thought Leadership and Analyst Meet


Our Clients
6WResearch In News
- India Air Conditioner Market Set for Strong Rebound in 2026 After Weather-Led Correction and GST-Driven Recovery: 6Wresearch
- ADAS in India: How Automatic Emergency Braking, Blind Spot Detection & Driver Monitoring are Transforming Road Safety
- Doha a strategic location for EV manufacturing hub: IPA Qatar
- Demand for luxury TVs surging in the GCC, says Samsung
- Empowering Growth: The Thriving Journey of Bangladesh’s Cable Industry
- Demand for luxury TVs surging in the GCC, says Samsung
Latest Reports
- Poland Fire Protection Systems Market (2026-2032)
- Cape Verde Portable Hand-Thrown Extinguisher Market (2026-2032)
- Canada Portable Hand-Thrown Extinguisher Market (2026-2032)
- Cameroon Portable Hand-Thrown Extinguisher Market (2026-2032)
- Burundi Portable Hand-Thrown Extinguisher Market (2026-2032)
- Burkina Faso Portable Hand-Thrown Extinguisher Market (2026-2032)
- Bulgaria Portable Hand-Thrown Extinguisher Market (2026-2032)
- Brunei Portable Hand-Thrown Extinguisher Market (2026-2032)
- Botswana Portable Hand-Thrown Extinguisher Market (2026-2032)
- Bosnia and Herzegovina Portable Hand-Thrown Extinguisher Market (2026-2032)
Industry Events and Analyst Meet

HIMTEX 2026

India Refining Summit 2026

India EV Show 2026

EV tech India Expo 2026

Auto Tech Asia 2026
Whitepaper
- Middle East & Africa Commercial Security Market Click here to view more.
- Middle East & Africa Fire Safety Systems & Equipment Market Click here to view more.
- GCC Drone Market Click here to view more.
- Middle East Lighting Fixture Market Click here to view more.
- GCC Physical & Perimeter Security Market Click here to view more.