Rwanda Polyamides Market (2025-2031) | Companies, Share, Growth, Revenue, Industry, Analysis, Outlook, Forecast, Segmentation, Trends, Value & Size
Market Forecast By Types (PA 6, PA 66, Bio Polyamides & Specialty Polyamides), By Class (Aliphatic Polyamides, Semi-Aromatic & Aromatic Polyamides), By Application (Fibers, Wire & Cables, 3D Printing, Sports Equipment, Engine Components, Brakes & Transmission Parts, Household Goods & Appliances), By End-use (Automotive, Electrical & Electronics, Textile, Aerospace & Defense, Packaging, Consumer Goods) And Competitive Landscape
| Product Code: ETC4735555 | Publication Date: Nov 2023 | Updated Date: Sep 2025 | Product Type: Market Research Report | |
| Publisher: 6Wresearch | Author: Shubham Padhi | No. of Pages: 60 | No. of Figures: 30 | No. of Tables: 5 |
Rwanda Polyamides Market Size Growth Rate
The Rwanda Polyamides Market is projected to witness mixed growth rate patterns during 2025 to 2029. The growth rate begins at 13.60% in 2025, climbs to a high of 14.51% in 2027, and moderates to 13.79% by 2029.

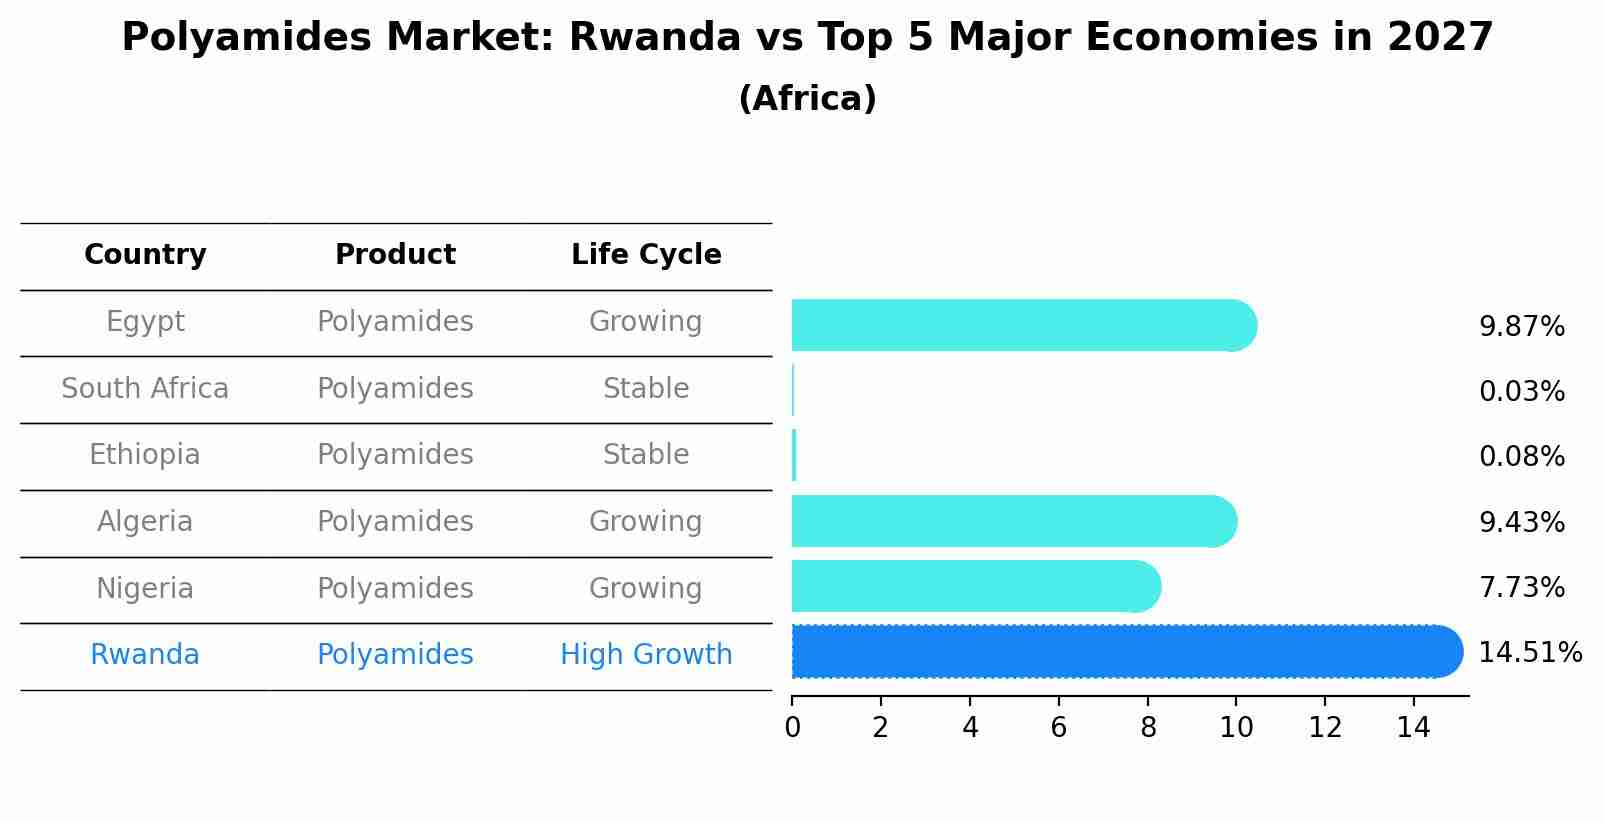
Polyamides Market: Rwanda vs Top 5 Major Economies in 2027 (Africa)
By 2027, the Polyamides market in Rwanda is anticipated to reach a growth rate of 14.51%, as part of an increasingly competitive Africa region, where Egypt remains at the forefront, supported by South Africa, Ethiopia, Algeria and Nigeria, driving innovations and market adoption across sectors.
Key Highlights of the Report:
- Rwanda Polyamides Market Outlook
- Market Size of Rwanda Polyamides Market, 2024
- Forecast of Rwanda Polyamides Market, 2031
- Historical Data and Forecast of Rwanda Polyamides Revenues & Volume for the Period 2021-2031
- Rwanda Polyamides Market Trend Evolution
- Rwanda Polyamides Market Drivers and Challenges
- Rwanda Polyamides Price Trends
- Rwanda Polyamides Porter`s Five Forces
- Rwanda Polyamides Industry Life Cycle
- Historical Data and Forecast of Rwanda Polyamides Market Revenues & Volume By Types for the Period 2021-2031
- Historical Data and Forecast of Rwanda Polyamides Market Revenues & Volume By PA 6 for the Period 2021-2031
- Historical Data and Forecast of Rwanda Polyamides Market Revenues & Volume By PA 66 for the Period 2021-2031
- Historical Data and Forecast of Rwanda Polyamides Market Revenues & Volume By Bio Polyamides & Specialty Polyamides for the Period 2021-2031
- Historical Data and Forecast of Rwanda Polyamides Market Revenues & Volume By Class for the Period 2021-2031
- Historical Data and Forecast of Rwanda Polyamides Market Revenues & Volume By Aliphatic Polyamides for the Period 2021-2031
- Historical Data and Forecast of Rwanda Polyamides Market Revenues & Volume By Semi-Aromatic & Aromatic Polyamides for the Period 2021-2031
- Historical Data and Forecast of Rwanda Polyamides Market Revenues & Volume By Application for the Period 2021-2031
- Historical Data and Forecast of Rwanda Polyamides Market Revenues & Volume By Fibers for the Period 2021-2031
- Historical Data and Forecast of Rwanda Polyamides Market Revenues & Volume By Wire & Cables for the Period 2021-2031
- Historical Data and Forecast of Rwanda Polyamides Market Revenues & Volume By 3D Printing for the Period 2021-2031
- Historical Data and Forecast of Rwanda Polyamides Market Revenues & Volume By Sports Equipment for the Period 2021-2031
- Historical Data and Forecast of Rwanda Polyamides Market Revenues & Volume By Engine Components for the Period 2021-2031
- Historical Data and Forecast of Rwanda Polyamides Market Revenues & Volume By Brakes & Transmission Parts for the Period 2021-2031
- Historical Data and Forecast of Rwanda Polyamides Market Revenues & Volume By Household Goods & Appliances for the Period 2021-2031
- Historical Data and Forecast of Rwanda Polyamides Market Revenues & Volume By End-use for the Period 2021-2031
- Historical Data and Forecast of Rwanda Polyamides Market Revenues & Volume By Automotive for the Period 2021-2031
- Historical Data and Forecast of Rwanda Polyamides Market Revenues & Volume By Electrical & Electronics for the Period 2021-2031
- Historical Data and Forecast of Rwanda Polyamides Market Revenues & Volume By Textile for the Period 2021-2031
- Historical Data and Forecast of Rwanda Polyamides Market Revenues & Volume By Aerospace & Defense for the Period 2021-2031
- Historical Data and Forecast of Rwanda Polyamides Market Revenues & Volume By Packaging for the Period 2021-2031
- Historical Data and Forecast of Rwanda Polyamides Market Revenues & Volume By Consumer Goods for the Period 2021-2031
- Rwanda Polyamides Import Export Trade Statistics
- Market Opportunity Assessment By Types
- Market Opportunity Assessment By Class
- Market Opportunity Assessment By Application
- Market Opportunity Assessment By End-use
- Rwanda Polyamides Top Companies Market Share
- Rwanda Polyamides Competitive Benchmarking By Technical and Operational Parameters
- Rwanda Polyamides Company Profiles
- Rwanda Polyamides Key Strategic Recommendations
Frequently Asked Questions About the Market Study (FAQs):
6Wresearch actively monitors the Rwanda Polyamides Market and publishes its comprehensive annual report, highlighting emerging trends, growth drivers, revenue analysis, and forecast outlook. Our insights help businesses to make data-backed strategic decisions with ongoing market dynamics. Our analysts track relevent industries related to the Rwanda Polyamides Market, allowing our clients with actionable intelligence and reliable forecasts tailored to emerging regional needs.
Yes, we provide customisation as per your requirements. To learn more, feel free to contact us on sales@6wresearch.com
1 Executive Summary |
2 Introduction |
2.1 Key Highlights of the Report |
2.2 Report Description |
2.3 Market Scope & Segmentation |
2.4 Research Methodology |
2.5 Assumptions |
3 Rwanda Polyamides Market Overview |
3.1 Rwanda Country Macro Economic Indicators |
3.2 Rwanda Polyamides Market Revenues & Volume, 2021 & 2031F |
3.3 Rwanda Polyamides Market - Industry Life Cycle |
3.4 Rwanda Polyamides Market - Porter's Five Forces |
3.5 Rwanda Polyamides Market Revenues & Volume Share Segmentations, 2021 & 2031F |
3.6 Rwanda Polyamides Market Revenues & Volume Share, By Class, 2021 & 2031F |
3.7 Rwanda Polyamides Market Revenues & Volume Share, By Application, 2021 & 2031F |
3.8 Rwanda Polyamides Market Revenues & Volume Share, By End-use, 2021 & 2031F |
4 Rwanda Polyamides Market Dynamics |
4.1 Impact Analysis |
4.2 Market Drivers |
4.2.1 Increasing demand for lightweight and high-performance materials in industries such as automotive, aerospace, and electronics |
4.2.2 Growing focus on sustainability and eco-friendly materials, with polyamides being recyclable and having low carbon footprint |
4.2.3 Government initiatives and policies promoting industrial growth and investments in infrastructure |
4.3 Market Restraints |
4.3.1 Volatility in raw material prices, such as petrochemicals, impacting the production cost of polyamides |
4.3.2 Intense competition from substitute materials like polyesters and polyolefins |
4.3.3 Challenges related to the recycling and disposal of polyamides, leading to environmental concerns |
5 Rwanda Polyamides Market Trends |
6 Rwanda Polyamides Market Segmentations |
6.1 Rwanda Polyamides Market Segmentations |
6.1.1 Overview and Analysis |
6.1.2 Rwanda Polyamides Market Revenues & Volume, By PA 6, 2021-2031F |
6.1.3 Rwanda Polyamides Market Revenues & Volume, By PA 66, 2021-2031F |
6.1.4 Rwanda Polyamides Market Revenues & Volume, By Bio Polyamides & Specialty Polyamides, 2021-2031F |
6.2 Rwanda Polyamides Market, By Class |
6.2.1 Overview and Analysis |
6.2.2 Rwanda Polyamides Market Revenues & Volume, By Aliphatic Polyamides, 2021-2031F |
6.2.3 Rwanda Polyamides Market Revenues & Volume, By Semi-Aromatic & Aromatic Polyamides, 2021-2031F |
6.3 Rwanda Polyamides Market, By Application |
6.3.1 Overview and Analysis |
6.3.2 Rwanda Polyamides Market Revenues & Volume, By Fibers, 2021-2031F |
6.3.3 Rwanda Polyamides Market Revenues & Volume, By Wire & Cables, 2021-2031F |
6.3.4 Rwanda Polyamides Market Revenues & Volume, By 3D Printing, 2021-2031F |
6.3.5 Rwanda Polyamides Market Revenues & Volume, By Sports Equipment, 2021-2031F |
6.3.6 Rwanda Polyamides Market Revenues & Volume, By Engine Components, 2021-2031F |
6.3.7 Rwanda Polyamides Market Revenues & Volume, By Brakes & Transmission Parts, 2021-2031F |
6.4 Rwanda Polyamides Market, By End-use |
6.4.1 Overview and Analysis |
6.4.2 Rwanda Polyamides Market Revenues & Volume, By Automotive, 2021-2031F |
6.4.3 Rwanda Polyamides Market Revenues & Volume, By Electrical & Electronics, 2021-2031F |
6.4.4 Rwanda Polyamides Market Revenues & Volume, By Textile, 2021-2031F |
6.4.5 Rwanda Polyamides Market Revenues & Volume, By Aerospace & Defense, 2021-2031F |
6.4.6 Rwanda Polyamides Market Revenues & Volume, By Packaging, 2021-2031F |
6.4.7 Rwanda Polyamides Market Revenues & Volume, By Consumer Goods, 2021-2031F |
7 Rwanda Polyamides Market Import-Export Trade Statistics |
7.1 Rwanda Polyamides Market Export to Major Countries |
7.2 Rwanda Polyamides Market Imports from Major Countries |
8 Rwanda Polyamides Market Key Performance Indicators |
8.1 Rate of adoption of polyamides in new applications and industries |
8.2 Investment in research and development for enhancing the properties of polyamides |
8.3 Percentage of recycled content in polyamide products |
8.4 Number of partnerships and collaborations for expanding market reach and product innovation |
8.5 Regulatory compliance and certifications obtained for sustainability and product quality |
9 Rwanda Polyamides Market - Opportunity Assessment |
9.1 Rwanda Polyamides Market Opportunity Assessment Segmentations, 2021 & 2031F |
9.2 Rwanda Polyamides Market Opportunity Assessment, By Class, 2021 & 2031F |
9.3 Rwanda Polyamides Market Opportunity Assessment, By Application, 2021 & 2031F |
9.4 Rwanda Polyamides Market Opportunity Assessment, By End-use, 2021 & 2031F |
10 Rwanda Polyamides Market - Competitive Landscape |
10.1 Rwanda Polyamides Market Revenue Share, By Companies, 2024 |
10.2 Rwanda Polyamides Market Competitive Benchmarking, By Operating and Technical Parameters |
11 Company Profiles |
12 Recommendations | 13 Disclaimer |
Export potential assessment - trade Analytics for 2030
Export potential enables firms to identify high-growth global markets with greater confidence by combining advanced trade intelligence with a structured quantitative methodology. The framework analyzes emerging demand trends and country-level import patterns while integrating macroeconomic and trade datasets such as GDP and population forecasts, bilateral import–export flows, tariff structures, elasticity differentials between developed and developing economies, geographic distance, and import demand projections. Using weighted trade values from 2020–2024 as the base period to project country-to-country export potential for 2030, these inputs are operationalized through calculated drivers such as gravity model parameters, tariff impact factors, and projected GDP per-capita growth. Through an analysis of hidden potentials, demand hotspots, and market conditions that are most favorable to success, this method enables firms to focus on target countries, maximize returns, and global expansion with data, backed by accuracy.
By factoring in the projected importer demand gap that is currently unmet and could be potential opportunity, it identifies the potential for the Exporter (Country) among 190 countries, against the general trade analysis, which identifies the biggest importer or exporter.
To discover high-growth global markets and optimize your business strategy:
Click Here
Pricing
- Single User License$ 1,995
- Department License$ 2,400
- Site License$ 3,120
- Global License$ 3,795

Search
Thought Leadership and Analyst Meet


Our Clients
Latest Reports
- Philippines Polyhydroxybutyrate-co-Hydroxyvalerate Market (2026-2032) | Trends, Insights, Challenges, Restraints, Competition, Size, Value, Forecast, Pricing, Share, Outlook, Revenue, Investment Opportunities, Strategy, Drivers, Demand, Growth, segmentation, Analysis, Companies
- Peru Polyhydroxybutyrate-co-Hydroxyvalerate Market (2026-2032) | Growth, Demand, Challenges, Share, Trends, Analysis, Pricing, Investment Opportunities, Drivers, Value, Forecast, Competition, Size, Companies, Insights, Outlook, Restraints, segmentation, Revenue, Strategy
- Pakistan Polyhydroxybutyrate-co-Hydroxyvalerate Market (2026-2032) | Restraints, segmentation, Pricing, Forecast, Share, Strategy, Competition, Trends, Insights, Drivers, Challenges, Growth, Revenue, Outlook, Value, Investment Opportunities, Companies, Size, Analysis, Demand
- Oman Polyhydroxybutyrate-co-Hydroxyvalerate Market (2026-2032) | Drivers, segmentation, Insights, Competition, Pricing, Outlook, Size, Revenue, Challenges, Forecast, Analysis, Growth, Value, Share, Trends, Investment Opportunities, Strategy, Restraints, Companies, Demand
- Nigeria Polyhydroxybutyrate-co-Hydroxyvalerate Market (2026-2032) | Value, Investment Opportunities, Analysis, Revenue, Restraints, Pricing, Outlook, Competition, Demand, Growth, Forecast, Companies, Trends, Challenges, segmentation, Drivers, Insights, Share, Size, Strategy
- Nepal Polyhydroxybutyrate-co-Hydroxyvalerate Market (2026-2032) | Insights, Analysis, Drivers, Share, Revenue, Demand, segmentation, Investment Opportunities, Competition, Forecast, Growth, Pricing, Companies, Strategy, Trends, Restraints, Challenges, Outlook, Size, Value
- Myanmar Polyhydroxybutyrate-co-Hydroxyvalerate Market (2026-2032) | Outlook, Revenue, Strategy, Restraints, Drivers, segmentation, Share, Forecast, Competition, Insights, Growth, Pricing, Size, Demand, Value, Companies, Trends, Challenges, Investment Opportunities, Analysis
- Morocco Polyhydroxybutyrate-co-Hydroxyvalerate Market (2026-2032) | Outlook, Investment Opportunities, Restraints, Strategy, Forecast, Challenges, Drivers, Growth, Companies, segmentation, Trends, Size, Competition, Revenue, Demand, Insights, Share, Analysis, Value, Pricing
- Mexico Polyhydroxybutyrate-co-Hydroxyvalerate Market (2026-2032) | Size, Drivers, Outlook, Share, Strategy, Growth, Pricing, Challenges, Companies, Demand, Value, Investment Opportunities, Restraints, Trends, Forecast, segmentation, Analysis, Insights, Competition, Revenue
- Malaysia Polyhydroxybutyrate-co-Hydroxyvalerate Market (2026-2032) | Share, segmentation, Size, Companies, Analysis, Insights, Forecast, Value, Revenue, Drivers, Restraints, Challenges, Investment Opportunities, Trends, Competition, Strategy, Demand, Growth, Outlook, Pricing
Industry Events and Analyst Meet

HIMTEX 2026

India Refining Summit 2026

India EV Show 2026

EV tech India Expo 2026

Auto Tech Asia 2026
Whitepaper
- Middle East & Africa Commercial Security Market Click here to view more.
- Middle East & Africa Fire Safety Systems & Equipment Market Click here to view more.
- GCC Drone Market Click here to view more.
- Middle East Lighting Fixture Market Click here to view more.
- GCC Physical & Perimeter Security Market Click here to view more.
6WResearch In News
- Doha a strategic location for EV manufacturing hub: IPA Qatar
- Demand for luxury TVs surging in the GCC, says Samsung
- Empowering Growth: The Thriving Journey of Bangladesh’s Cable Industry
- Demand for luxury TVs surging in the GCC, says Samsung
- Video call with a traditional healer? Once unthinkable, it’s now common in South Africa
- Intelligent Buildings To Smooth GCC’s Path To Net Zero