Saint Lucia Phosphonates Market (2025-2031) | Companies, Trends, Segmentation, Forecast, Industry, Growth, Outlook, Size, Revenue, Value, Share & Analysis
Market Forecast By Product (ATMP, BHMT, HEDP, DTPMP, Others), By Function (Chemical Intermediates, Metal chelating agents, Scale Inhibitor, Bleach Stabilizer, Concrete Retarder, Others), By End-Use (Pharmaceutical, Water Treatment, Oil & Gas, Detergents & cleaning agents, Paper & Pulp, Textile, Agriculture, Others) And Competitive Landscape
| Product Code: ETC5301871 | Publication Date: Nov 2023 | Updated Date: Oct 2025 | Product Type: Market Research Report | |
| Publisher: 6Wresearch | Author: Ravi Bhandari | No. of Pages: 60 | No. of Figures: 30 | No. of Tables: 5 |
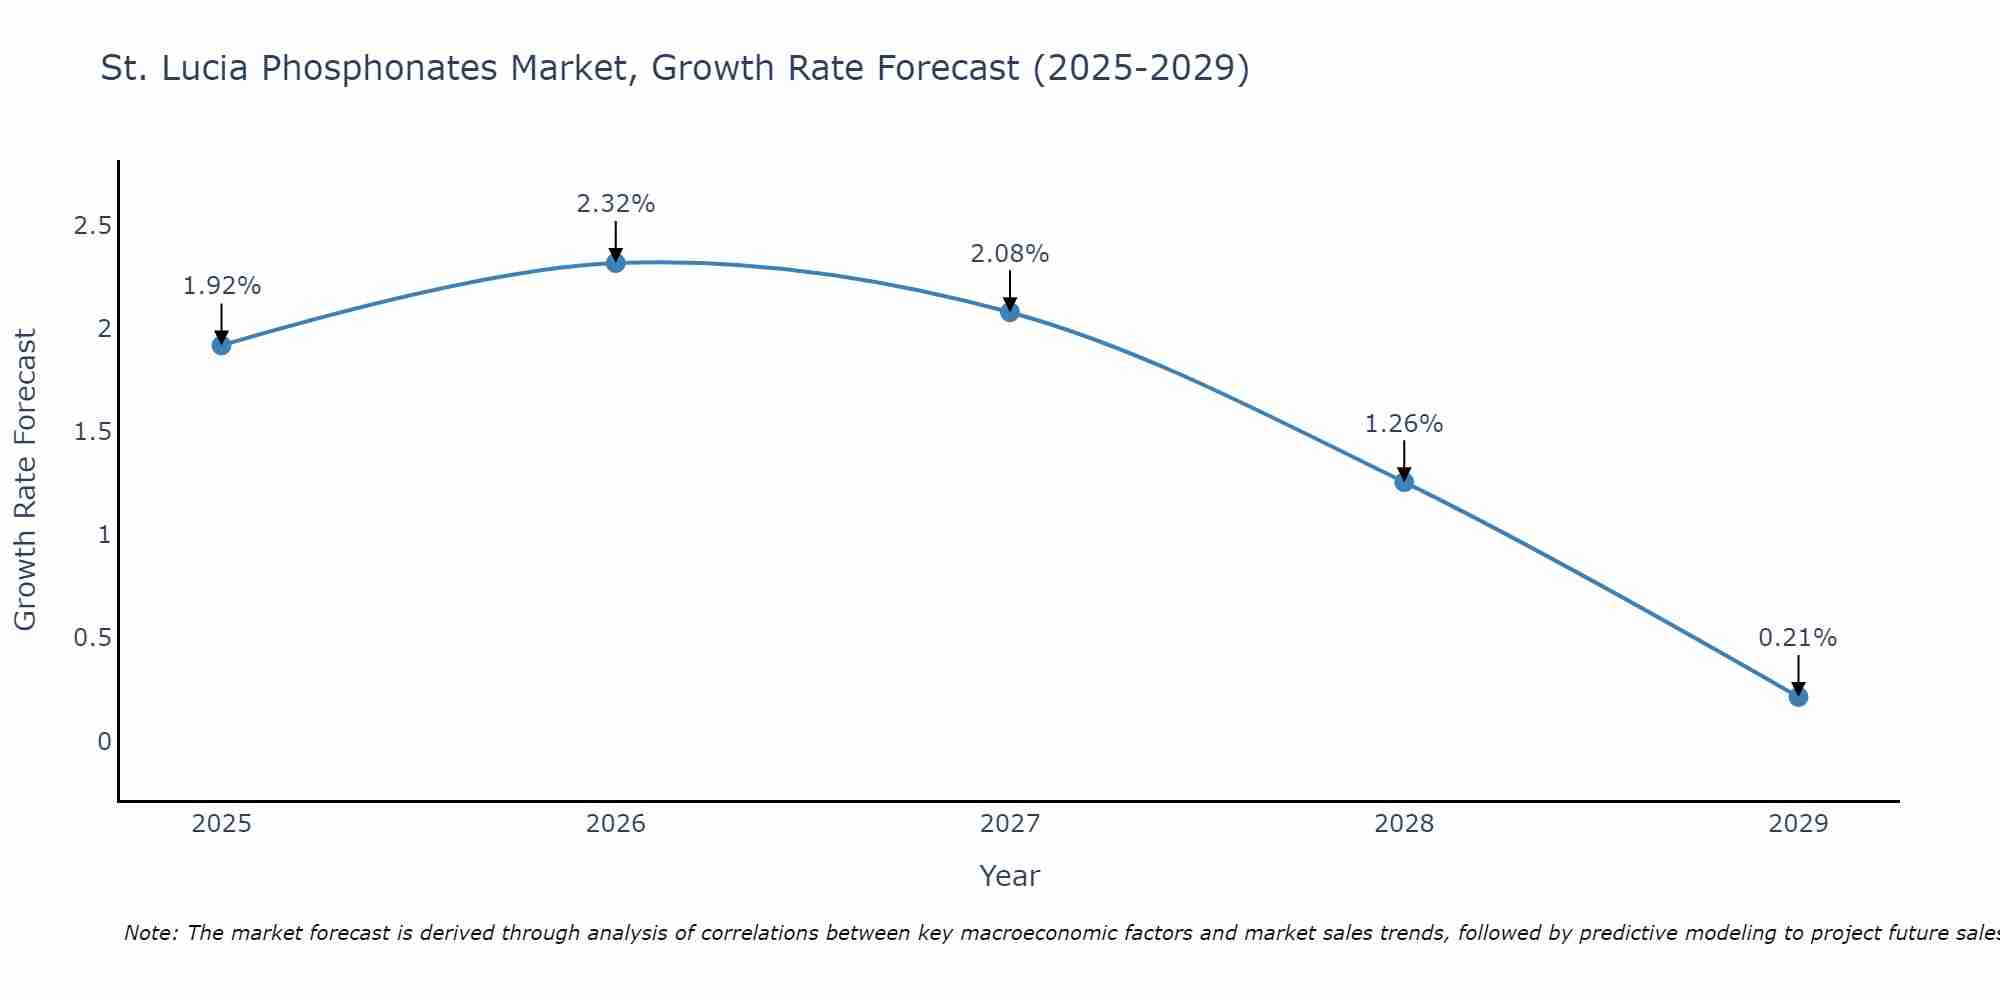
St. Lucia Phosphonates Market Size Growth Rate
The St. Lucia Phosphonates Market is projected to witness mixed growth rate patterns during 2025 to 2029. Growth accelerates to 2.32% in 2026, following an initial rate of 1.92%, before easing to 0.21% at the end of the period.
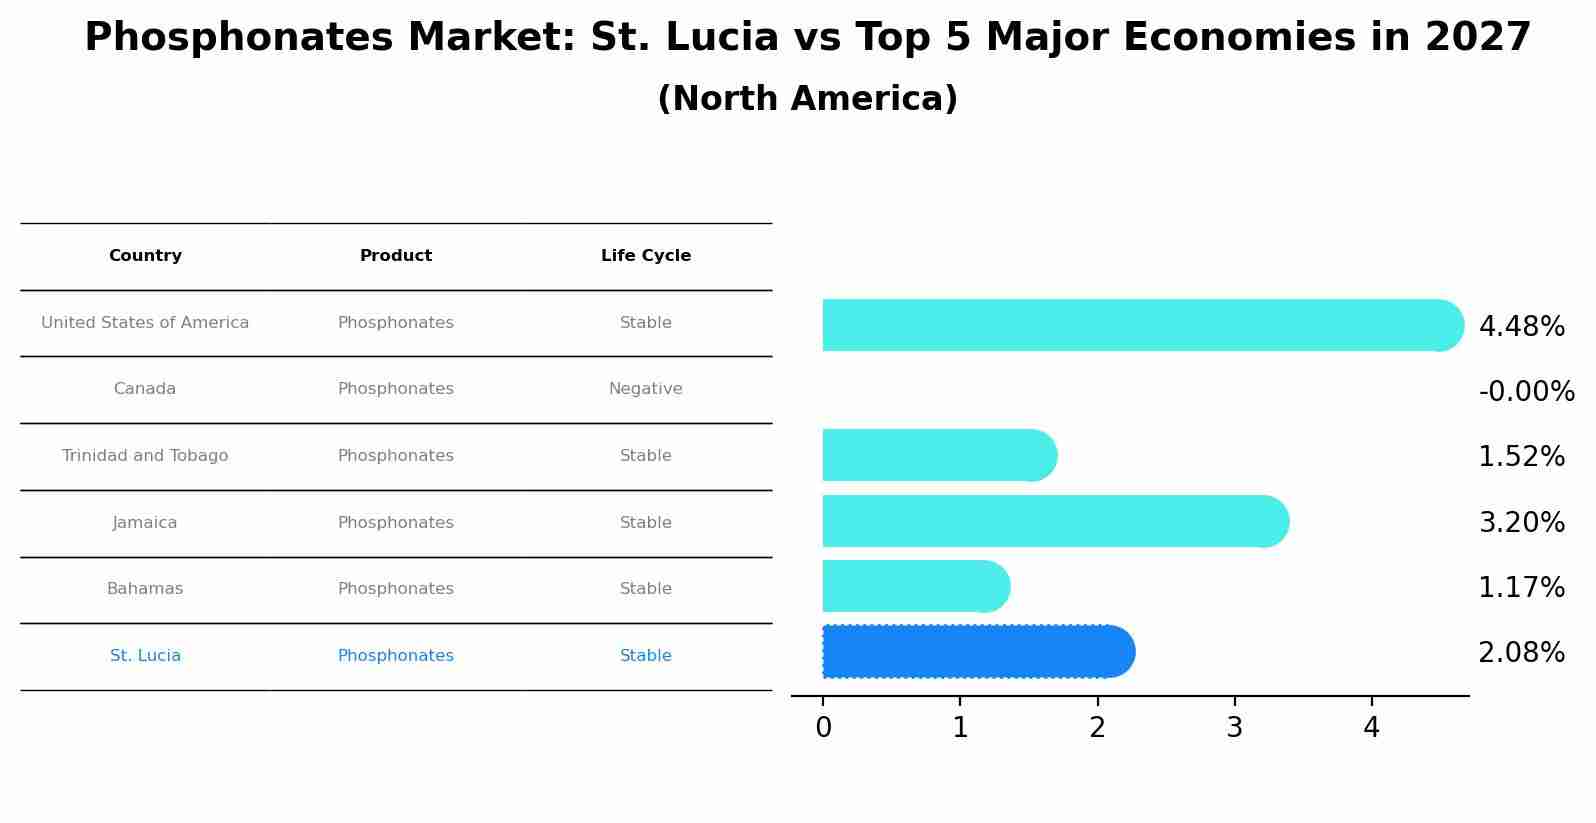
Phosphonates Market: St. Lucia vs Top 5 Major Economies in 2027 (North America)
By 2027, St. Lucia's Phosphonates market is forecasted to achieve a stable growth rate of 2.08%, with United States of America leading the North America region, followed by Canada, Trinidad and Tobago, Jamaica and Bahamas.
Key Highlights of the Report:
- Saint Lucia Phosphonates Market Outlook
- Market Size of Saint Lucia Phosphonates Market, 2024
- Forecast of Saint Lucia Phosphonates Market, 2031
- Historical Data and Forecast of Saint Lucia Phosphonates Revenues & Volume for the Period 2021-2031
- Saint Lucia Phosphonates Market Trend Evolution
- Saint Lucia Phosphonates Market Drivers and Challenges
- Saint Lucia Phosphonates Price Trends
- Saint Lucia Phosphonates Porter`s Five Forces
- Saint Lucia Phosphonates Industry Life Cycle
- Historical Data and Forecast of Saint Lucia Phosphonates Market Revenues & Volume By Product for the Period 2021-2031
- Historical Data and Forecast of Saint Lucia Phosphonates Market Revenues & Volume By ATMP for the Period 2021-2031
- Historical Data and Forecast of Saint Lucia Phosphonates Market Revenues & Volume By BHMT for the Period 2021-2031
- Historical Data and Forecast of Saint Lucia Phosphonates Market Revenues & Volume By HEDP for the Period 2021-2031
- Historical Data and Forecast of Saint Lucia Phosphonates Market Revenues & Volume By DTPMP for the Period 2021-2031
- Historical Data and Forecast of Saint Lucia Phosphonates Market Revenues & Volume By Others for the Period 2021-2031
- Historical Data and Forecast of Saint Lucia Phosphonates Market Revenues & Volume By Function for the Period 2021-2031
- Historical Data and Forecast of Saint Lucia Phosphonates Market Revenues & Volume By Chemical Intermediates for the Period 2021-2031
- Historical Data and Forecast of Saint Lucia Phosphonates Market Revenues & Volume By Metal chelating agents for the Period 2021-2031
- Historical Data and Forecast of Saint Lucia Phosphonates Market Revenues & Volume By Scale Inhibitor for the Period 2021-2031
- Historical Data and Forecast of Saint Lucia Phosphonates Market Revenues & Volume By Bleach Stabilizer for the Period 2021-2031
- Historical Data and Forecast of Saint Lucia Phosphonates Market Revenues & Volume By Concrete Retarder for the Period 2021-2031
- Historical Data and Forecast of Saint Lucia Phosphonates Market Revenues & Volume By Others for the Period 2021-2031
- Historical Data and Forecast of Saint Lucia Phosphonates Market Revenues & Volume By End-Use for the Period 2021-2031
- Historical Data and Forecast of Saint Lucia Phosphonates Market Revenues & Volume By Pharmaceutical for the Period 2021-2031
- Historical Data and Forecast of Saint Lucia Phosphonates Market Revenues & Volume By Water Treatment for the Period 2021-2031
- Historical Data and Forecast of Saint Lucia Phosphonates Market Revenues & Volume By Oil & Gas for the Period 2021-2031
- Historical Data and Forecast of Saint Lucia Phosphonates Market Revenues & Volume By Detergents & cleaning agents for the Period 2021-2031
- Historical Data and Forecast of Saint Lucia Phosphonates Market Revenues & Volume By Paper & Pulp for the Period 2021-2031
- Historical Data and Forecast of Saint Lucia Phosphonates Market Revenues & Volume By Textile for the Period 2021-2031
- Historical Data and Forecast of Saint Lucia Phosphonates Market Revenues & Volume By Agriculture for the Period 2021-2031
- Historical Data and Forecast of Saint Lucia Phosphonates Market Revenues & Volume By Others for the Period 2021-2031
- Saint Lucia Phosphonates Import Export Trade Statistics
- Market Opportunity Assessment By Product
- Market Opportunity Assessment By Function
- Market Opportunity Assessment By End-Use
- Saint Lucia Phosphonates Top Companies Market Share
- Saint Lucia Phosphonates Competitive Benchmarking By Technical and Operational Parameters
- Saint Lucia Phosphonates Company Profiles
- Saint Lucia Phosphonates Key Strategic Recommendations
Frequently Asked Questions About the Market Study (FAQs):
6Wresearch actively monitors the Saint Lucia Phosphonates Market and publishes its comprehensive annual report, highlighting emerging trends, growth drivers, revenue analysis, and forecast outlook. Our insights help businesses to make data-backed strategic decisions with ongoing market dynamics. Our analysts track relevent industries related to the Saint Lucia Phosphonates Market, allowing our clients with actionable intelligence and reliable forecasts tailored to emerging regional needs.
Yes, we provide customisation as per your requirements. To learn more, feel free to contact us on sales@6wresearch.com
1 Executive Summary |
2 Introduction |
2.1 Key Highlights of the Report |
2.2 Report Description |
2.3 Market Scope & Segmentation |
2.4 Research Methodology |
2.5 Assumptions |
3 Saint Lucia Phosphonates Market Overview |
3.1 Saint Lucia Country Macro Economic Indicators |
3.2 Saint Lucia Phosphonates Market Revenues & Volume, 2021 & 2031F |
3.3 Saint Lucia Phosphonates Market - Industry Life Cycle |
3.4 Saint Lucia Phosphonates Market - Porter's Five Forces |
3.5 Saint Lucia Phosphonates Market Revenues & Volume Share, By Product, 2021 & 2031F |
3.6 Saint Lucia Phosphonates Market Revenues & Volume Share, By Function, 2021 & 2031F |
3.7 Saint Lucia Phosphonates Market Revenues & Volume Share, By End-Use, 2021 & 2031F |
4 Saint Lucia Phosphonates Market Dynamics |
4.1 Impact Analysis |
4.2 Market Drivers |
4.2.1 Increasing demand for phosphonates in agriculture and water treatment industries due to their effectiveness in controlling scale and corrosion. |
4.2.2 Growing awareness about the benefits of using phosphonates in personal care and household cleaning products. |
4.2.3 Favorable government regulations and policies promoting the use of phosphonates in various applications. |
4.3 Market Restraints |
4.3.1 Fluctuating prices of raw materials used in the production of phosphonates. |
4.3.2 Environmental concerns related to the discharge of phosphonates into water bodies. |
4.3.3 Competition from alternative chemicals and substitutes in the market. |
5 Saint Lucia Phosphonates Market Trends |
6 Saint Lucia Phosphonates Market Segmentations |
6.1 Saint Lucia Phosphonates Market, By Product |
6.1.1 Overview and Analysis |
6.1.2 Saint Lucia Phosphonates Market Revenues & Volume, By ATMP, 2021-2031F |
6.1.3 Saint Lucia Phosphonates Market Revenues & Volume, By BHMT, 2021-2031F |
6.1.4 Saint Lucia Phosphonates Market Revenues & Volume, By HEDP, 2021-2031F |
6.1.5 Saint Lucia Phosphonates Market Revenues & Volume, By DTPMP, 2021-2031F |
6.1.6 Saint Lucia Phosphonates Market Revenues & Volume, By Others, 2021-2031F |
6.2 Saint Lucia Phosphonates Market, By Function |
6.2.1 Overview and Analysis |
6.2.2 Saint Lucia Phosphonates Market Revenues & Volume, By Chemical Intermediates, 2021-2031F |
6.2.3 Saint Lucia Phosphonates Market Revenues & Volume, By Metal chelating agents, 2021-2031F |
6.2.4 Saint Lucia Phosphonates Market Revenues & Volume, By Scale Inhibitor, 2021-2031F |
6.2.5 Saint Lucia Phosphonates Market Revenues & Volume, By Bleach Stabilizer, 2021-2031F |
6.2.6 Saint Lucia Phosphonates Market Revenues & Volume, By Concrete Retarder, 2021-2031F |
6.2.7 Saint Lucia Phosphonates Market Revenues & Volume, By Others, 2021-2031F |
6.3 Saint Lucia Phosphonates Market, By End-Use |
6.3.1 Overview and Analysis |
6.3.2 Saint Lucia Phosphonates Market Revenues & Volume, By Pharmaceutical, 2021-2031F |
6.3.3 Saint Lucia Phosphonates Market Revenues & Volume, By Water Treatment, 2021-2031F |
6.3.4 Saint Lucia Phosphonates Market Revenues & Volume, By Oil & Gas, 2021-2031F |
6.3.5 Saint Lucia Phosphonates Market Revenues & Volume, By Detergents & cleaning agents, 2021-2031F |
6.3.6 Saint Lucia Phosphonates Market Revenues & Volume, By Paper & Pulp, 2021-2031F |
6.3.7 Saint Lucia Phosphonates Market Revenues & Volume, By Textile, 2021-2031F |
6.3.8 Saint Lucia Phosphonates Market Revenues & Volume, By Others, 2021-2031F |
6.3.9 Saint Lucia Phosphonates Market Revenues & Volume, By Others, 2021-2031F |
7 Saint Lucia Phosphonates Market Import-Export Trade Statistics |
7.1 Saint Lucia Phosphonates Market Export to Major Countries |
7.2 Saint Lucia Phosphonates Market Imports from Major Countries |
8 Saint Lucia Phosphonates Market Key Performance Indicators |
8.1 Research and development investment in new phosphonate formulations and applications. |
8.2 Number of patents filed for phosphonate-related technologies and products. |
9 Saint Lucia Phosphonates Market - Opportunity Assessment |
9.1 Saint Lucia Phosphonates Market Opportunity Assessment, By Product, 2021 & 2031F |
9.2 Saint Lucia Phosphonates Market Opportunity Assessment, By Function, 2021 & 2031F |
9.3 Saint Lucia Phosphonates Market Opportunity Assessment, By End-Use, 2021 & 2031F |
10 Saint Lucia Phosphonates Market - Competitive Landscape |
10.1 Saint Lucia Phosphonates Market Revenue Share, By Companies, 2024 |
10.2 Saint Lucia Phosphonates Market Competitive Benchmarking, By Operating and Technical Parameters |
11 Company Profiles |
12 Recommendations | 13 Disclaimer |
Export potential assessment - trade Analytics for 2030
Export potential enables firms to identify high-growth global markets with greater confidence by combining advanced trade intelligence with a structured quantitative methodology. The framework analyzes emerging demand trends and country-level import patterns while integrating macroeconomic and trade datasets such as GDP and population forecasts, bilateral import–export flows, tariff structures, elasticity differentials between developed and developing economies, geographic distance, and import demand projections. Using weighted trade values from 2020–2024 as the base period to project country-to-country export potential for 2030, these inputs are operationalized through calculated drivers such as gravity model parameters, tariff impact factors, and projected GDP per-capita growth. Through an analysis of hidden potentials, demand hotspots, and market conditions that are most favorable to success, this method enables firms to focus on target countries, maximize returns, and global expansion with data, backed by accuracy.
By factoring in the projected importer demand gap that is currently unmet and could be potential opportunity, it identifies the potential for the Exporter (Country) among 190 countries, against the general trade analysis, which identifies the biggest importer or exporter.
To discover high-growth global markets and optimize your business strategy:
Click Here
Pricing
- Single User License$ 1,995
- Department License$ 2,400
- Site License$ 3,120
- Global License$ 3,795

Search
Thought Leadership and Analyst Meet


Our Clients
Latest Reports
- China Electric Appliance Rental Market (2026-2032) | Trends, Revenue, Growth, Challenges, Size, Value, Outlook, Pricing, Strategy, Insights, Restraints, segmentation, Companies, Investment Opportunities, Analysis, Demand, Drivers, Competition, Forecast, Share
- Chile Electric Appliance Rental Market (2026-2032) | Outlook, Competition, Drivers, Strategy, Revenue, Analysis, Value, Pricing, Restraints, Size, Demand, Share, Growth, Forecast, Challenges, Insights, Investment Opportunities, Companies, Trends, segmentation
- Cambodia Electric Appliance Rental Market (2026-2032) | Companies, Analysis, Restraints, Pricing, Insights, Challenges, Outlook, Strategy, Forecast, Trends, Competition, Value, Revenue, Investment Opportunities, segmentation, Drivers, Size, Demand, Growth, Share
- Brazil Electric Appliance Rental Market (2026-2032) | Revenue, Strategy, Forecast, Companies, segmentation, Competition, Size, Investment Opportunities, Pricing, Restraints, Outlook, Challenges, Analysis, Drivers, Value, Demand, Insights, Trends, Growth, Share
- Bangladesh Electric Appliance Rental Market (2026-2032) | Drivers, Forecast, Investment Opportunities, Strategy, Insights, Demand, Challenges, Outlook, Trends, Competition, Value, Revenue, Size, Pricing, Analysis, Companies, Restraints, segmentation, Share, Growth
- Bahrain Electric Appliance Rental Market (2026-2032) | Outlook, Size, Competition, Restraints, Drivers, Value, Trends, Investment Opportunities, Insights, Forecast, Revenue, Strategy, Growth, Share, Demand, Analysis, Challenges, Companies, segmentation, Pricing
- Azerbaijan Electric Appliance Rental Market (2026-2032) | Trends, Investment Opportunities, Restraints, Insights, Strategy, Competition, Value, Growth, Demand, Drivers, Analysis, Forecast, Size, Share, Outlook, segmentation, Pricing, Challenges, Revenue, Companies
- Australia Electric Appliance Rental Market (2026-2032) | Challenges, Restraints, Forecast, Demand, Size, Competition, Pricing, Investment Opportunities, Revenue, Trends, Drivers, Growth, Outlook, Analysis, Strategy, Value, segmentation, Insights, Companies, Share
- Argentina Electric Appliance Rental Market (2026-2032) | Growth, Trends, Insights, Outlook, Forecast, Size, Drivers, Analysis, Restraints, Challenges, Share, Revenue, Investment Opportunities, Strategy, Demand, Value, Companies, segmentation, Competition, Pricing
- Algeria Electric Appliance Rental Market (2026-2032) | Share, Size, Value, Strategy, Competition, Outlook, Challenges, Companies, Trends, Pricing, Insights, Forecast, Investment Opportunities, Revenue, Growth, Restraints, segmentation, Analysis, Demand, Drivers
Industry Events and Analyst Meet

HIMTEX 2026

India Refining Summit 2026

India EV Show 2026

EV tech India Expo 2026

Auto Tech Asia 2026
Whitepaper
- Middle East & Africa Commercial Security Market Click here to view more.
- Middle East & Africa Fire Safety Systems & Equipment Market Click here to view more.
- GCC Drone Market Click here to view more.
- Middle East Lighting Fixture Market Click here to view more.
- GCC Physical & Perimeter Security Market Click here to view more.
6WResearch In News
- Doha a strategic location for EV manufacturing hub: IPA Qatar
- Demand for luxury TVs surging in the GCC, says Samsung
- Empowering Growth: The Thriving Journey of Bangladesh’s Cable Industry
- Demand for luxury TVs surging in the GCC, says Samsung
- Video call with a traditional healer? Once unthinkable, it’s now common in South Africa
- Intelligent Buildings To Smooth GCC’s Path To Net Zero