Saudi Arabia Interactive Tables Market (2026-2032) Outlook | Trends, Forecast, Companies, Value, Analysis, Industry, Share, Growth, Revenue & Size
Market Forecast By Technology (LCD, LED, Capacitive, Others), By Screen Size (32-65 Inch, 65 Inch & Above), By Application (Exhibition & Trade Shows, Education, Retail, Control Room, Hospitality, Transportation, Others) And Competitive Landscape
| Product Code: ETC275079 | Publication Date: Aug 2022 | Updated Date: Jul 2026 | Product Type: Market Research Report | |
| Publisher: 6Wresearch | Author: Ravi Bhandari | No. of Pages: 75 | No. of Figures: 35 | No. of Tables: 20 |
Saudi Arabia Interactive Tables Market Size, Share & Growth Rate
The Saudi Arabia Interactive Tables Market was estimated at USD 403 Million in 2025 and is projected to reach USD 516 Million by 2032, growing at a CAGR of 3.6% from 2026 to 2032. This growth trajectory is propelled by the increasing digitalization across various sectors, coupled with an escalating demand for immersive and engaging customer experiences. As businesses in hospitality, education, and retail embrace interactive solutions, the market is positioned for substantial expansion.
Saudi Arabia Interactive Tables Market Year-wise Growth Rate and Key Drivers
This graph highlights how the Saudi Arabia Interactive Tables Market has steadily grown over the years, supported by major growth factors.
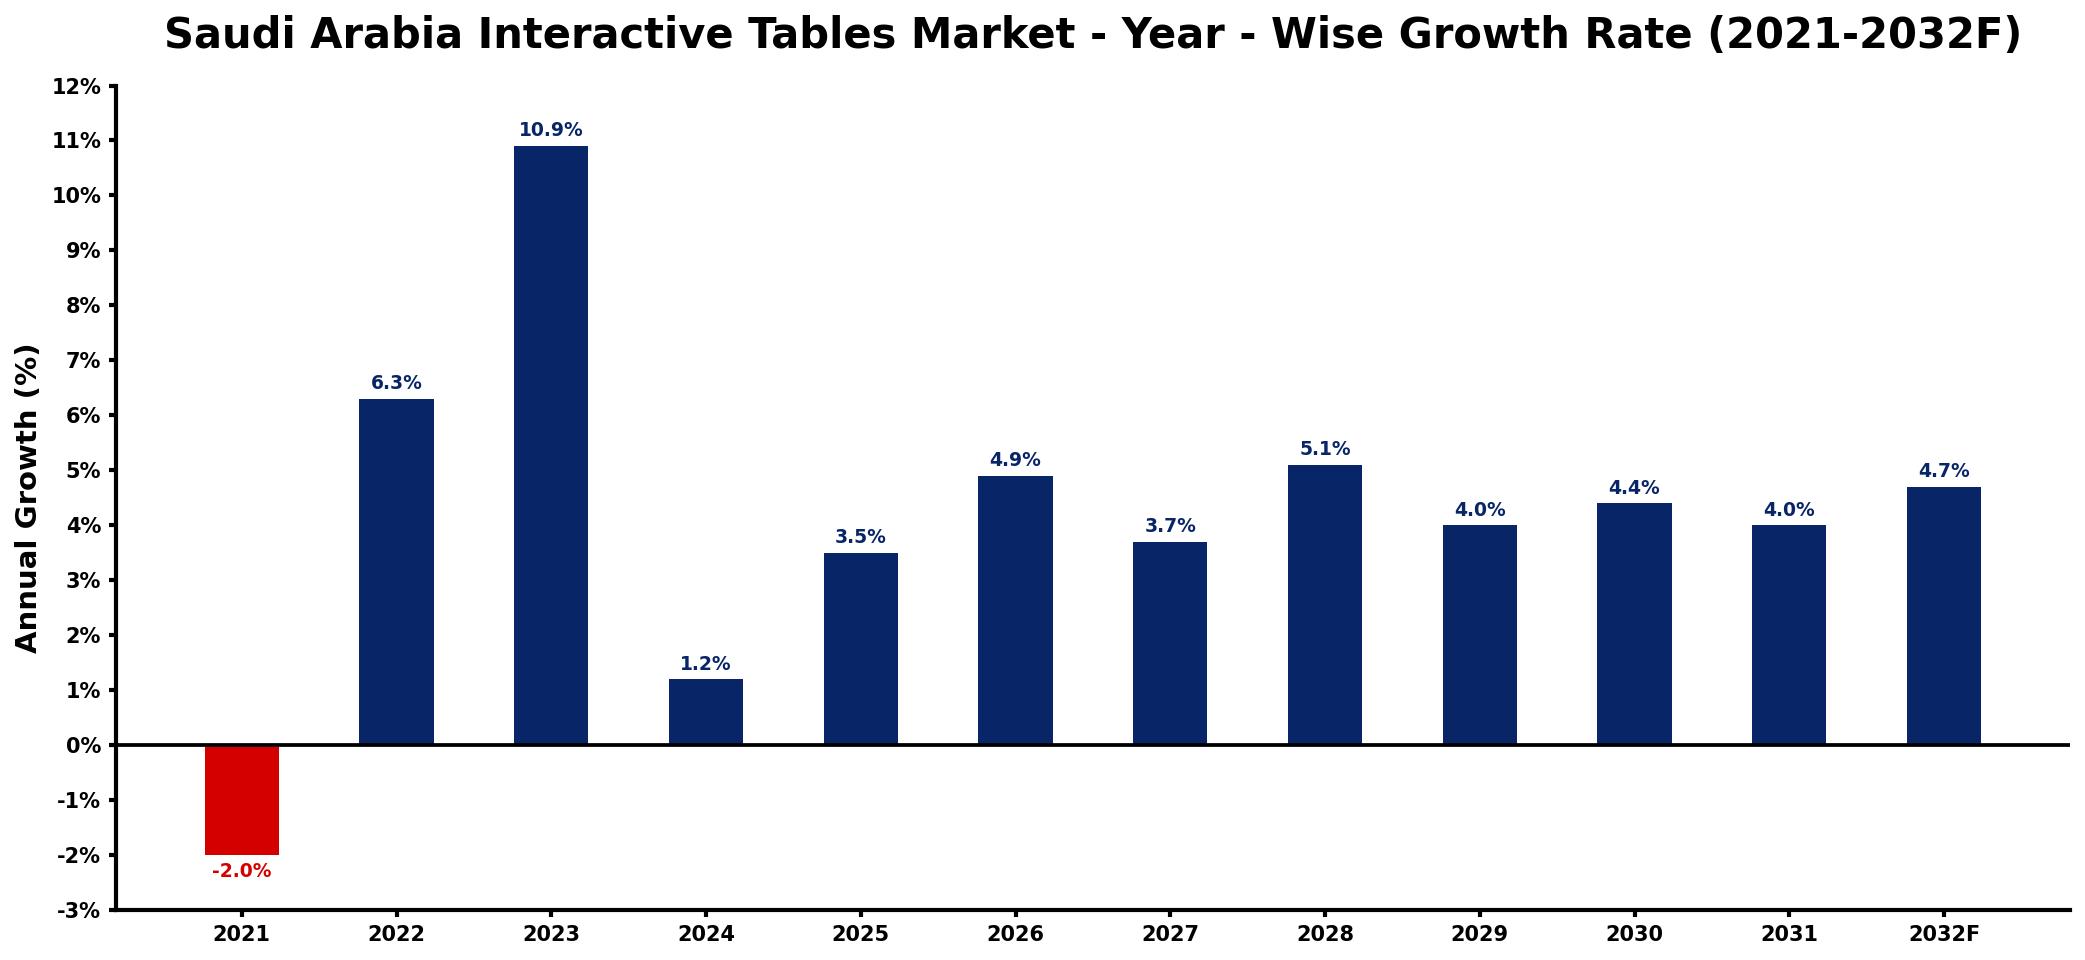
The table below presents the year‑wise growth rates along with the key drivers influencing the market
| Year | Growth Rate | Major Drivers |
| 2021 | -2.0% | decreased investments in technology sector |
| 2022 | 6.3% | growing demand for smart solutions |
| 2023 | 10.9% | increased adoption in education sector |
| 2024 | 1.2% | expansion of digital signage applications |
| 2025 | 3.5% | rising interest in hospitality innovations |
| 2026 | 4.9% | enhanced focus on customer engagement |
| 2027 | 3.7% | growth in corporate training programs |
| 2028 | 5.1% | emerging trends in event management |
| 2029 | 4.0% | increased integration in retail environments |
| 2030 | 4.4% | rising end-use demand growth |
| 2031 | 4.0% | growing popularity in entertainment venues |
| 2032 | 4.7% | rising demand for collaborative spaces |
Note: Market size estimations and growth projections presented in this report are based on 6Wresearch's proprietary forecasting methodology, utilizing the latest available industry data, government publications, and primary research inputs.
Saudi Arabia Interactive Tables Market Synopsis
A pivotal force reshaping the Saudi Arabia Interactive Tables Market is the rapid integration of technology into everyday business operations. This trend is fueled by a tech-savvy youth demographic that prefers interactive and visually stimulating environments. Businesses, aiming to enhance consumer engagement, are increasingly adopting interactive tables to provide memorable experiences.
Additionally, the push for innovative customer engagement strategies in sectors like education and hospitality is further driving demand. The influence of government initiatives promoting smart infrastructure and technological innovation plays a critical role in fostering an environment conducive to market growth.
Saudi Arabia Interactive Tables Market Key Takeaways
- The market is experiencing a consistent upward trajectory, driven by technological integration across various industries.
- Younger generations are particularly influencing the demand for interactive experiences, especially in public and commercial spaces.
- Government support for technological innovation significantly bolsters market opportunities.
- Businesses are increasingly recognizing the strategic value of interactive tables in enhancing customer engagement.
- Investment in research and development is critical for manufacturers to stay competitive amidst evolving market trends.
Evaluation of Restraints in Saudi Arabia Interactive Tables Market
Despite the promising growth outlook, the Saudi Arabia Interactive Tables Market is not without its challenges. Competition from alternative interactive technologies, such as augmented reality displays and conventional touchscreen solutions, poses a notable threat. These alternatives often provide unique user experiences that can overshadow traditional interactive tables. Additionally, ensuring seamless integration with existing software and hardware remains a challenge for manufacturers, necessitating investments in user experience design and technology development.
Saudi Arabia Interactive Tables Market Trends
Current trends in the Saudi Arabia Interactive Tables Market include the increasing emphasis on collaborative learning environments in educational institutions. More schools and universities are integrating interactive tables to facilitate group work and interactive lessons. Furthermore, the rise of experiential dining in restaurants is prompting establishments to adopt these tables to enhance customer interaction. These trends point towards a burgeoning demand for solutions that encourage engagement and collaboration across multiple sectors.
Saudi Arabia Interactive Tables Market Opportunities
The Saudi Arabia Interactive Tables Market presents numerous growth and investment opportunities, particularly in the educational and hospitality sectors. Educational institutions are increasingly looking to modernize their teaching methods, presenting a ripe opportunity for interactive table providers. Moreover, restaurants are leaning into technology to create engaging dining experiences, further enhancing the appeal of interactive tables. Companies that innovate and offer customized solutions tailored to specific applications can tap into a lucrative market potential.
Government Initiatives in the Saudi Arabia Interactive Tables Market
The Saudi government is actively supporting technological advancement through various initiatives aimed at fostering smart infrastructure development. These initiatives encourage investments in digital solutions across sectors like education and hospitality, thereby creating an environment conducive to the growth of the interactive tables market. Public spending on technology and innovation is expected to further enhance the attractiveness of interactive solutions, benefiting businesses and consumers alike.
Future Insights of the Saudi Arabia Interactive Tables Market
Looking ahead to the period from 2026 to 2032, the Saudi Arabia Interactive Tables Market is expected to evolve significantly, influenced by continuous technological advancements and shifting consumer preferences. As industries prioritize enhancing customer engagement, interactive tables are likely to become indispensable tools in various applications. The focus on digital solutions will further solidify the role of interactive tables as essential components of modern business strategies, paving the way for sustained market growth.
Saudi Arabia Interactive Tables Market Latest Developments (2025 - 2026)
Recent industry trends indicate a growing interest in integrating AI and machine learning technologies into interactive tables, enhancing their functionality and user experience. There is also a notable surge in collaborations among technology firms and educational institutions to develop custom interactive solutions that address specific needs. As businesses adapt to post-pandemic dynamics, the focus on hybrid learning and interactive customer experiences remains strong, signaling a positive direction for the market.
Saudi Arabia Interactive Tables Market - Key Attractiveness of the Report
- 10 Years of Market Numbers
- Historical Data Starting from 2022 to 2025
- Base Year: 2025
- Forecast Data until 2032
- Key Performance Indicators Impacting the Market
- Major Upcoming Developments and Projects
Key Highlights of the Report:
- Saudi Arabia Interactive Tables Market Outlook
- Market Size of Saudi Arabia Interactive Tables Market, 2025
- Forecast of Saudi Arabia Interactive Tables Market, 2032
- Historical Data and Forecast of Saudi Arabia Interactive Tables Revenues & Volume for the Period 2022-2032F
- Saudi Arabia Interactive Tables Market Trend Evolution
- Saudi Arabia Interactive Tables Market Drivers and Challenges
- Saudi Arabia Interactive Tables Price Trends
- Saudi Arabia Interactive Tables Porter's Five Forces
- Saudi Arabia Interactive Tables Industry Life Cycle
- Historical Data and Forecast of Saudi Arabia Interactive Tables Market Revenues & Volume By Technology for the Period 2022-2032F
- Historical Data and Forecast of Saudi Arabia Interactive Tables Market Revenues & Volume By LCD for the Period 2022-2032F
- Historical Data and Forecast of Saudi Arabia Interactive Tables Market Revenues & Volume By LED for the Period 2022-2032F
- Historical Data and Forecast of Saudi Arabia Interactive Tables Market Revenues & Volume By Capacitive for the Period 2022-2032F
- Historical Data and Forecast of Saudi Arabia Interactive Tables Market Revenues & Volume By Others for the Period 2022-2032F
- Historical Data and Forecast of Saudi Arabia Interactive Tables Market Revenues & Volume By Screen Size for the Period 2022-2032F
- Historical Data and Forecast of Saudi Arabia Interactive Tables Market Revenues & Volume By 32-65 Inch for the Period 2022-2032F
- Historical Data and Forecast of Saudi Arabia Interactive Tables Market Revenues & Volume By 65 Inch & Above for the Period 2022-2032F
- Historical Data and Forecast of Saudi Arabia Interactive Tables Market Revenues & Volume By Application for the Period 2022-2032F
- Historical Data and Forecast of Saudi Arabia Interactive Tables Market Revenues & Volume By Exhibition & Trade Shows for the Period 2022-2032F
- Historical Data and Forecast of Saudi Arabia Interactive Tables Market Revenues & Volume By Education for the Period 2022-2032F
- Historical Data and Forecast of Saudi Arabia Interactive Tables Market Revenues & Volume By Retail for the Period 2022-2032F
- Historical Data and Forecast of Saudi Arabia Interactive Tables Market Revenues & Volume By Control Room for the Period 2022-2032F
- Historical Data and Forecast of Saudi Arabia Interactive Tables Market Revenues & Volume By Hospitality for the Period 2022-2032F
- Historical Data and Forecast of Saudi Arabia Interactive Tables Market Revenues & Volume By Transportation for the Period 2022-2032F
- Historical Data and Forecast of Saudi Arabia Interactive Tables Market Revenues & Volume By Others for the Period 2022-2032F
- Saudi Arabia Interactive Tables Import Export Trade Statistics
- Market Opportunity Assessment By Technology
- Market Opportunity Assessment By Screen Size
- Market Opportunity Assessment By Application
- Saudi Arabia Interactive Tables Top Companies Market Share
- Saudi Arabia Interactive Tables Competitive Benchmarking By Technical and Operational Parameters
- Saudi Arabia Interactive Tables Company Profiles
- Saudi Arabia Interactive Tables Key Strategic Recommendations
Frequently Asked Questions About the Market Study (FAQs):
The growth is primarily driven by increased digitalization across sectors, a rising demand for immersive customer experiences, and a tech-savvy population favoring innovative solutions.
The market was estimated at USD 403 Million in 2025 and is projected to reach USD 516 Million by 2032, growing at a CAGR of 3.6% from 2026 to 2032.
The hospitality, education, and retail sectors are at the forefront of adopting interactive tables, utilizing them to enhance customer engagement and learning experiences.
Government initiatives supporting technological innovation and smart infrastructure are crucial for encouraging investments and growth in the interactive tables market.
Emerging trends include the integration of AI technologies into interactive tables and a focus on collaborative learning environments in educational settings.
6Wresearch actively monitors the Saudi Arabia Interactive Tables Market and publishes its comprehensive annual report, highlighting emerging trends, growth drivers, revenue analysis, and forecast outlook. Our insights help businesses to make data-backed strategic decisions with ongoing market dynamics. Our analysts track relevent industries related to the Saudi Arabia Interactive Tables Market, allowing our clients with actionable intelligence and reliable forecasts tailored to emerging regional needs.
Yes, we provide customisation as per your requirements. To learn more, feel free to contact us on sales@6wresearch.com
1 Executive Summary |
2 Introduction |
2.1 Key Highlights of the Report |
2.2 Report Description |
2.3 Market Scope & Segmentation |
2.4 Research Methodology |
2.5 Assumptions |
3 Saudi Arabia Interactive Tables Market Overview |
3.1 Saudi Arabia Country Macro Economic Indicators |
3.2 Saudi Arabia Interactive Tables Market Revenues & Volume, 2022 & 2032F |
3.3 Saudi Arabia Interactive Tables Market - Industry Life Cycle |
3.4 Saudi Arabia Interactive Tables Market - Porter's Five Forces |
3.5 Saudi Arabia Interactive Tables Market Revenues & Volume Share, By Technology, 2022 & 2032F |
3.6 Saudi Arabia Interactive Tables Market Revenues & Volume Share, By Screen Size, 2022 & 2032F |
3.7 Saudi Arabia Interactive Tables Market Revenues & Volume Share, By Application, 2022 & 2032F |
4 Saudi Arabia Interactive Tables Market Dynamics |
4.1 Impact Analysis |
4.2 Market Drivers |
4.2.1 Technological advancements in interactive table features and functionalities |
4.2.2 Increasing demand for interactive solutions in educational institutions and corporate settings |
4.2.3 Growing adoption of interactive tables for enhanced customer engagement and experience |
4.3 Market Restraints |
4.3.1 High initial investment and maintenance costs associated with interactive tables |
4.3.2 Limited awareness and understanding of interactive table benefits among potential users |
4.3.3 Potential cybersecurity risks and data privacy concerns associated with interactive table usage |
5 Saudi Arabia Interactive Tables Market Trends |
6 Saudi Arabia Interactive Tables Market, By Types |
6.1 Saudi Arabia Interactive Tables Market, By Technology |
6.1.1 Overview and Analysis |
6.1.2 Saudi Arabia Interactive Tables Market Revenues & Volume, By Technology, 2022-2032F |
6.1.3 Saudi Arabia Interactive Tables Market Revenues & Volume, By LCD, 2022-2032F |
6.1.4 Saudi Arabia Interactive Tables Market Revenues & Volume, By LED, 2022-2032F |
6.1.5 Saudi Arabia Interactive Tables Market Revenues & Volume, By Capacitive, 2022-2032F |
6.1.6 Saudi Arabia Interactive Tables Market Revenues & Volume, By Others, 2022-2032F |
6.2 Saudi Arabia Interactive Tables Market, By Screen Size |
6.2.1 Overview and Analysis |
6.2.2 Saudi Arabia Interactive Tables Market Revenues & Volume, By 32-65 Inch, 2022-2032F |
6.2.3 Saudi Arabia Interactive Tables Market Revenues & Volume, By 65 Inch & Above, 2022-2032F |
6.3 Saudi Arabia Interactive Tables Market, By Application |
6.3.1 Overview and Analysis |
6.3.2 Saudi Arabia Interactive Tables Market Revenues & Volume, By Exhibition & Trade Shows, 2022-2032F |
6.3.3 Saudi Arabia Interactive Tables Market Revenues & Volume, By Education, 2022-2032F |
6.3.4 Saudi Arabia Interactive Tables Market Revenues & Volume, By Retail, 2022-2032F |
6.3.5 Saudi Arabia Interactive Tables Market Revenues & Volume, By Control Room, 2022-2032F |
6.3.6 Saudi Arabia Interactive Tables Market Revenues & Volume, By Hospitality, 2022-2032F |
6.3.7 Saudi Arabia Interactive Tables Market Revenues & Volume, By Transportation, 2022-2032F |
7 Saudi Arabia Interactive Tables Market Import-Export Trade Statistics |
7.1 Saudi Arabia Interactive Tables Market Export to Major Countries |
7.2 Saudi Arabia Interactive Tables Market Imports from Major Countries |
8 Saudi Arabia Interactive Tables Market Key Performance Indicators |
8.1 Average time spent by users engaging with interactive tables |
8.2 Number of interactive table installations in educational institutions and corporate offices |
8.3 Rate of adoption of interactive tables in new market segments |
9 Saudi Arabia Interactive Tables Market - Opportunity Assessment |
9.1 Saudi Arabia Interactive Tables Market Opportunity Assessment, By Technology, 2022 & 2032F |
9.2 Saudi Arabia Interactive Tables Market Opportunity Assessment, By Screen Size, 2022 & 2032F |
9.3 Saudi Arabia Interactive Tables Market Opportunity Assessment, By Application, 2022 & 2032F |
10 Saudi Arabia Interactive Tables Market - Competitive Landscape |
10.1 Saudi Arabia Interactive Tables Market Revenue Share, By Companies, 2025 |
10.2 Saudi Arabia Interactive Tables Market Competitive Benchmarking, By Operating and Technical Parameters |
11 Company Profiles |
12 Recommendations |
13 Disclaimer |
Global Go To Market Strategy - 2030
Export potential enables firms to identify high-growth global markets with greater confidence by combining advanced trade intelligence with a structured quantitative methodology. The framework analyzes emerging demand trends and country-level import patterns while integrating macroeconomic and trade datasets such as GDP and population forecasts, bilateral import–export flows, tariff structures, elasticity differentials between developed and developing economies, geographic distance, and import demand projections. Using weighted trade values from 2020–2024 as the base period to project country-to-country export potential for 2030, these inputs are operationalized through calculated drivers such as gravity model parameters, tariff impact factors, and projected GDP per-capita growth. Through an analysis of hidden potentials, demand hotspots, and market conditions that are most favorable to success, this method enables firms to focus on target countries, maximize returns, and global expansion with data, backed by accuracy.
By factoring in the projected importer demand gap that is currently unmet and could be potential opportunity, it identifies the potential for the Exporter (Country) among 190 countries, against the general trade analysis, which identifies the biggest importer or exporter.
To discover high-growth global markets and optimize your business strategy:
Click Here
Pricing
- Single User License$ 1,995
- Department License$ 2,400
- Site License$ 3,120
- Global License$ 3,795

Leadership Perspectives from Industry Events
Search
Thought Leadership and Analyst Meet


Our Clients
6WResearch In News
- India Air Conditioner Market Set for Strong Rebound in 2026 After Weather-Led Correction and GST-Driven Recovery: 6Wresearch
- ADAS in India: How Automatic Emergency Braking, Blind Spot Detection & Driver Monitoring are Transforming Road Safety
- Doha a strategic location for EV manufacturing hub: IPA Qatar
- Demand for luxury TVs surging in the GCC, says Samsung
- Empowering Growth: The Thriving Journey of Bangladesh’s Cable Industry
- Demand for luxury TVs surging in the GCC, says Samsung
Latest Reports
- Nicaragua RPG Gaming Market (2026-2032)
- New Zealand RPG Gaming Market (2026-2032)
- Netherlands RPG Gaming Market (2026-2032)
- Nauru RPG Gaming Market (2026-2032)
- Namibia RPG Gaming Market (2026-2032)
- Mozambique RPG Gaming Market (2026-2032)
- Montenegro RPG Gaming Market (2026-2032)
- Mongolia RPG Gaming Market (2026-2032)
- Monaco RPG Gaming Market (2026-2032)
- Micronesia RPG Gaming Market (2026-2032)
Industry Events and Analyst Meet

EV India Expo 2026

HIMTEX 2026

India Refining Summit 2026

India EV Show 2026

EV tech India Expo 2026
Whitepaper
- Middle East & Africa Commercial Security Market Click here to view more.
- Middle East & Africa Fire Safety Systems & Equipment Market Click here to view more.
- GCC Drone Market Click here to view more.
- Middle East Lighting Fixture Market Click here to view more.
- GCC Physical & Perimeter Security Market Click here to view more.