Saudi Arabia Phosphoric Acid Market (2026-2032) Outlook | Growth, Share, Industry, Revenue, Forecast, Analysis, Value, Companies, Size & Trends
Market Forecast By Process Type (Wet Process, Thermal Process, Others), By Application (Home Cleaning Agents, Fertilizer Chemicals), By Fertilizer Type (Mono-Ammonium Phosphate (MAP), Diammonium Phosphate (DAP), Triple Superphosphate (TSP)), By End-Users (Electronics, Beverage, Medical, Food, Fertilizer, Others), By Grade (Food-Grade, Technical Grade) And Competitive Landscape
| Product Code: ETC129540 | Publication Date: Jul 2023 | Updated Date: Mar 2026 | Product Type: Report | |
| Publisher: 6Wresearch | Author: Ravi Bhandari | No. of Pages: 70 | No. of Figures: 35 | No. of Tables: 5 |
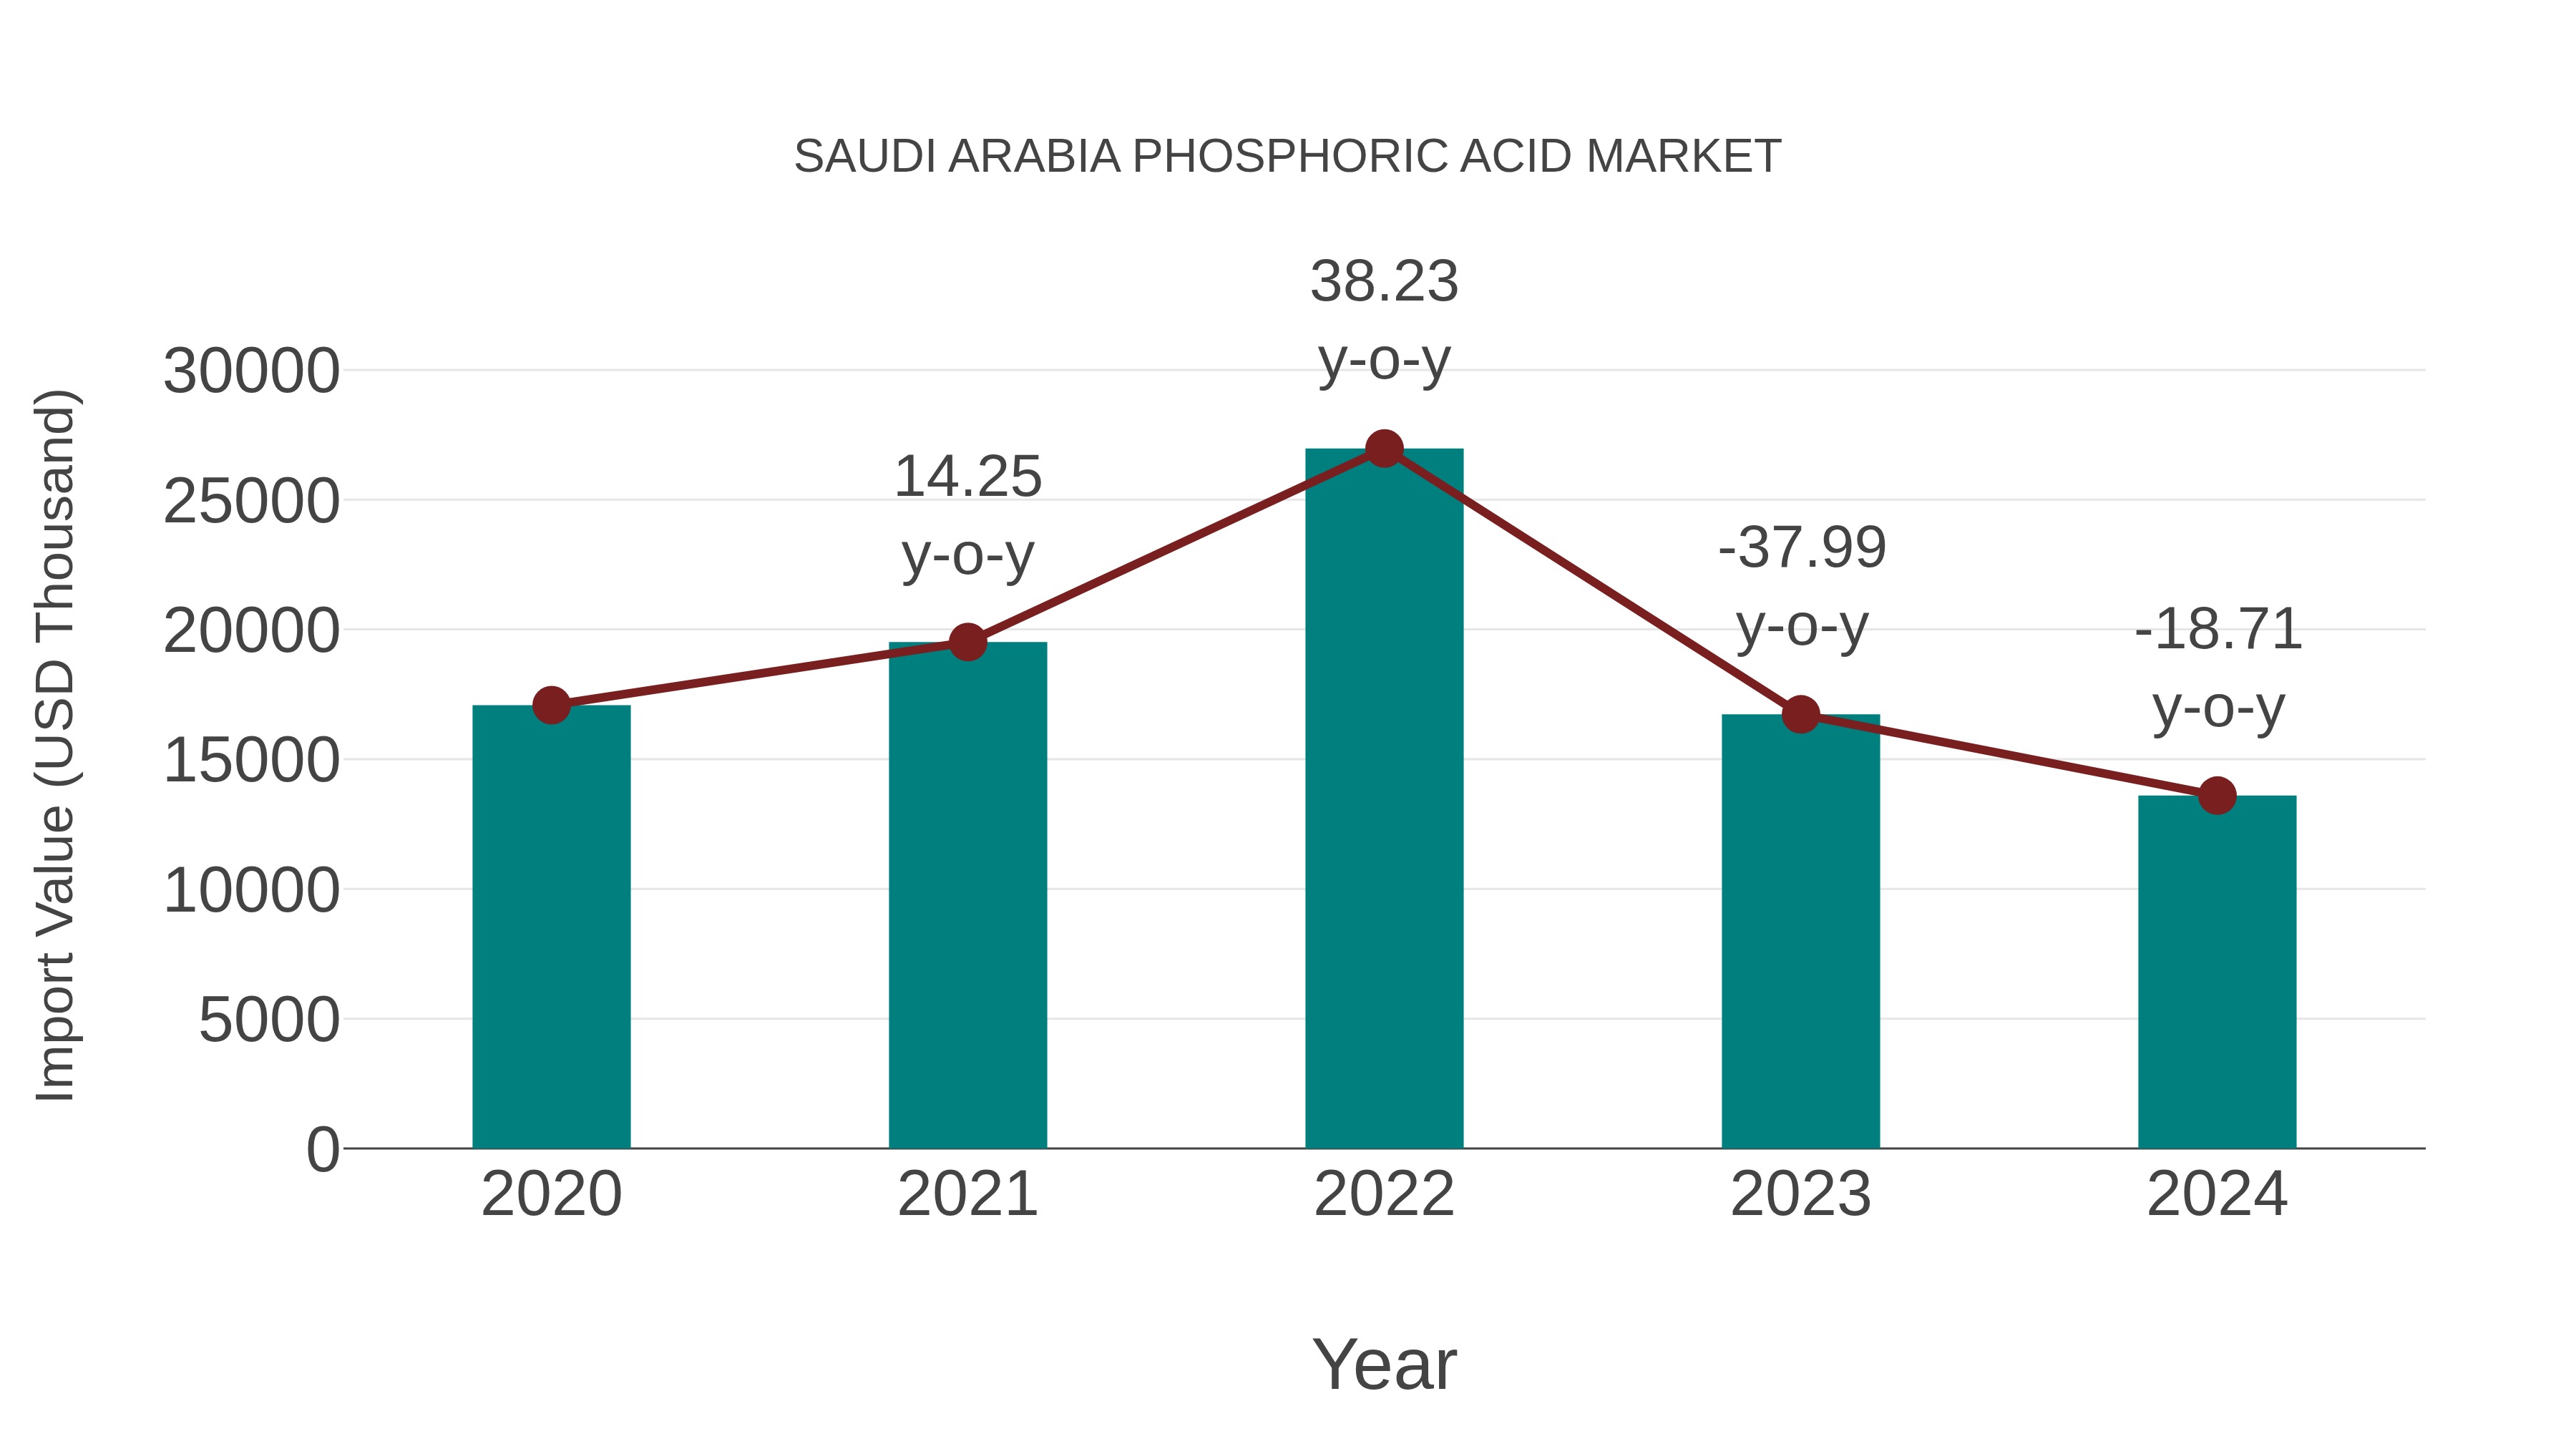
Saudi Arabia Phosphoric Acid Market: Import Trend Analysis
The Saudi Arabia phosphoric acid market witnessed a decline in import momentum from 2023 to 2024, with a growth rate of -18.71%. The compound annual growth rate (CAGR) for imports from 2020 to 2024 stood at -5.54%. This negative trend can be attributed to shifts in demand dynamics or potential changes in trade policies impacting the market stability.
Saudi Arabia Phosphoric Acid Market Synopsis
Phosphoric acid is an essential chemical used in various industries, including fertilizers, food and beverage, pharmaceuticals, and water treatment. In Saudi Arabia, phosphoric acid is primarily produced for use in the country`s agricultural sector as a key ingredient in fertilizers.
Market Drivers
Growing Agricultural Sector: The agricultural industry in Saudi Arabia is one of the primary consumers of phosphoric acid for the production of phosphate-based fertilizers, driven by the need to increase crop yields and enhance food security. Expanding Industrial Applications: Phosphoric acid finds applications in various industries, such as food and beverage, pharmaceuticals, and water treatment, contributing to its demand in the market. Government Support: The Saudi Arabia government`s initiatives to support the agricultural sector and increase domestic food production drive the demand for phosphoric acid in the country.
Challenges of the Market
Competition from Imports: Despite local production, Saudi Arabia may still import some of its phosphoric acid requirements, facing competition from international suppliers. Fluctuating Raw Material Costs: The availability and prices of raw materials used in the production of phosphoric acid can impact the cost structure for manufacturers. Environmental Concerns: The environmental impact of phosphoric acid production and its use in agriculture, such as potential water pollution from run-offs, can be a concern.
Covid 19 Impact on the Market
The Covid-19 pandemic may have had mixed effects on the Saudi Arabia phosphoric acid market. While there might have been disruptions in the supply chain and production during lockdowns, the agricultural sector`s continued importance could have sustained the demand for phosphoric acid used in fertilizers.
key players of the Market
The key players in the Saudi Arabia phosphoric acid market could have included both local and international chemical manufacturers. Some of the key players could have been: Saudi Arabia Mining Company, The Arab Potash Company Ltd., OCP Group (Office Cherifien des Phosphates), EuroChem Group AG
Key Highlights of the Report:
- Saudi Arabia Phosphoric Acid Market Outlook
- Market Size of Saudi Arabia Phosphoric Acid Market, 2025
- Forecast of Saudi Arabia Phosphoric Acid Market, 2032
- Historical Data and Forecast of Saudi Arabia Phosphoric Acid Revenues & Volume for the Period 2022-2032F
- Saudi Arabia Phosphoric Acid Market Trend Evolution
- Saudi Arabia Phosphoric Acid Market Drivers and Challenges
- Saudi Arabia Phosphoric Acid Price Trends
- Saudi Arabia Phosphoric Acid Porter's Five Forces
- Saudi Arabia Phosphoric Acid Industry Life Cycle
- Historical Data and Forecast of Saudi Arabia Phosphoric Acid Market Revenues & Volume By Process Type for the Period 2022-2032F
- Historical Data and Forecast of Saudi Arabia Phosphoric Acid Market Revenues & Volume By Wet Process for the Period 2022-2032F
- Historical Data and Forecast of Saudi Arabia Phosphoric Acid Market Revenues & Volume By Thermal Process for the Period 2022-2032F
- Historical Data and Forecast of Saudi Arabia Phosphoric Acid Market Revenues & Volume By Others for the Period 2022-2032F
- Historical Data and Forecast of Saudi Arabia Phosphoric Acid Market Revenues & Volume By Application for the Period 2022-2032F
- Historical Data and Forecast of Saudi Arabia Phosphoric Acid Market Revenues & Volume By Home Cleaning Agents for the Period 2022-2032F
- Historical Data and Forecast of Saudi Arabia Phosphoric Acid Market Revenues & Volume By Fertilizer Chemicals for the Period 2022-2032F
- Historical Data and Forecast of Saudi Arabia Phosphoric Acid Market Revenues & Volume By Fertilizer Type for the Period 2022-2032F
- Historical Data and Forecast of Saudi Arabia Phosphoric Acid Market Revenues & Volume By Mono-Ammonium Phosphate (MAP) for the Period 2022-2032F
- Historical Data and Forecast of Saudi Arabia Phosphoric Acid Market Revenues & Volume By Diammonium Phosphate (DAP) for the Period 2022-2032F
- Historical Data and Forecast of Saudi Arabia Phosphoric Acid Market Revenues & Volume By Triple Superphosphate (TSP) for the Period 2022-2032F
- Historical Data and Forecast of Saudi Arabia Phosphoric Acid Market Revenues & Volume By End-Users for the Period 2022-2032F
- Historical Data and Forecast of Saudi Arabia Phosphoric Acid Market Revenues & Volume By Electronics for the Period 2022-2032F
- Historical Data and Forecast of Saudi Arabia Phosphoric Acid Market Revenues & Volume By Beverage for the Period 2022-2032F
- Historical Data and Forecast of Saudi Arabia Phosphoric Acid Market Revenues & Volume By Medical for the Period 2022-2032F
- Historical Data and Forecast of Saudi Arabia Phosphoric Acid Market Revenues & Volume By Food for the Period 2022-2032F
- Historical Data and Forecast of Saudi Arabia Phosphoric Acid Market Revenues & Volume By Fertilizer for the Period 2022-2032F
- Historical Data and Forecast of Saudi Arabia Phosphoric Acid Market Revenues & Volume By Others for the Period 2022-2032F
- Historical Data and Forecast of Saudi Arabia Phosphoric Acid Market Revenues & Volume By Grade for the Period 2022-2032F
- Historical Data and Forecast of Saudi Arabia Phosphoric Acid Market Revenues & Volume By Food-Grade for the Period 2022-2032F
- Historical Data and Forecast of Saudi Arabia Phosphoric Acid Market Revenues & Volume By Technical Grade for the Period 2022-2032F
- Saudi Arabia Phosphoric Acid Import Export Trade Statistics
- Market Opportunity Assessment By Process Type
- Market Opportunity Assessment By Application
- Market Opportunity Assessment By Fertilizer Type
- Market Opportunity Assessment By End-Users
- Market Opportunity Assessment By Grade
- Saudi Arabia Phosphoric Acid Top Companies Market Share
- Saudi Arabia Phosphoric Acid Competitive Benchmarking By Technical and Operational Parameters
- Saudi Arabia Phosphoric Acid Company Profiles
- Saudi Arabia Phosphoric Acid Key Strategic Recommendations
Saudi Arabia Phosphoric Acid Market (2026-2032): FAQs
6Wresearch actively monitors the Saudi Arabia Phosphoric Acid Market and publishes its comprehensive annual report, highlighting emerging trends, growth drivers, revenue analysis, and forecast outlook. Our insights help businesses to make data-backed strategic decisions with ongoing market dynamics. Our analysts track relevent industries related to the Saudi Arabia Phosphoric Acid Market, allowing our clients with actionable intelligence and reliable forecasts tailored to emerging regional needs.
Yes, we provide customisation as per your requirements. To learn more, feel free to contact us on sales@6wresearch.com
Saudi Arabia Phosphoric Acid |
1 Executive Summary |
2 Introduction |
2.1 Key Highlights of the Report |
2.2 Report Description |
2.3 Market Scope & Segmentation |
2.4 Research Methodology |
2.5 Assumptions |
3 Saudi Arabia Phosphoric Acid Market Overview |
3.1 Saudi Arabia Country Macro Economic Indicators |
3.2 Saudi Arabia Phosphoric Acid Market Revenues & Volume, 2022 & 2032F |
3.3 Saudi Arabia Phosphoric Acid Market - Industry Life Cycle |
3.4 Saudi Arabia Phosphoric Acid Market - Porter's Five Forces |
3.5 Saudi Arabia Phosphoric Acid Market Revenues & Volume Share, By Process Type, 2022 & 2032F |
3.6 Saudi Arabia Phosphoric Acid Market Revenues & Volume Share, By Application, 2022 & 2032F |
3.7 Saudi Arabia Phosphoric Acid Market Revenues & Volume Share, By Fertilizer Type, 2022 & 2032F |
3.8 Saudi Arabia Phosphoric Acid Market Revenues & Volume Share, By End-Users, 2022 & 2032F |
3.9 Saudi Arabia Phosphoric Acid Market Revenues & Volume Share, By Grade, 2022 & 2032F |
4 Saudi Arabia Phosphoric Acid Market Dynamics |
4.1 Impact Analysis |
4.2 Market Drivers |
4.2.1 Growth in the agriculture sector, leading to increased demand for phosphoric acid as a fertilizer. |
4.2.2 Expansion of the food and beverage industry, driving the need for phosphoric acid in food additives. |
4.2.3 Government initiatives promoting industrial growth and investment in the chemical sector. |
4.3 Market Restraints |
4.3.1 Volatility in raw material prices, impacting the production cost of phosphoric acid. |
4.3.2 Environmental regulations and sustainability concerns affecting the usage of phosphoric acid in certain applications. |
5 Saudi Arabia Phosphoric Acid Market Trends |
6 Saudi Arabia Phosphoric Acid Market, By Types |
6.1 Saudi Arabia Phosphoric Acid Market, By Process Type |
6.1.1 Overview and Analysis |
6.1.2 Saudi Arabia Phosphoric Acid Market Revenues & Volume, By Process Type, 2022-2032F |
6.1.3 Saudi Arabia Phosphoric Acid Market Revenues & Volume, By Wet Process, 2022-2032F |
6.1.4 Saudi Arabia Phosphoric Acid Market Revenues & Volume, By Thermal Process, 2022-2032F |
6.1.5 Saudi Arabia Phosphoric Acid Market Revenues & Volume, By Others, 2022-2032F |
6.2 Saudi Arabia Phosphoric Acid Market, By Application |
6.2.1 Overview and Analysis |
6.2.2 Saudi Arabia Phosphoric Acid Market Revenues & Volume, By Home Cleaning Agents, 2022-2032F |
6.2.3 Saudi Arabia Phosphoric Acid Market Revenues & Volume, By Fertilizer Chemicals, 2022-2032F |
6.3 Saudi Arabia Phosphoric Acid Market, By Fertilizer Type |
6.3.1 Overview and Analysis |
6.3.2 Saudi Arabia Phosphoric Acid Market Revenues & Volume, By Mono-Ammonium Phosphate (MAP), 2022-2032F |
6.3.3 Saudi Arabia Phosphoric Acid Market Revenues & Volume, By Diammonium Phosphate (DAP), 2022-2032F |
6.3.4 Saudi Arabia Phosphoric Acid Market Revenues & Volume, By Triple Superphosphate (TSP), 2022-2032F |
6.4 Saudi Arabia Phosphoric Acid Market, By End-Users |
6.4.1 Overview and Analysis |
6.4.2 Saudi Arabia Phosphoric Acid Market Revenues & Volume, By Electronics, 2022-2032F |
6.4.3 Saudi Arabia Phosphoric Acid Market Revenues & Volume, By Beverage, 2022-2032F |
6.4.4 Saudi Arabia Phosphoric Acid Market Revenues & Volume, By Medical, 2022-2032F |
6.4.5 Saudi Arabia Phosphoric Acid Market Revenues & Volume, By Food, 2022-2032F |
6.4.6 Saudi Arabia Phosphoric Acid Market Revenues & Volume, By Fertilizer, 2022-2032F |
6.4.7 Saudi Arabia Phosphoric Acid Market Revenues & Volume, By Others, 2022-2032F |
6.5 Saudi Arabia Phosphoric Acid Market, By Grade |
6.5.1 Overview and Analysis |
6.5.2 Saudi Arabia Phosphoric Acid Market Revenues & Volume, By Food-Grade, 2022-2032F |
6.5.3 Saudi Arabia Phosphoric Acid Market Revenues & Volume, By Technical Grade, 2022-2032F |
7 Saudi Arabia Phosphoric Acid Market Import-Export Trade Statistics |
7.1 Saudi Arabia Phosphoric Acid Market Export to Major Countries |
7.2 Saudi Arabia Phosphoric Acid Market Imports from Major Countries |
8 Saudi Arabia Phosphoric Acid Market Key Performance Indicators |
8.1 Average selling price of phosphoric acid in the Saudi Arabian market. |
8.2 Import/export volume of phosphoric acid to gauge market demand. |
8.3 Adoption rate of phosphoric acid in new applications or industries. |
8.4 Research and development expenditure in the phosphoric acid sector. |
8.5 Capacity utilization rate of phosphoric acid production facilities in Saudi Arabia. |
9 Saudi Arabia Phosphoric Acid Market - Opportunity Assessment |
9.1 Saudi Arabia Phosphoric Acid Market Opportunity Assessment, By Process Type, 2022 & 2032F |
9.2 Saudi Arabia Phosphoric Acid Market Opportunity Assessment, By Application, 2022 & 2032F |
9.3 Saudi Arabia Phosphoric Acid Market Opportunity Assessment, By Fertilizer Type, 2022 & 2032F |
9.4 Saudi Arabia Phosphoric Acid Market Opportunity Assessment, By End-Users, 2022 & 2032F |
9.5 Saudi Arabia Phosphoric Acid Market Opportunity Assessment, By Grade, 2022 & 2032F |
10 Saudi Arabia Phosphoric Acid Market - Competitive Landscape |
10.1 Saudi Arabia Phosphoric Acid Market Revenue Share, By Companies, 2025 |
10.2 Saudi Arabia Phosphoric Acid Market Competitive Benchmarking, By Operating and Technical Parameters |
11 Company Profiles |
12 Recommendations |
13 Disclaimer |
Global Go To Market Strategy - 2030
Export potential enables firms to identify high-growth global markets with greater confidence by combining advanced trade intelligence with a structured quantitative methodology. The framework analyzes emerging demand trends and country-level import patterns while integrating macroeconomic and trade datasets such as GDP and population forecasts, bilateral import–export flows, tariff structures, elasticity differentials between developed and developing economies, geographic distance, and import demand projections. Using weighted trade values from 2020–2024 as the base period to project country-to-country export potential for 2030, these inputs are operationalized through calculated drivers such as gravity model parameters, tariff impact factors, and projected GDP per-capita growth. Through an analysis of hidden potentials, demand hotspots, and market conditions that are most favorable to success, this method enables firms to focus on target countries, maximize returns, and global expansion with data, backed by accuracy.
By factoring in the projected importer demand gap that is currently unmet and could be potential opportunity, it identifies the potential for the Exporter (Country) among 190 countries, against the general trade analysis, which identifies the biggest importer or exporter.
To discover high-growth global markets and optimize your business strategy:
Click Here
Pricing
- Single User License$ 1,995
- Department License$ 2,400
- Site License$ 3,120
- Global License$ 3,795

Leadership Perspectives from Industry Events
Search
Thought Leadership and Analyst Meet


Our Clients
6WResearch In News
- India Air Conditioner Market Set for Strong Rebound in 2026 After Weather-Led Correction and GST-Driven Recovery: 6Wresearch
- ADAS in India: How Automatic Emergency Braking, Blind Spot Detection & Driver Monitoring are Transforming Road Safety
- Doha a strategic location for EV manufacturing hub: IPA Qatar
- Demand for luxury TVs surging in the GCC, says Samsung
- Empowering Growth: The Thriving Journey of Bangladesh’s Cable Industry
- Demand for luxury TVs surging in the GCC, says Samsung
Latest Reports
- Poland Fire Protection Systems Market (2026-2032)
- Cape Verde Portable Hand-Thrown Extinguisher Market (2026-2032)
- Canada Portable Hand-Thrown Extinguisher Market (2026-2032)
- Cameroon Portable Hand-Thrown Extinguisher Market (2026-2032)
- Burundi Portable Hand-Thrown Extinguisher Market (2026-2032)
- Burkina Faso Portable Hand-Thrown Extinguisher Market (2026-2032)
- Bulgaria Portable Hand-Thrown Extinguisher Market (2026-2032)
- Brunei Portable Hand-Thrown Extinguisher Market (2026-2032)
- Botswana Portable Hand-Thrown Extinguisher Market (2026-2032)
- Bosnia and Herzegovina Portable Hand-Thrown Extinguisher Market (2026-2032)
Industry Events and Analyst Meet

HIMTEX 2026

India Refining Summit 2026

India EV Show 2026

EV tech India Expo 2026

Auto Tech Asia 2026
Whitepaper
- Middle East & Africa Commercial Security Market Click here to view more.
- Middle East & Africa Fire Safety Systems & Equipment Market Click here to view more.
- GCC Drone Market Click here to view more.
- Middle East Lighting Fixture Market Click here to view more.
- GCC Physical & Perimeter Security Market Click here to view more.