Seychelles Retail Transparent Display Market (2026-2032) | Trends, Outlook, Size & Revenue, Competitive Landscape, Forecast, Share, Analysis, Industry, Segmentation, Companies, Growth, Value
Market Forecast By Product (Head-Mounted Display, Head-Up Display, Digital Signage, Smart Appliance), By Display Size (Small, Medium-Sized, Large), By Retail Application (Advertising Displays And Store Windows, Display Cases, Vending Machines) And Competitive Landscape
| Product Code: ETC9239979 | Publication Date: Sep 2024 | Updated Date: Apr 2026 | Product Type: Market Research Report | |
| Publisher: 6Wresearch | Author: Dhaval Chaurasia | No. of Pages: 75 | No. of Figures: 35 | No. of Tables: 20 |
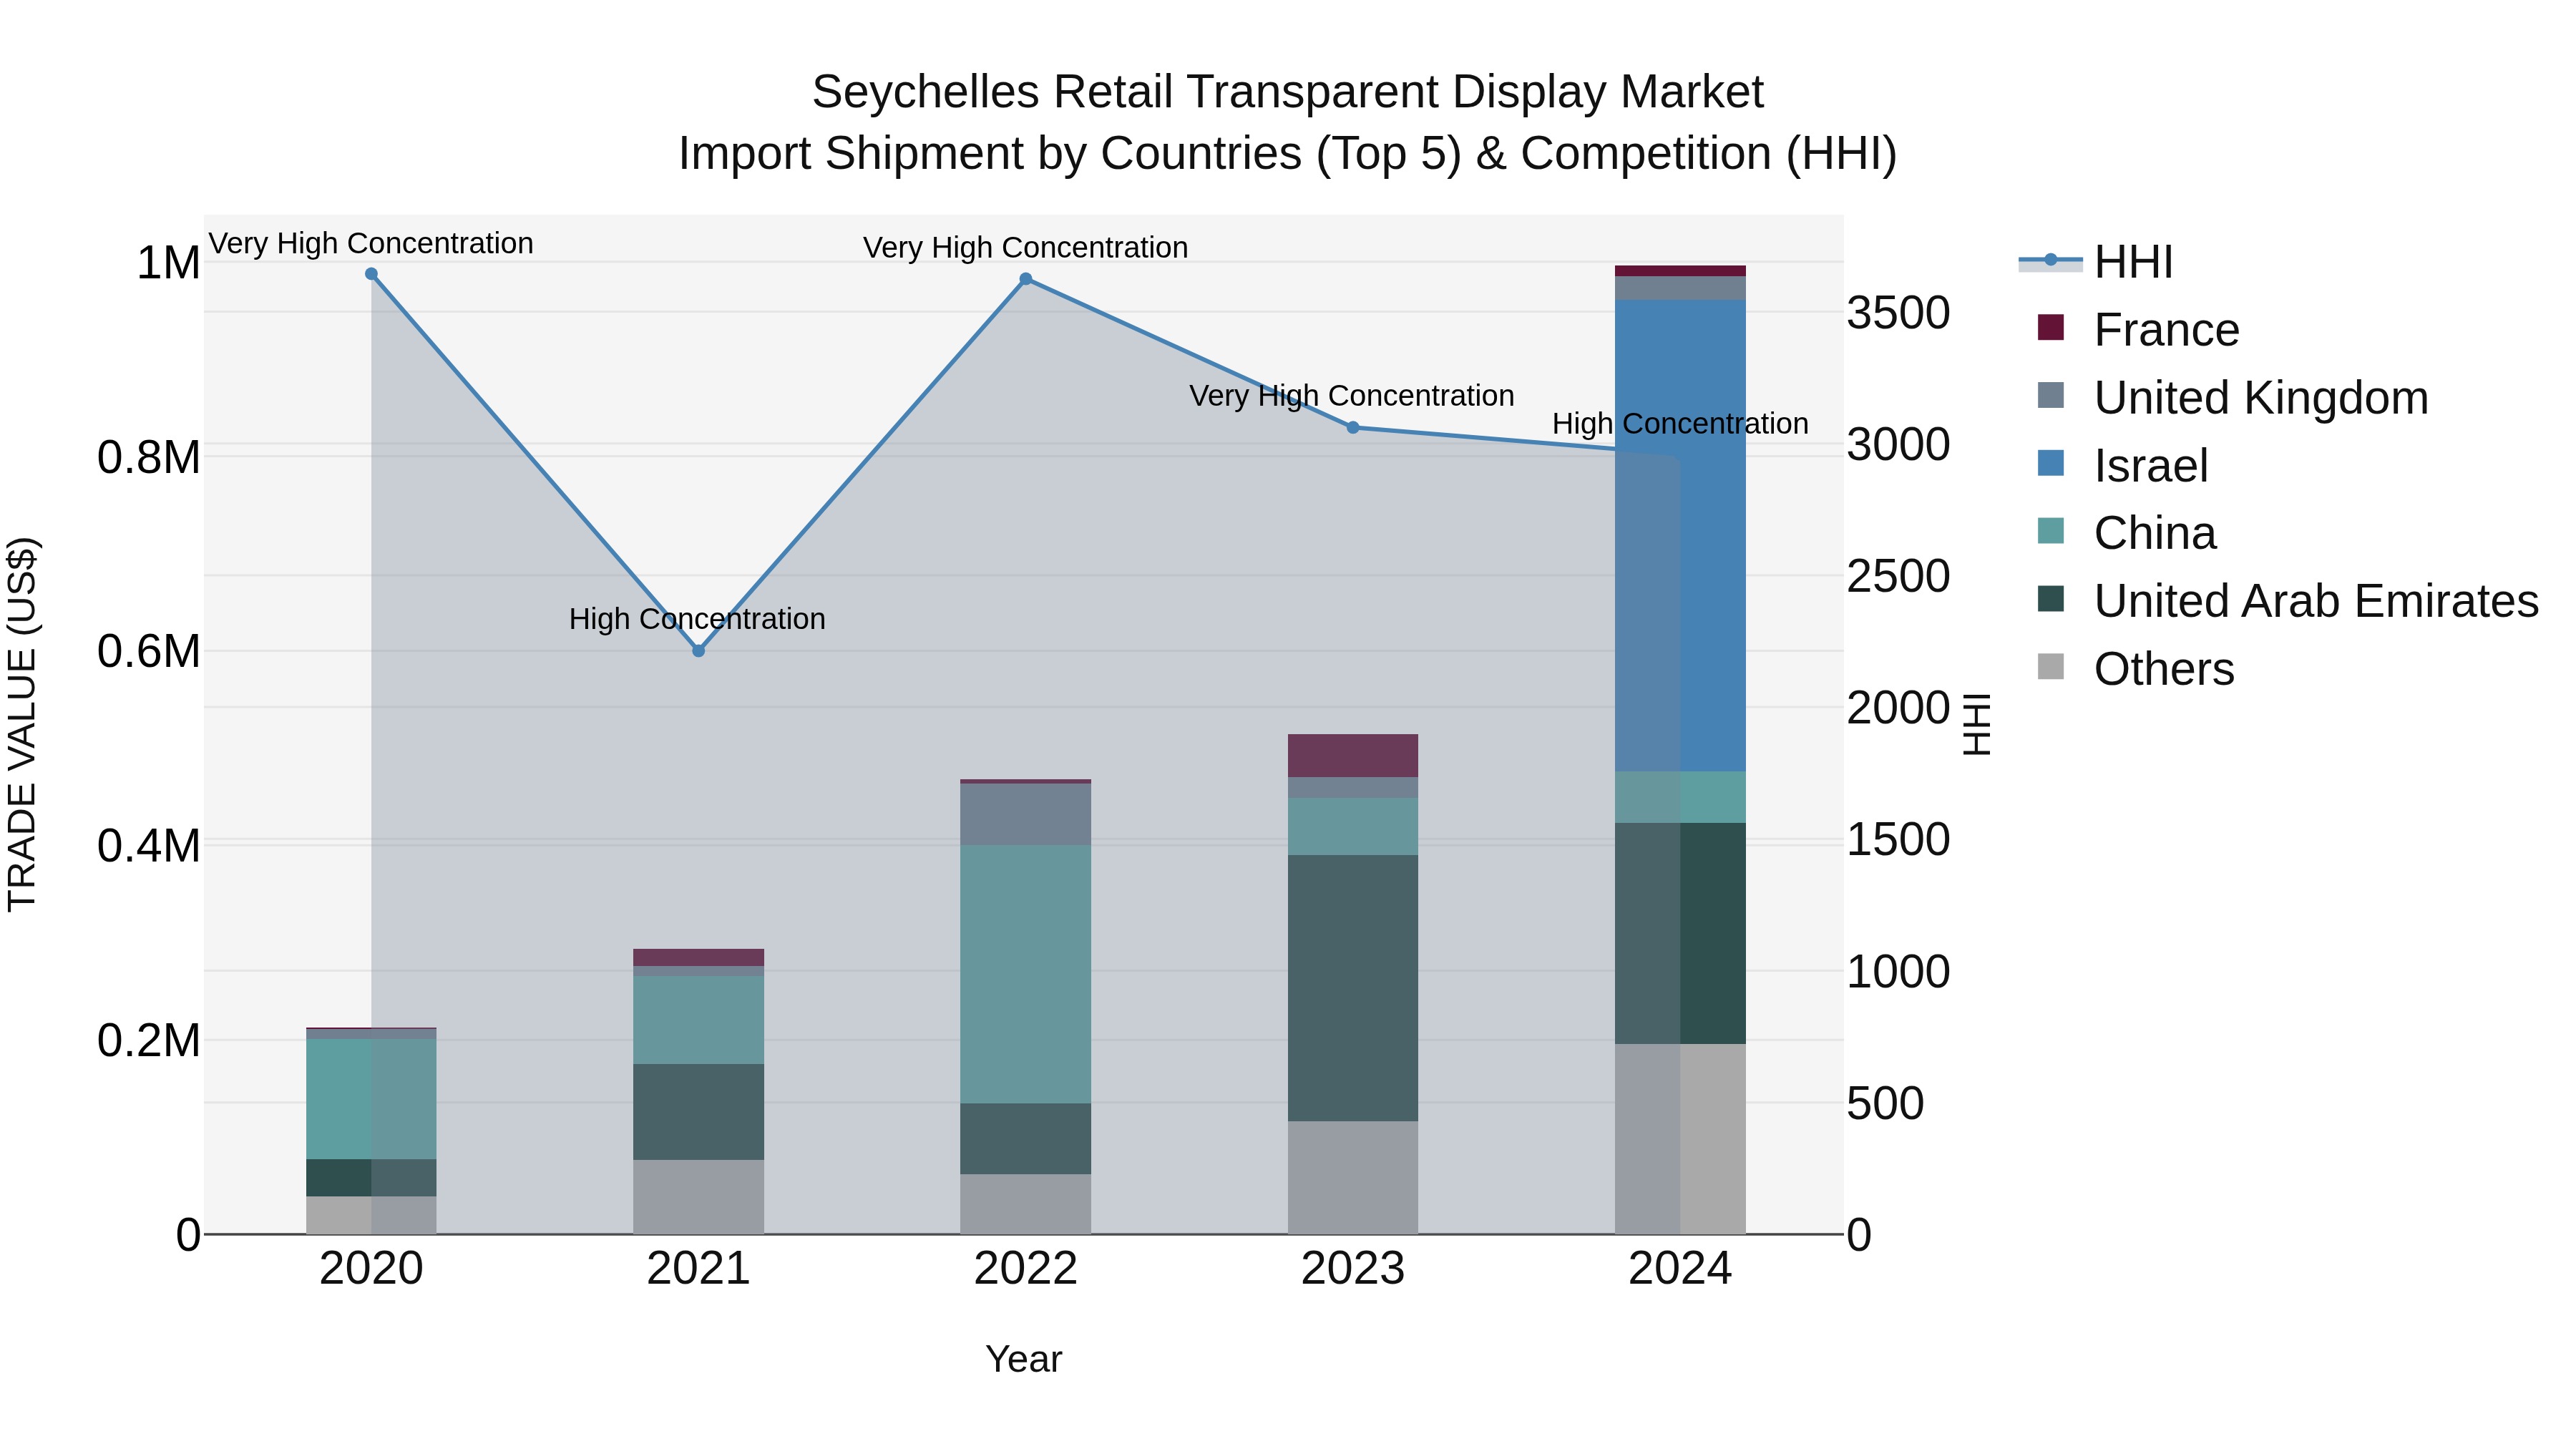
Seychelles Retail Transparent Display Market: Top 5 Importing Countries and Market Competition (HHI) Analysis
The retail transparent display import shipments to Seychelles experienced significant growth in 2024, with top exporting countries being Israel, United Arab Emirates, China, India, and Singapore. The high Herfindahl-Hirschman Index (HHI) concentration in 2023 increased further in 2024, indicating a competitive market landscape. The impressive compound annual growth rate (CAGR) of 47.09% from 2020 to 2024 highlights the expanding demand for these products in Seychelles. Moreover, the remarkable growth rate of 93.54% from 2023 to 2024 suggests a rapid acceleration in import activities, signaling promising opportunities for retailers and suppliers in the sector.
Key Highlights of the Report:
- Seychelles Retail Transparent Display Market Outlook
- Market Size of Seychelles Retail Transparent Display Market, 2025
- Forecast of Seychelles Retail Transparent Display Market, 2032
- Historical Data and Forecast of Seychelles Retail Transparent Display Revenues & Volume for the Period 2022 - 2032
- Seychelles Retail Transparent Display Market Trend Evolution
- Seychelles Retail Transparent Display Market Drivers and Challenges
- Seychelles Retail Transparent Display Price Trends
- Seychelles Retail Transparent Display Porter's Five Forces
- Seychelles Retail Transparent Display Industry Life Cycle
- Historical Data and Forecast of Seychelles Retail Transparent Display Market Revenues & Volume By Product for the Period 2022 - 2032
- Historical Data and Forecast of Seychelles Retail Transparent Display Market Revenues & Volume By Head-Mounted Display for the Period 2022 - 2032
- Historical Data and Forecast of Seychelles Retail Transparent Display Market Revenues & Volume By Head-Up Display for the Period 2022 - 2032
- Historical Data and Forecast of Seychelles Retail Transparent Display Market Revenues & Volume By Digital Signage for the Period 2022 - 2032
- Historical Data and Forecast of Seychelles Retail Transparent Display Market Revenues & Volume By Smart Appliance for the Period 2022 - 2032
- Historical Data and Forecast of Seychelles Retail Transparent Display Market Revenues & Volume By Display Size for the Period 2022 - 2032
- Historical Data and Forecast of Seychelles Retail Transparent Display Market Revenues & Volume By Small for the Period 2022 - 2032
- Historical Data and Forecast of Seychelles Retail Transparent Display Market Revenues & Volume By Medium-Sized for the Period 2022 - 2032
- Historical Data and Forecast of Seychelles Retail Transparent Display Market Revenues & Volume By Large for the Period 2022 - 2032
- Historical Data and Forecast of Seychelles Retail Transparent Display Market Revenues & Volume By Retail Application for the Period 2022 - 2032
- Historical Data and Forecast of Seychelles Retail Transparent Display Market Revenues & Volume By Advertising Displays And Store Windows for the Period 2022 - 2032
- Historical Data and Forecast of Seychelles Retail Transparent Display Market Revenues & Volume By Display Cases for the Period 2022 - 2032
- Historical Data and Forecast of Seychelles Retail Transparent Display Market Revenues & Volume By Vending Machines for the Period 2022 - 2032
- Seychelles Retail Transparent Display Import Export Trade Statistics
- Market Opportunity Assessment By Product
- Market Opportunity Assessment By Display Size
- Market Opportunity Assessment By Retail Application
- Seychelles Retail Transparent Display Top Companies Market Share
- Seychelles Retail Transparent Display Competitive Benchmarking By Technical and Operational Parameters
- Seychelles Retail Transparent Display Company Profiles
- Seychelles Retail Transparent Display Key Strategic Recommendations
Frequently Asked Questions About the Market Study (FAQs):
6Wresearch actively monitors the Seychelles Retail Transparent Display Market and publishes its comprehensive annual report, highlighting emerging trends, growth drivers, revenue analysis, and forecast outlook. Our insights help businesses to make data-backed strategic decisions with ongoing market dynamics. Our analysts track relevent industries related to the Seychelles Retail Transparent Display Market, allowing our clients with actionable intelligence and reliable forecasts tailored to emerging regional needs.
Yes, we provide customisation as per your requirements. To learn more, feel free to contact us on sales@6wresearch.com
1 Executive Summary |
2 Introduction |
2.1 Key Highlights of the Report |
2.2 Report Description |
2.3 Market Scope & Segmentation |
2.4 Research Methodology |
2.5 Assumptions |
3 Seychelles Retail Transparent Display Market Overview |
3.1 Seychelles Country Macro Economic Indicators |
3.2 Seychelles Retail Transparent Display Market Revenues & Volume, 2022 & 2032F |
3.3 Seychelles Retail Transparent Display Market - Industry Life Cycle |
3.4 Seychelles Retail Transparent Display Market - Porter's Five Forces |
3.5 Seychelles Retail Transparent Display Market Revenues & Volume Share, By Product, 2022 & 2032F |
3.6 Seychelles Retail Transparent Display Market Revenues & Volume Share, By Display Size, 2022 & 2032F |
3.7 Seychelles Retail Transparent Display Market Revenues & Volume Share, By Retail Application, 2022 & 2032F |
4 Seychelles Retail Transparent Display Market Dynamics |
4.1 Impact Analysis |
4.2 Market Drivers |
4.2.1 Increasing demand for innovative and interactive retail displays to enhance customer engagement and shopping experience |
4.2.2 Growing adoption of digital signage technology in the retail sector for targeted advertising and promotions |
4.2.3 Rising trend of omni-channel retailing leading to the need for dynamic and customizable display solutions |
4.3 Market Restraints |
4.3.1 High initial investment cost for implementing transparent display technology in retail stores |
4.3.2 Limited awareness and understanding of the benefits of transparent displays among retailers |
4.3.3 Challenges related to integrating transparent displays with existing retail infrastructure and technologies |
5 Seychelles Retail Transparent Display Market Trends |
6 Seychelles Retail Transparent Display Market, By Types |
6.1 Seychelles Retail Transparent Display Market, By Product |
6.1.1 Overview and Analysis |
6.1.2 Seychelles Retail Transparent Display Market Revenues & Volume, By Product, 2022 - 2032F |
6.1.3 Seychelles Retail Transparent Display Market Revenues & Volume, By Head-Mounted Display, 2022 - 2032F |
6.1.4 Seychelles Retail Transparent Display Market Revenues & Volume, By Head-Up Display, 2022 - 2032F |
6.1.5 Seychelles Retail Transparent Display Market Revenues & Volume, By Digital Signage, 2022 - 2032F |
6.1.6 Seychelles Retail Transparent Display Market Revenues & Volume, By Smart Appliance, 2022 - 2032F |
6.2 Seychelles Retail Transparent Display Market, By Display Size |
6.2.1 Overview and Analysis |
6.2.2 Seychelles Retail Transparent Display Market Revenues & Volume, By Small, 2022 - 2032F |
6.2.3 Seychelles Retail Transparent Display Market Revenues & Volume, By Medium-Sized, 2022 - 2032F |
6.2.4 Seychelles Retail Transparent Display Market Revenues & Volume, By Large, 2022 - 2032F |
6.3 Seychelles Retail Transparent Display Market, By Retail Application |
6.3.1 Overview and Analysis |
6.3.2 Seychelles Retail Transparent Display Market Revenues & Volume, By Advertising Displays And Store Windows, 2022 - 2032F |
6.3.3 Seychelles Retail Transparent Display Market Revenues & Volume, By Display Cases, 2022 - 2032F |
6.3.4 Seychelles Retail Transparent Display Market Revenues & Volume, By Vending Machines, 2022 - 2032F |
7 Seychelles Retail Transparent Display Market Import-Export Trade Statistics |
7.1 Seychelles Retail Transparent Display Market Export to Major Countries |
7.2 Seychelles Retail Transparent Display Market Imports from Major Countries |
8 Seychelles Retail Transparent Display Market Key Performance Indicators |
8.1 Customer engagement metrics such as dwell time, interaction rate, and conversion rate in stores using transparent displays |
8.2 Return on Investment (ROI) from transparent display installations, considering factors like increased sales, reduced marketing costs, and improved brand visibility |
8.3 Adoption rate of transparent display technology by retail businesses in Seychelles |
8.4 Average time to market for new products or promotions displayed using transparent displays |
8.5 Energy efficiency and cost savings achieved through the use of transparent display technology in retail outlets |
9 Seychelles Retail Transparent Display Market - Opportunity Assessment |
9.1 Seychelles Retail Transparent Display Market Opportunity Assessment, By Product, 2022 & 2032F |
9.2 Seychelles Retail Transparent Display Market Opportunity Assessment, By Display Size, 2022 & 2032F |
9.3 Seychelles Retail Transparent Display Market Opportunity Assessment, By Retail Application, 2022 & 2032F |
10 Seychelles Retail Transparent Display Market - Competitive Landscape |
10.1 Seychelles Retail Transparent Display Market Revenue Share, By Companies, 2025 |
10.2 Seychelles Retail Transparent Display Market Competitive Benchmarking, By Operating and Technical Parameters |
11 Company Profiles |
12 Recommendations |
13 Disclaimer |
Global Go To Market Strategy - 2030
Export potential enables firms to identify high-growth global markets with greater confidence by combining advanced trade intelligence with a structured quantitative methodology. The framework analyzes emerging demand trends and country-level import patterns while integrating macroeconomic and trade datasets such as GDP and population forecasts, bilateral import–export flows, tariff structures, elasticity differentials between developed and developing economies, geographic distance, and import demand projections. Using weighted trade values from 2020–2024 as the base period to project country-to-country export potential for 2030, these inputs are operationalized through calculated drivers such as gravity model parameters, tariff impact factors, and projected GDP per-capita growth. Through an analysis of hidden potentials, demand hotspots, and market conditions that are most favorable to success, this method enables firms to focus on target countries, maximize returns, and global expansion with data, backed by accuracy.
By factoring in the projected importer demand gap that is currently unmet and could be potential opportunity, it identifies the potential for the Exporter (Country) among 190 countries, against the general trade analysis, which identifies the biggest importer or exporter.
To discover high-growth global markets and optimize your business strategy:
Click Here
Pricing
- Single User License$ 1,995
- Department License$ 2,400
- Site License$ 3,120
- Global License$ 3,795

Leadership Perspectives from Industry Events
Search
Thought Leadership and Analyst Meet


Our Clients
6WResearch In News
- Doha a strategic location for EV manufacturing hub: IPA Qatar
- Demand for luxury TVs surging in the GCC, says Samsung
- Empowering Growth: The Thriving Journey of Bangladesh’s Cable Industry
- Demand for luxury TVs surging in the GCC, says Samsung
- Video call with a traditional healer? Once unthinkable, it’s now common in South Africa
- Intelligent Buildings To Smooth GCC’s Path To Net Zero
Latest Reports
- Taiwan Airport Wireless Infrastructure Market (2026-2032)
- Vietnam Airport Wireless Infrastructure Market (2026-2032)
- Thailand Airport Wireless Infrastructure Market (2026-2032)
- South Korea Airport Wireless Infrastructure Market (2026-2032)
- Romania Airport Wireless Infrastructure Market (2026-2032)
- Qatar Airport Wireless Infrastructure Market (2026-2032)
- Philippines Airport Wireless Infrastructure Market (2026-2032)
- Japan Airport Wireless Infrastructure Market (2026-2032)
- Taiwan Airport Winter Services Market (2026-2032)
- Vietnam Airport Winter Services Market (2026-2032)
Industry Events and Analyst Meet

HIMTEX 2026

India Refining Summit 2026

India EV Show 2026

EV tech India Expo 2026

Auto Tech Asia 2026
Whitepaper
- Middle East & Africa Commercial Security Market Click here to view more.
- Middle East & Africa Fire Safety Systems & Equipment Market Click here to view more.
- GCC Drone Market Click here to view more.
- Middle East Lighting Fixture Market Click here to view more.
- GCC Physical & Perimeter Security Market Click here to view more.