Singapore Anhydrides Market (2024-2030) | Share, Forecast, Outlook, Revenue, Growth, Industry, Trends, Analysis, Size, Value & Companies
Market Forecast By Composition (Inorganic, Organic), By Types (Acetic Anhydride, Maleic Anhydride, Isobutyric Anhydride, Propionic Anhydride, Phthalic Anhydride, Isatoic Acid Anhydride, Others), By Application (Pesticides, Plasticizers, Dyes & Pigments, Additives, Flavors, Others), By End-Use Industry (Construction, Pharmaceuticals, Automotive, Agrochemicals, Textiles, Food & Beverages, Others) And Competitive Landscape
| Product Code: ETC046807 | Publication Date: Jul 2023 | Updated Date: Feb 2026 | Product Type: Report | |
| Publisher: 6Wresearch | Author: Ravi Bhandari | No. of Pages: 70 | No. of Figures: 35 | No. of Tables: 5 |
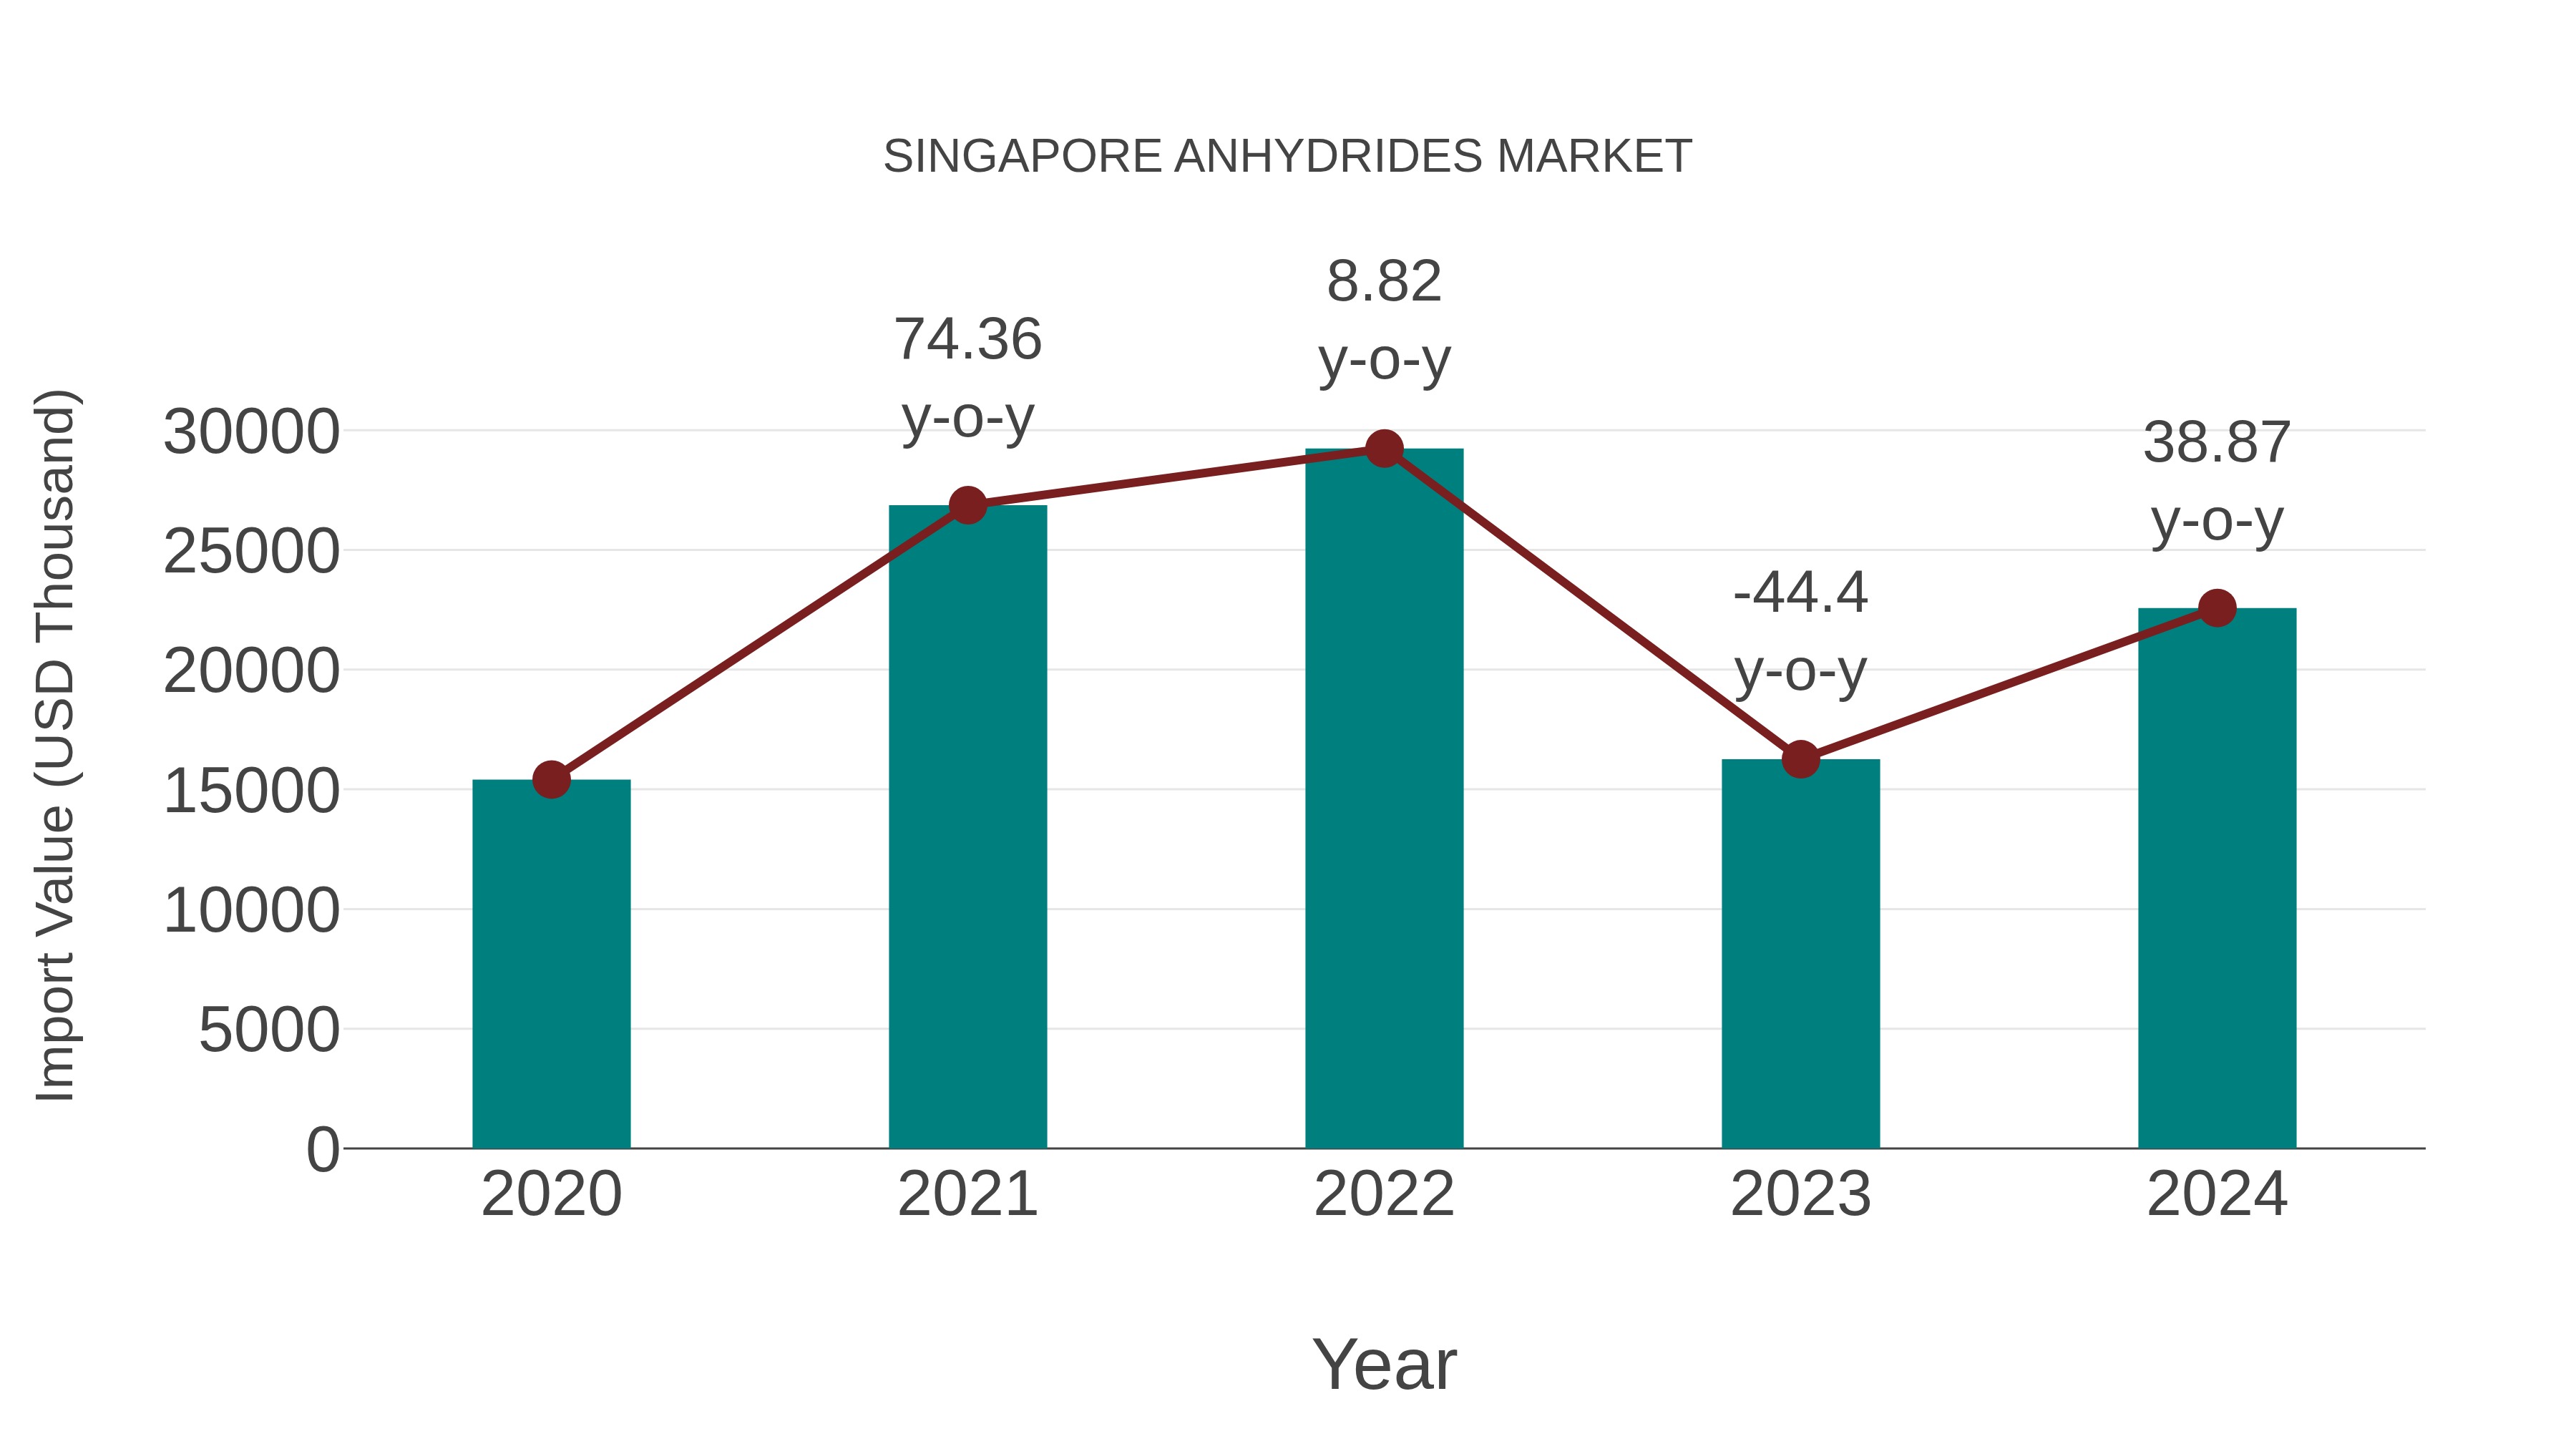
Singapore Anhydrides Market: Import Trend Analysis
In the Singapore anhydrides market, the import trend showed significant growth from 2023 to 2024, with a growth rate of 38.87%. The compound annual growth rate (CAGR) for the period 2020-2024 stood at 10.02%. This robust import momentum can be attributed to increased demand for anhydrides in various industries, indicating a positive market stability and growing trade opportunities during the period.
Singapore Anhydrides? Market Synopsis
Singapore anhydride market is witnessing significant growth owing to the surge in demand for petrochemicals and solvents from various industries such as plastics, pharmaceuticals, coatings, adhesives & sealants. The country also has numerous world-class oil refineries that produce a wide variety of products including anhydrous alcohols and acids. This has led to increased production capacity resulting in higher availability of raw materials used in the manufacturing of anhydrides. Moreover, Singapore is the hub for business activities across South East Asia due to its strategic location and competitive labor costs which further boost its industrial growth prospects.
Market Drivers
The major drivers driving the growth of Singapore anhydride market include increasing demand from end use industries such as automotive, electronics & electricals among others; rapid industrialization; technological advancements; government initiatives towards promoting sustainable manufacturing process; growing urban population; and improving economic conditions leading to greater disposable incomes among consumers. Furthermore, increasing investments by multinational companies into R&D activities aimed at developing new technologies are anticipated to propel the market over the forecast period (2020-2026).
Market challenges
The key challenge restraining market growth is stringent regulations imposed by local governments on hazardous chemicals/materials due their environmental impacts on air quality standards while some other challenges include high cost associated with research & development related activities coupled with rising competition among domestic players thereby making it difficult for them to survive or compete with larger international players operating in this region. Additionally, availability of cheap substitutes such as polyethylene terephthalate (PET) may hinder overall industry expansion during forecasted period (2020-2026).
Key players
Some leading companies involved producing Anydrides based products operated from Singpaore includes BASF Asia Pacific Pte Ltd, Eastman Chemical International Pte Ltd, Teva Pharmaceutical Industries Limited, Sabic Innovative Plastics IP BV
Covid-19 Impact
Due to disruption caused by Covid 19 pandemic across all sectors including automotive industry has adversely impacted operations within chemical sector resulting into loss or reduction revenue streams especially amongst SME players operating within specialty chemical segment including makers specialized anhydrides based product offering.Hence it has also affected sales volume generated through exports particularly where shipments were targeted towards China, India along with other international markets which posed serious challenge during year 2020.However post 2021 with world trying get back its normalcy would likely improve export trade thereby positively impacting business outlook across entire value chain involving manufacture / distribution related activities associated with specialty chemicals.
Key Highlights of the Report:
- Singapore Anhydrides? Market Outlook
- Market Size of Singapore Anhydrides? Market, 2023
- Forecast of Singapore Anhydrides? Market, 2030
- Historical Data and Forecast of Singapore Anhydrides? Revenues & Volume for the Period 2020-2030
- Singapore Anhydrides? Market Trend Evolution
- Singapore Anhydrides? Market Drivers and Challenges
- Singapore Anhydrides? Price Trends
- Singapore Anhydrides? Porter's Five Forces
- Singapore Anhydrides? Industry Life Cycle
- Historical Data and Forecast of Singapore Anhydrides? Market Revenues & Volume By Composition for the Period 2020-2030
- Historical Data and Forecast of Singapore Anhydrides? Market Revenues & Volume By Inorganic for the Period 2020-2030
- Historical Data and Forecast of Singapore Anhydrides? Market Revenues & Volume By Organic for the Period 2020-2030
- Historical Data and Forecast of Singapore Anhydrides? Market Revenues & Volume By Types for the Period 2020-2030
- Historical Data and Forecast of Singapore Anhydrides? Market Revenues & Volume By Acetic Anhydride for the Period 2020-2030
- Historical Data and Forecast of Singapore Anhydrides? Market Revenues & Volume By Maleic Anhydride for the Period 2020-2030
- Historical Data and Forecast of Singapore Anhydrides? Market Revenues & Volume By Isobutyric Anhydride for the Period 2020-2030
- Historical Data and Forecast of Singapore Anhydrides? Market Revenues & Volume By Propionic Anhydride for the Period 2020-2030
- Historical Data and Forecast of Singapore Anhydrides? Market Revenues & Volume By Phthalic Anhydride for the Period 2020-2030
- Historical Data and Forecast of Singapore Anhydrides? Market Revenues & Volume By Isatoic Acid Anhydride for the Period 2020-2030
- Historical Data and Forecast of Singapore Anhydrides? Market Revenues & Volume By Others for the Period 2020-2030
- Historical Data and Forecast of Singapore Anhydrides? Market Revenues & Volume By Application for the Period 2020-2030
- Historical Data and Forecast of Singapore Anhydrides? Market Revenues & Volume By Pesticides for the Period 2020-2030
- Historical Data and Forecast of Singapore Anhydrides? Market Revenues & Volume By Plasticizers for the Period 2020-2030
- Historical Data and Forecast of Singapore Anhydrides? Market Revenues & Volume By Dyes & Pigments for the Period 2020-2030
- Historical Data and Forecast of Singapore Anhydrides? Market Revenues & Volume By Additives for the Period 2020-2030
- Historical Data and Forecast of Singapore Anhydrides? Market Revenues & Volume By Flavors for the Period 2020-2030
- Historical Data and Forecast of Singapore Anhydrides? Market Revenues & Volume By Others for the Period 2020-2030
- Historical Data and Forecast of Singapore Anhydrides? Market Revenues & Volume By End-Use Industry for the Period 2020-2030
- Historical Data and Forecast of Singapore Anhydrides? Market Revenues & Volume By Construction for the Period 2020-2030
- Historical Data and Forecast of Singapore Anhydrides? Market Revenues & Volume By Pharmaceuticals for the Period 2020-2030
- Historical Data and Forecast of Singapore Anhydrides? Market Revenues & Volume By Automotive for the Period 2020-2030
- Historical Data and Forecast of Singapore Anhydrides? Market Revenues & Volume By Agrochemicals for the Period 2020-2030
- Historical Data and Forecast of Singapore Anhydrides? Market Revenues & Volume By Textiles for the Period 2020-2030
- Historical Data and Forecast of Singapore Anhydrides? Market Revenues & Volume By Food & Beverages for the Period 2020-2030
- Historical Data and Forecast of Singapore Anhydrides? Market Revenues & Volume By Others for the Period 2020-2030
- Singapore Anhydrides? Import Export Trade Statistics
- Market Opportunity Assessment By Composition
- Market Opportunity Assessment By Types
- Market Opportunity Assessment By Application
- Market Opportunity Assessment By End-Use Industry
- Singapore Anhydrides? Top Companies Market Share
- Singapore Anhydrides? Competitive Benchmarking By Technical and Operational Parameters
- Singapore Anhydrides? Company Profiles
- Singapore Anhydrides? Key Strategic Recommendations
Frequently Asked Questions About the Market Study (FAQs):
6Wresearch actively monitors the Singapore Anhydrides Market and publishes its comprehensive annual report, highlighting emerging trends, growth drivers, revenue analysis, and forecast outlook. Our insights help businesses to make data-backed strategic decisions with ongoing market dynamics. Our analysts track relevent industries related to the Singapore Anhydrides Market, allowing our clients with actionable intelligence and reliable forecasts tailored to emerging regional needs.
Yes, we provide customisation as per your requirements. To learn more, feel free to contact us on sales@6wresearch.com
1 Executive Summary |
2 Introduction |
2.1 Key Highlights of the Report |
2.2 Report Description |
2.3 Market Scope & Segmentation |
2.4 Research Methodology |
2.5 Assumptions |
3 Singapore Anhydrides Market Overview |
3.1 Singapore Country Macro Economic Indicators |
3.2 Singapore Anhydrides Market Revenues & Volume, 2020 & 2030F |
3.3 Singapore Anhydrides Market - Industry Life Cycle |
3.4 Singapore Anhydrides Market - Porter's Five Forces |
3.5 Singapore Anhydrides Market Revenues & Volume Share, By Composition, 2020 & 2030F |
3.6 Singapore Anhydrides Market Revenues & Volume Share, By Types, 2020 & 2030F |
3.7 Singapore Anhydrides Market Revenues & Volume Share, By Application, 2020 & 2030F |
3.8 Singapore Anhydrides Market Revenues & Volume Share, By End-Use Industry, 2020 & 2030F |
4 Singapore Anhydrides Market Dynamics |
4.1 Impact Analysis |
4.2 Market Drivers |
4.3 Market Restraints |
5 Singapore Anhydrides Market Trends |
6 Singapore Anhydrides Market, By Types |
6.1 Singapore Anhydrides Market, By Composition |
6.1.1 Overview and Analysis |
6.1.2 Singapore Anhydrides Market Revenues & Volume, By Composition, 2020-2030F |
6.1.3 Singapore Anhydrides Market Revenues & Volume, By Inorganic, 2020-2030F |
6.1.4 Singapore Anhydrides Market Revenues & Volume, By Organic, 2020-2030F |
6.2 Singapore Anhydrides Market, By Types |
6.2.1 Overview and Analysis |
6.2.2 Singapore Anhydrides Market Revenues & Volume, By Acetic Anhydride, 2020-2030F |
6.2.3 Singapore Anhydrides Market Revenues & Volume, By Maleic Anhydride, 2020-2030F |
6.2.4 Singapore Anhydrides Market Revenues & Volume, By Isobutyric Anhydride, 2020-2030F |
6.2.5 Singapore Anhydrides Market Revenues & Volume, By Propionic Anhydride, 2020-2030F |
6.2.6 Singapore Anhydrides Market Revenues & Volume, By Phthalic Anhydride, 2020-2030F |
6.2.7 Singapore Anhydrides Market Revenues & Volume, By Isatoic Acid Anhydride, 2020-2030F |
6.3 Singapore Anhydrides Market, By Application |
6.3.1 Overview and Analysis |
6.3.2 Singapore Anhydrides Market Revenues & Volume, By Pesticides, 2020-2030F |
6.3.3 Singapore Anhydrides Market Revenues & Volume, By Plasticizers, 2020-2030F |
6.3.4 Singapore Anhydrides Market Revenues & Volume, By Dyes & Pigments, 2020-2030F |
6.3.5 Singapore Anhydrides Market Revenues & Volume, By Additives, 2020-2030F |
6.3.6 Singapore Anhydrides Market Revenues & Volume, By Flavors, 2020-2030F |
6.3.7 Singapore Anhydrides Market Revenues & Volume, By Others, 2020-2030F |
6.4 Singapore Anhydrides Market, By End-Use Industry |
6.4.1 Overview and Analysis |
6.4.2 Singapore Anhydrides Market Revenues & Volume, By Construction, 2020-2030F |
6.4.3 Singapore Anhydrides Market Revenues & Volume, By Pharmaceuticals, 2020-2030F |
6.4.4 Singapore Anhydrides Market Revenues & Volume, By Automotive, 2020-2030F |
6.4.5 Singapore Anhydrides Market Revenues & Volume, By Agrochemicals, 2020-2030F |
6.4.6 Singapore Anhydrides Market Revenues & Volume, By Textiles, 2020-2030F |
6.4.7 Singapore Anhydrides Market Revenues & Volume, By Food & Beverages, 2020-2030F |
7 Singapore Anhydrides Market Import-Export Trade Statistics |
7.1 Singapore Anhydrides Market Export to Major Countries |
7.2 Singapore Anhydrides Market Imports from Major Countries |
8 Singapore Anhydrides Market Key Performance Indicators |
9 Singapore Anhydrides Market - Opportunity Assessment |
9.1 Singapore Anhydrides Market Opportunity Assessment, By Composition, 2020 & 2030F |
9.2 Singapore Anhydrides Market Opportunity Assessment, By Types, 2020 & 2030F |
9.3 Singapore Anhydrides Market Opportunity Assessment, By Application, 2020 & 2030F |
9.4 Singapore Anhydrides Market Opportunity Assessment, By End-Use Industry, 2020 & 2030F |
10 Singapore Anhydrides Market - Competitive Landscape |
10.1 Singapore Anhydrides Market Revenue Share, By Companies, 2023 |
10.2 Singapore Anhydrides Market Competitive Benchmarking, By Operating and Technical Parameters |
11 Company Profiles |
12 Recommendations |
13 Disclaimer |
Global Go To Market Strategy - 2030
Export potential enables firms to identify high-growth global markets with greater confidence by combining advanced trade intelligence with a structured quantitative methodology. The framework analyzes emerging demand trends and country-level import patterns while integrating macroeconomic and trade datasets such as GDP and population forecasts, bilateral import–export flows, tariff structures, elasticity differentials between developed and developing economies, geographic distance, and import demand projections. Using weighted trade values from 2020–2024 as the base period to project country-to-country export potential for 2030, these inputs are operationalized through calculated drivers such as gravity model parameters, tariff impact factors, and projected GDP per-capita growth. Through an analysis of hidden potentials, demand hotspots, and market conditions that are most favorable to success, this method enables firms to focus on target countries, maximize returns, and global expansion with data, backed by accuracy.
By factoring in the projected importer demand gap that is currently unmet and could be potential opportunity, it identifies the potential for the Exporter (Country) among 190 countries, against the general trade analysis, which identifies the biggest importer or exporter.
To discover high-growth global markets and optimize your business strategy:
Click Here
Pricing
- Single User License$ 1,995
- Department License$ 2,400
- Site License$ 3,120
- Global License$ 3,795

Leadership Perspectives from Industry Events
Search
Thought Leadership and Analyst Meet


Our Clients
6WResearch In News
- India Air Conditioner Market Set for Strong Rebound in 2026 After Weather-Led Correction and GST-Driven Recovery: 6Wresearch
- ADAS in India: How Automatic Emergency Braking, Blind Spot Detection & Driver Monitoring are Transforming Road Safety
- Doha a strategic location for EV manufacturing hub: IPA Qatar
- Demand for luxury TVs surging in the GCC, says Samsung
- Empowering Growth: The Thriving Journey of Bangladesh’s Cable Industry
- Demand for luxury TVs surging in the GCC, says Samsung
Latest Reports
- Poland Fire Protection Systems Market (2026-2032)
- Cape Verde Portable Hand-Thrown Extinguisher Market (2026-2032)
- Canada Portable Hand-Thrown Extinguisher Market (2026-2032)
- Cameroon Portable Hand-Thrown Extinguisher Market (2026-2032)
- Burundi Portable Hand-Thrown Extinguisher Market (2026-2032)
- Burkina Faso Portable Hand-Thrown Extinguisher Market (2026-2032)
- Bulgaria Portable Hand-Thrown Extinguisher Market (2026-2032)
- Brunei Portable Hand-Thrown Extinguisher Market (2026-2032)
- Botswana Portable Hand-Thrown Extinguisher Market (2026-2032)
- Bosnia and Herzegovina Portable Hand-Thrown Extinguisher Market (2026-2032)
Industry Events and Analyst Meet

HIMTEX 2026

India Refining Summit 2026

India EV Show 2026

EV tech India Expo 2026

Auto Tech Asia 2026
Whitepaper
- Middle East & Africa Commercial Security Market Click here to view more.
- Middle East & Africa Fire Safety Systems & Equipment Market Click here to view more.
- GCC Drone Market Click here to view more.
- Middle East Lighting Fixture Market Click here to view more.
- GCC Physical & Perimeter Security Market Click here to view more.