Singapore Collagen Drinks Market (2026-2032) | Demand, Trends, Forecast, Value, Segments, Analysis, Industry, Pricing Analysis, Segmentation, Strategic Insights, Companies, Share, Strategy, Restraints, Revenue, Competition, Drivers, Outlook, Growth, Size, Challenges, Competitive, Investment Trends, Opportunities, Consumer Insights, Supply
Market Forecast By Flavor (Original, Strawberry, Blueberry, Grape), By Form (Powder, Liquid, Capsules, Gummies), By Source (Bovine, Porcine, Marine, Chicken), By Type (Hydrolyzed, Unhydrolyzed, Denatured, Gelatin), By Application (Skin Health, Hair Growth, Nail Strengthening, Joint Pain Relief) And Competitive Landscape
| Product Code: ETC11622247 | Publication Date: Apr 2025 | Updated Date: Mar 2026 | Product Type: Market Research Report | |
| Publisher: 6Wresearch | No. of Pages: 65 | No. of Figures: 34 | No. of Tables: 19 | |
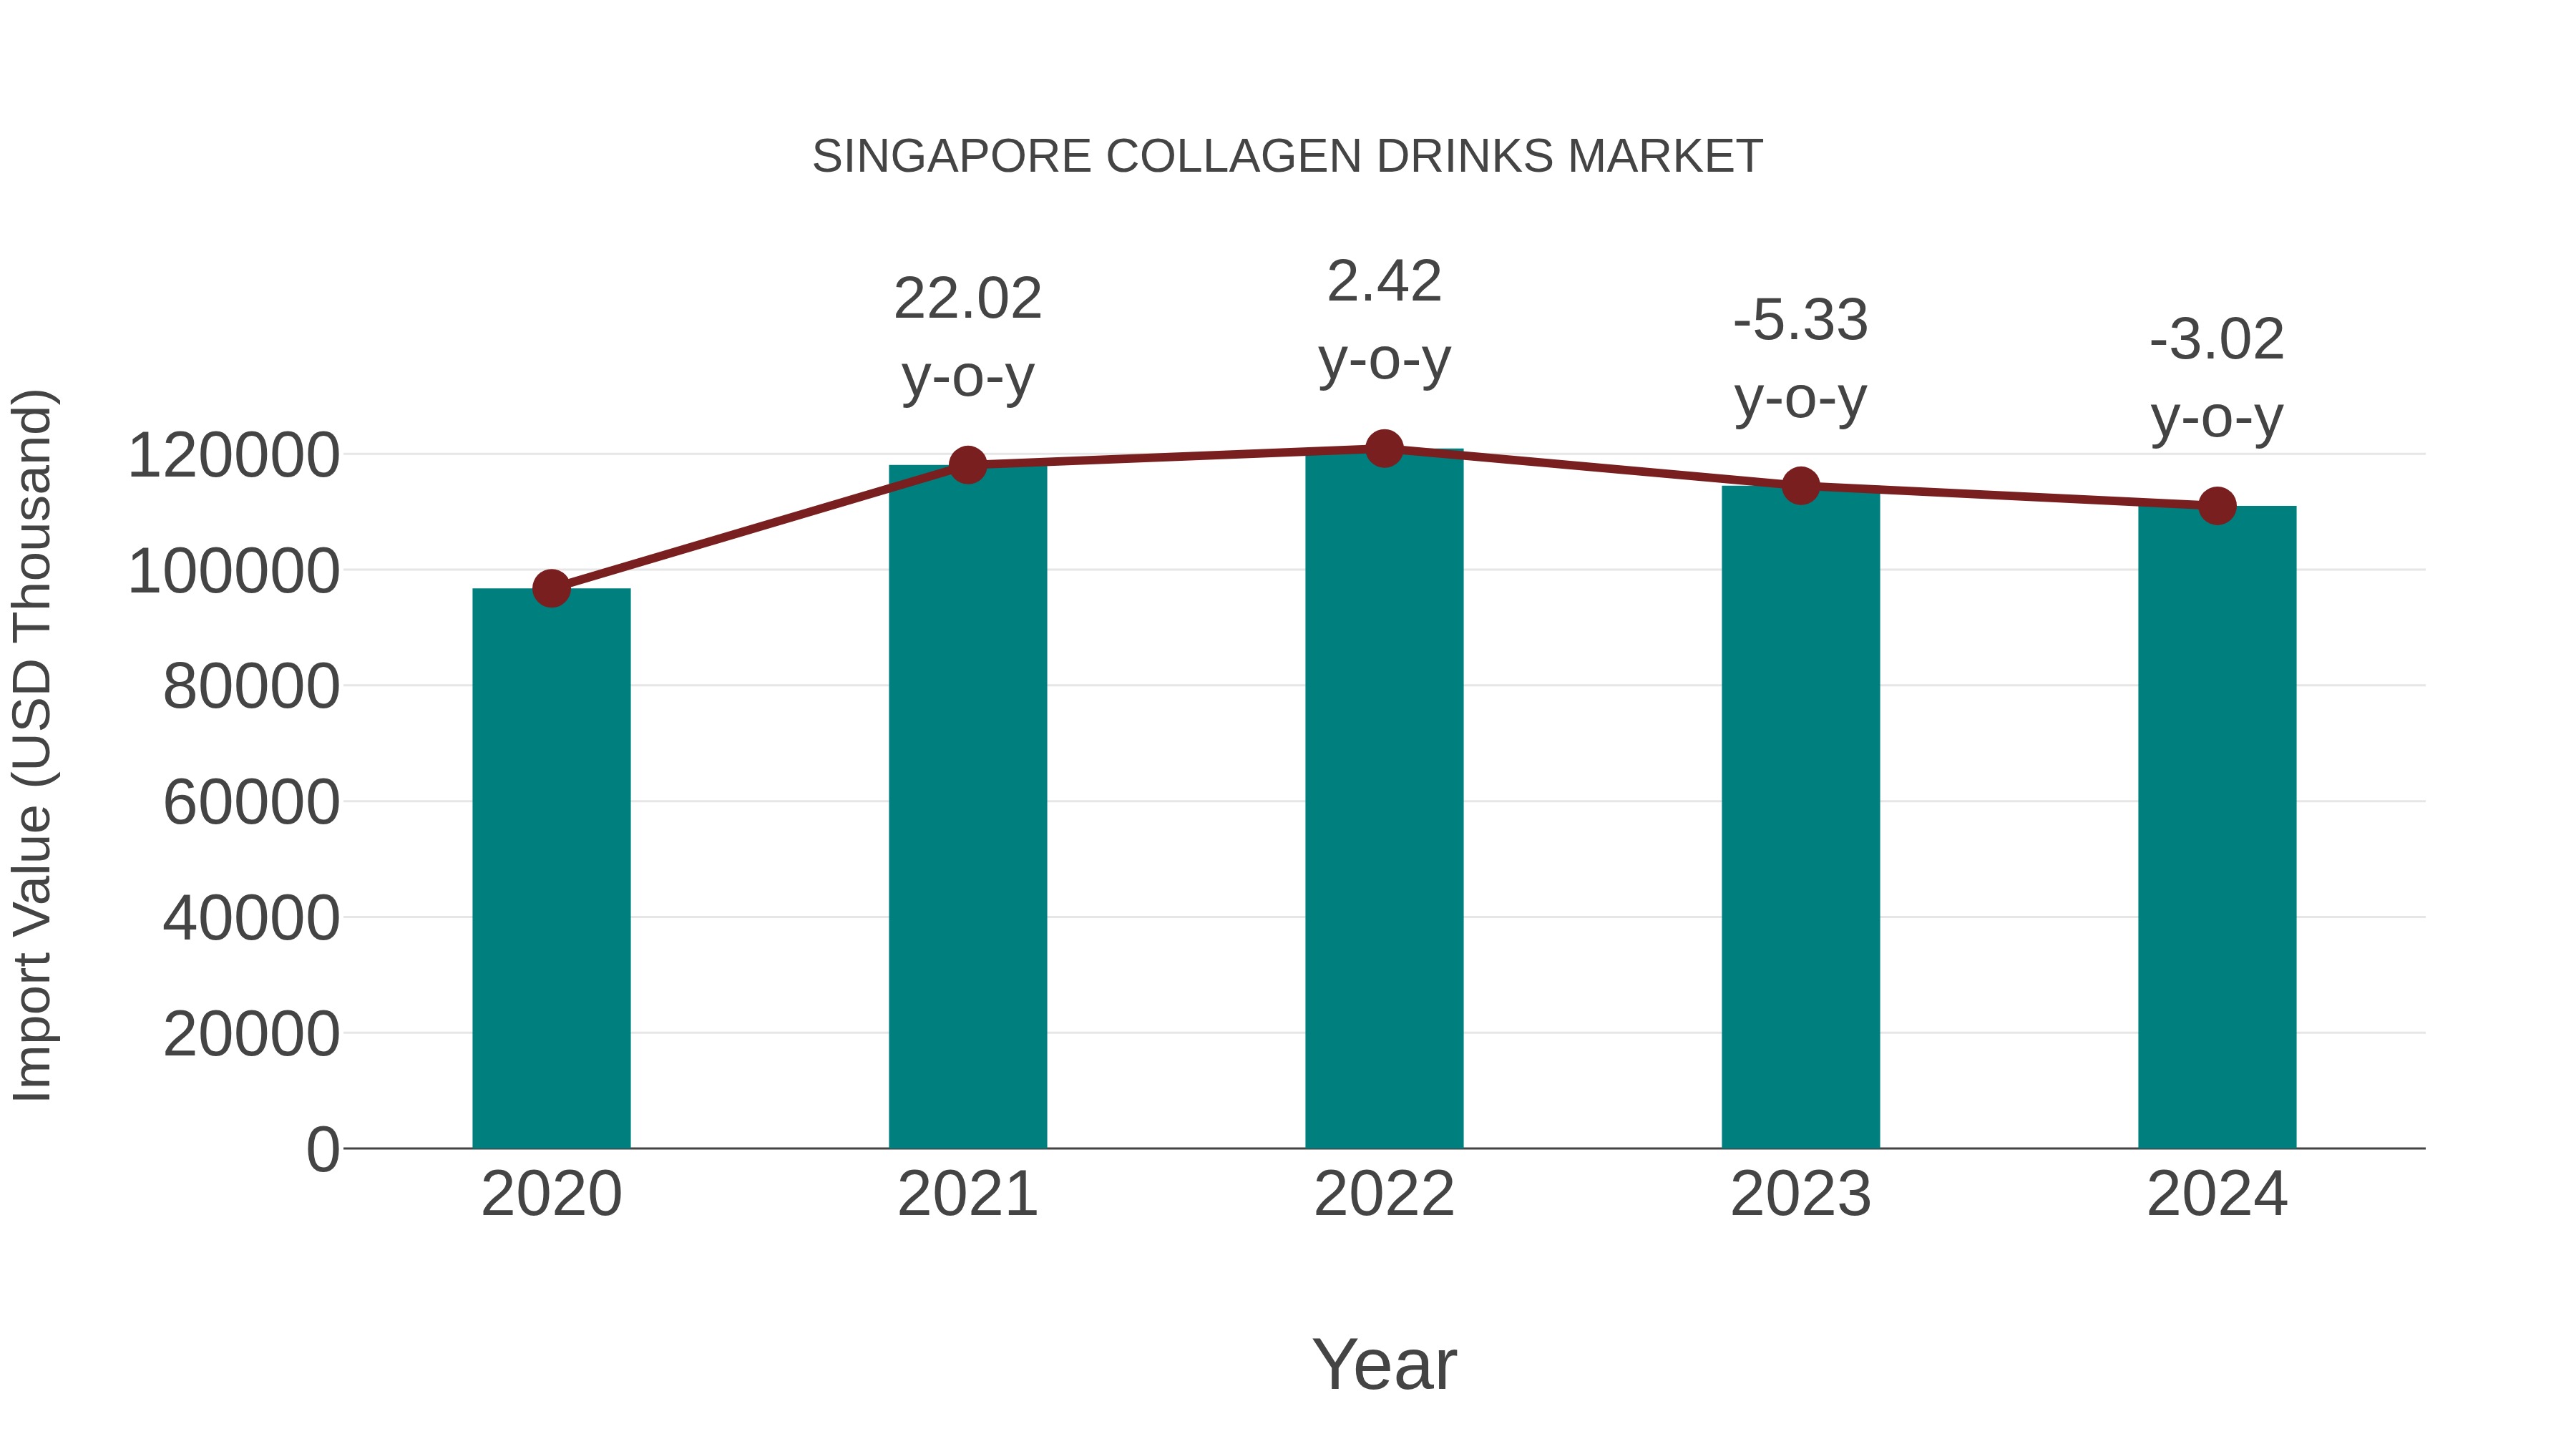
Singapore Collagen Drinks Market: Import Trend Analysis
In the Singapore collagen drinks market, the import trend experienced a slight decline from 2023 to 2024, with a growth rate of -3.02%. However, the compound annual growth rate (CAGR) for imports over the period 2020-2024 stood at 3.5%. This dip in growth could be attributed to shifting consumer preferences or changes in trade policies impacting import momentum.
Singapore Collagen Drinks Market Growth Rate
According to 6Wresearch internal database and industry insights, the Singapore Collagen Drinks Market is projected to grow at a compound annual growth rate (CAGR) of 9.2% during the forecast period (2026-2032).
Topics Covered in the Singapore Collagen Drinks Market Report
The Singapore Collagen Drinks Market report thoroughly covers the market by flavor, form, source, type, and application. The market report provides an unbiased and detailed analysis of ongoing market trends, opportunities/high growth areas, and market drivers, which help stakeholders devise and align their market strategies according to the current and future market dynamics.
Singapore Collagen Drinks Market Highlights
| Report Name | Singapore Collagen Drinks Market |
| Forecast period | 2026-2032 |
| CAGR | 9.2% |
| Growing Sector | Skin Health |
Singapore Collagen Drinks Market Synopsis
Singapore Collagen Drinks Market is anticipated to record notable growth due to rising consumer preference for convenient, ready-to-consume beauty and wellness supplements. People are choosing collagen-infused drinks as they are more aware of the benefits of anti-aging, skin health, and overall health. A strong retail presence, premiumization, and new flavor options are also good for the market. The market is also growing due to more working professionals and young people want the products. The availability of superior product offerings and marketing strategies is also driving the collagen drink market in Singapore.
Evaluation of Growth Drivers in the Singapore Collagen Drinks Market
Below mentioned are some prominent drivers and their influence on the market dynamics:
| Drivers | Primary Segments Affected | Why it Matters (Evidence) |
| Rising Demand for Ready-to-Drink Supplements | Liquid; Skin Health | Consumers prefer convenient formats that require no preparation. |
| Growing Beauty and Wellness Awareness | Hydrolyzed; Skin Health | Increased focus on anti-aging drives collagen drink consumption. |
| Expansion of Premium Beverage Brands | All Types; Food & Retail | Premium positioning attracts health-conscious urban consumers. |
| Strong E-commerce and Retail Channels | Liquid & Powder; All Applications | Easy availability boosts product accessibility and sales. |
| Influence of Social Media Marketing | Flavored Variants; Skin & Hair | Influencer promotion increases product visibility and demand. |
Singapore Collagen Drinks Market is expected to grow at the CAGR of 9.2% during the forecast period of 2026-2032. The growth of the market can be attributed to the increase in demand for convenient health supplements from consumers and the rising awareness of the benefits associated with the use of collagen, especially for the health and well-being of the skin, hair, and joints. The growth of premium wellness beverage brands and strong retail channels also plays a significant part in the growth of the market. Moreover, the rising trend of social media marketing and celebrity endorsements has boosted the demand for the product.
Evaluation of Restraints in the Singapore Collagen Drinks Market
Below mentioned are some major restraints and their influence on the market dynamics:
| Restraints | Primary Segments Affected | What This Means (Evidence) |
| High Product Pricing | Liquid; Premium Segment | Premium collagen drinks may limit affordability for mass consumers. |
| Limited Scientific Awareness | All Types; General Consumers | Some consumers lack awareness of the product's effectiveness. |
| Regulatory Compliance with Health Claims | All Types; Retail | Difficult label restrictions could limit marketing options. |
| Dependence on Imported Materials | Marine & Bovine; Manufacturing | Cost and availability could be a problem. |
| Competition from Alternative Supplements | Capsules & Gummies; Nutritional | Could limit the adoption of collagen drinks. |
Singapore Collagen Drinks Industry Challenges
Despite strong demand growth, the Singapore Collagen Drinks Industry faces several practical challenges that could impact its long-term expansion. One of the major issues is the relatively high pricing of collagen drinks, which may limit adoption among price-sensitive consumers. Moreover, some customers may be skeptical about the scientific efficacy of collagen drinks, which may influence repurchase behavior. Moreover, health claim regulations imposed by the government also need to be taken into consideration while planning marketing strategies. Furthermore, the reliance of the industry on imported raw materials makes the business vulnerable, whereas the rise of other supplement formats, such as capsules and powder, adds to the challenge of constant innovation.
Singapore Collagen Drinks Market Trends
Major trends driving the expansion of the Singapore Collagen Drinks Market Growth are:
- Rise of Flavored Collagen Beverages: Manufacturers are adding flavors such as strawberry, blueberry, and grape, which are popular among consumers and increase the marketability of collagen drinks.
- Growth of Beauty: Collagen drinks are gaining traction as a part of a comprehensive beauty regime. Consumers are increasingly turning to collagen drinks as a means of attaining beautiful and healthy-looking skin.
- Premiumization of Health Beverages: Manufacturers of collagen drinks are focusing on premiumization, which appeals to the high-end consumer segment.
Investment Opportunities in the Singapore Collagen Drinks Market
Some best investment Opportunities in the Singapore Collagen Drinks Market are:
- Expansion in Flavored Product Lines – Flavored drink products can be developed to increase engagement among consumers. Younger consumers can be targeted with a favorable flavor profile.
- E-commerce and Digital Marketing – Digital marketing can be used to increase brand visibility. This is an effective marketing strategy for a technology-driven country like Singapore.
- Functional Ingredient Integration – Vitamins can be added to Collagen drink products. This will increase the overall value for consumers. The target audience will increase as well.
- Local Manufacturing Capabilities – Local manufacturing units can be developed. This will reduce reliance on imported products. Costs can be reduced as well.
Top 5 Leading Players in the Singapore Collagen Drinks Market
Some leading players operating in the Singapore Collagen Drinks Market include:
1. Shiseido Co., Ltd.
| Company Name | Shiseido Co., Ltd. |
|---|---|
| Established Year | 1872 |
| Headquarters | Tokyo, Japan |
| Official Website | Click Here |
Shiseido Co., Ltd. offers premium collagen drinks focused on beauty and skincare benefits. The company combines advanced research with high-quality ingredients to deliver products that enhance skin health, targeting consumers seeking luxury wellness and “beauty-from-within” solutions.
2. Amway Corporation
| Company Name | Amway Corporation |
|---|---|
| Established Year | 1959 |
| Headquarters | Michigan, USA |
| Official Website | Click Here |
Amway Corporation provides collagen-based nutritional supplements, including drink formats, targeting health and wellness consumers. Its strong global distribution network and established brand reputation support widespread adoption of its products, including in markets such as Singapore.
3. Kinohimitsu
| Company Name | Kinohimitsu |
|---|---|
| Established Year | 1998 |
| Headquarters | Singapore |
| Official Website | Click Here |
Kinohimitsu specializes in collagen drinks and beauty supplements designed for skin health and anti-aging benefits. The brand is well known across Asia for its innovative formulations and strong presence in both retail outlets and online distribution channels.
4. Meiji Holdings Co., Ltd.
| Company Name | Meiji Holdings Co., Ltd. |
|---|---|
| Established Year | 1916 |
| Headquarters | Tokyo, Japan |
| Official Website | Click Here |
Meiji Holdings Co., Ltd. offers collagen-enriched beverages that combine nutrition with taste. The company leverages its expertise in food and health products to deliver high-quality collagen drinks with functional benefits, appealing to a wide consumer base.
5. Fancl Corporation
| Company Name | Fancl Corporation |
|---|---|
| Established Year | 1980 |
| Headquarters | Yokohama, Japan |
| Official Website | Click Here |
Fancl Corporation develops collagen drinks focused on purity and additive-free formulations. The company emphasizes product safety and effectiveness, catering to health-conscious consumers who prefer clean-label and reliable dietary supplements.
Government Regulations Introduced in the Singapore Collagen Drinks Market
According to Singapore’s Government Data, Regulatory agencies like the Health Sciences Authority (HSA) and Singapore Food Agency (SFA) oversee that collagen beverages comply with rigorous safety and quality requirements. These agencies check to see that the labels, the health benefits claims, and the ingredients authorization are all safe for the users. Additionally, the government initiatives of the Health Promotion Board promote healthy drinking habits which thereby indirectly raise the demand for functional drinks. For instance, the initiatives taken towards wellness and preventive care have created awareness about nutritional supplements, which include collagen drinks. All these factors create a well-structured market environment.
Future Insights of the Singapore Collagen Drinks Market
Singapore Collagen Drinks Market Share is expected to witness strong growth in the coming years due to increasing consumer focus on convenience, wellness, and beauty enhancement. The market will also benefit from ongoing innovation in the formulation of products, which will involve the addition of functional ingredients and taste profile improvement. The ongoing expansion of digital marketing strategies will also contribute to the improvement of the reach of products. The increasing demand for premium health products will also contribute to the shaping of trends in the market. The ongoing supportive environment, along with increasing health awareness, will contribute to the growth of the market.
Market Segmentation Analysis
The report offers a comprehensive study of the subsequent market segments and their leading categories.
Original Flavor to Dominate the Market – By Flavor
According to Mohit, Senior Research Analyst, 6Wresearch, the Original flavor category accounts for the highest share in the Singapore Collagen Drinks Market. This dominance is attributed to its broad consumer acceptance, minimal additives, and perception of being a more natural and healthier option. Consumers who prefer low-sugar and clean-label products often choose original variants over flavored alternatives. Also, original collagen drinks are generally recommended in health practices due to their taste and compatibility with the health habits of consumers. This further supports the dominance of original collagen drinks in the market.
Liquid to Dominate the Market – By Form
Liquid collagen drinks lead the market by their readiness for consumption and the rapid rate of absorption. Liquid collagen is preferred due to its convenience, especially among working professionals.
Skin Health to Dominate the Market – By Application
The skin health segment leads due to increasing demand for anti-aging and beauty enhancement products. Consumers primarily consume collagen drinks to improve skin elasticity and hydration.
Key Attractiveness of the Report
- 10 Years of Market Numbers.
- Historical Data Starting from 2022 to 2025.
- Base Year: 2025.
- Forecast Data until 2032.
- Key Performance Indicators Impacting the Market.
- Major Upcoming Developments and Projects.
Key Highlights of the Report:
- Singapore Collagen Drinks Market Outlook
- Market Size of Singapore Collagen Drinks Market, 2025
- Forecast of Singapore Collagen Drinks Market, 2032
- Historical Data and Forecast of Singapore Collagen Drinks Revenues & Volume for the Period 2022-2032F
- Singapore Collagen Drinks Market Trend Evolution
- Singapore Collagen Drinks Market Drivers and Challenges
- Singapore Collagen Drinks Price Trends
- Singapore Collagen Drinks Porter's Five Forces
- Singapore Collagen Drinks Industry Life Cycle
- Historical Data and Forecast of Singapore Collagen Drinks Market Revenues & Volume By Flavor for the Period 2022-2032F
- Historical Data and Forecast of Singapore Collagen Drinks Market Revenues & Volume By Original for the Period 2022-2032F
- Historical Data and Forecast of Singapore Collagen Drinks Market Revenues & Volume By Strawberry for the Period 2022-2032F
- Historical Data and Forecast of Singapore Collagen Drinks Market Revenues & Volume By Blueberry for the Period 2022-2032F
- Historical Data and Forecast of Singapore Collagen Drinks Market Revenues & Volume By Grape for the Period 2022-2032F
- Historical Data and Forecast of Singapore Collagen Drinks Market Revenues & Volume By Form for the Period 2022-2032F
- Historical Data and Forecast of Singapore Collagen Drinks Market Revenues & Volume By Powder for the Period 2022-2032F
- Historical Data and Forecast of Singapore Collagen Drinks Market Revenues & Volume By Liquid for the Period 2022-2032F
- Historical Data and Forecast of Singapore Collagen Drinks Market Revenues & Volume By Capsules for the Period 2022-2032F
- Historical Data and Forecast of Singapore Collagen Drinks Market Revenues & Volume By Gummies for the Period 2022-2032F
- Historical Data and Forecast of Singapore Collagen Drinks Market Revenues & Volume By Source for the Period 2022-2032F
- Historical Data and Forecast of Singapore Collagen Drinks Market Revenues & Volume By Bovine for the Period 2022-2032F
- Historical Data and Forecast of Singapore Collagen Drinks Market Revenues & Volume By Porcine for the Period 2022-2032F
- Historical Data and Forecast of Singapore Collagen Drinks Market Revenues & Volume By Marine for the Period 2022-2032F
- Historical Data and Forecast of Singapore Collagen Drinks Market Revenues & Volume By Chicken for the Period 2022-2032F
- Historical Data and Forecast of Singapore Collagen Drinks Market Revenues & Volume By Type for the Period 2022-2032F
- Historical Data and Forecast of Singapore Collagen Drinks Market Revenues & Volume By Hydrolyzed for the Period 2022-2032F
- Historical Data and Forecast of Singapore Collagen Drinks Market Revenues & Volume By Unhydrolyzed for the Period 2022-2032F
- Historical Data and Forecast of Singapore Collagen Drinks Market Revenues & Volume By Denatured for the Period 2022-2032F
- Historical Data and Forecast of Singapore Collagen Drinks Market Revenues & Volume By Gelatin for the Period 2022-2032F
- Historical Data and Forecast of Singapore Collagen Drinks Market Revenues & Volume By Application for the Period 2022-2032F
- Historical Data and Forecast of Singapore Collagen Drinks Market Revenues & Volume By Skin Health for the Period 2022-2032F
- Historical Data and Forecast of Singapore Collagen Drinks Market Revenues & Volume By Hair Growth for the Period 2022-2032F
- Historical Data and Forecast of Singapore Collagen Drinks Market Revenues & Volume By Nail Strengthening for the Period 2022-2032F
- Historical Data and Forecast of Singapore Collagen Drinks Market Revenues & Volume By Joint Pain Relief for the Period 2022 - 2032F
- Singapore Collagen Drinks Import Export Trade Statistics
- Market Opportunity Assessment By Flavor
- Market Opportunity Assessment By Form
- Market Opportunity Assessment By Source
- Market Opportunity Assessment By Type
- Market Opportunity Assessment By Application
- Singapore Collagen Drinks Top Companies Market Share
- Singapore Collagen Drinks Competitive Benchmarking By Technical and Operational Parameters
- Singapore Collagen Drinks Company Profiles
- Singapore Collagen Drinks Key Strategic Recommendations
Market Covered
The report offers a comprehensive study of the subsequent market segments:
By Flavor
- Original
- Strawberry
- Blueberry
- Grape
By Form
- Powder
- Liquid
- Capsules
- Gummies
By Source
- Bovine
- Porcine
- Marine
- Chicken
By Type
- Hydrolyzed
- Unhydrolyzed
- Denatured
- Gelatin
By Application
- Skin Health
- Hair Growth
- Nail Strengthening
- Joint Pain Relief
Singapore Collagen Drinks Market (2026-2032): FAQs
The Singapore Collagen Drinks Market is projected to grow at a CAGR of 9.2% during the forecast period 2026-2032.
The market is expected to experience steady growth driven by increasing consumer awareness of beauty-from-within products, rising demand for functional beverages, and a strong health-conscious population.
Challenges for the market include the high price of the product, complying with regulations regarding health claims, and the availability of other forms of supplements.
HSA and SFA regulations help in maintaining the quality and safety of the product, which in turn increases consumer confidence in the market.
6Wresearch actively monitors the Singapore Collagen Drinks Market and publishes its comprehensive annual report, highlighting emerging trends, growth drivers, revenue analysis, and forecast outlook. Our insights help businesses to make data-backed strategic decisions with ongoing market dynamics. Our analysts track relevent industries related to the Singapore Collagen Drinks Market, allowing our clients with actionable intelligence and reliable forecasts tailored to emerging regional needs.
Yes, we provide customisation as per your requirements. To learn more, feel free to contact us on sales@6wresearch.com
| 1 Executive Summary |
| 2 Introduction |
| 2.1 Key Highlights of the Report |
| 2.2 Report Description |
| 2.3 Market Scope & Segmentation |
| 2.4 Research Methodology |
| 2.5 Assumptions |
| 3 Singapore Collagen Drinks Market Overview |
| 3.1 Singapore Country Macro Economic Indicators |
| 3.2 Singapore Collagen Drinks Market Revenues & Volume, 2022 & 2032F |
| 3.3 Singapore Collagen Drinks Market - Industry Life Cycle |
| 3.4 Singapore Collagen Drinks Market - Porter's Five Forces |
| 3.5 Singapore Collagen Drinks Market Revenues & Volume Share, By Flavor, 2022 & 2032F |
| 3.6 Singapore Collagen Drinks Market Revenues & Volume Share, By Form, 2022 & 2032F |
| 3.7 Singapore Collagen Drinks Market Revenues & Volume Share, By Source, 2022 & 2032F |
| 3.8 Singapore Collagen Drinks Market Revenues & Volume Share, By Type, 2022 & 2032F |
| 3.9 Singapore Collagen Drinks Market Revenues & Volume Share, By Application, 2022 & 2032F |
| 4 Singapore Collagen Drinks Market Dynamics |
| 4.1 Impact Analysis |
| 4.2 Market Drivers |
| 4.2.1 Increasing consumer awareness about health and wellness benefits of collagen drinks |
| 4.2.2 Growing demand for beauty and anti-aging products in Singapore |
| 4.2.3 Adoption of collagen drinks as a convenient dietary supplement |
| 4.3 Market Restraints |
| 4.3.1 High competition among collagen drink brands in the market |
| 4.3.2 Price sensitivity among consumers due to premium pricing of collagen drinks |
| 4.3.3 Regulatory restrictions on health claims and product labeling for collagen drinks |
| 5 Singapore Collagen Drinks Market Trends |
| 6 Singapore Collagen Drinks Market, By Types |
| 6.1 Singapore Collagen Drinks Market, By Flavor |
| 6.1.1 Overview and Analysis |
| 6.1.2 Singapore Collagen Drinks Market Revenues & Volume, By Flavor, 2022 - 2032F |
| 6.1.3 Singapore Collagen Drinks Market Revenues & Volume, By Original, 2022 - 2032F |
| 6.1.4 Singapore Collagen Drinks Market Revenues & Volume, By Strawberry, 2022 - 2032F |
| 6.1.5 Singapore Collagen Drinks Market Revenues & Volume, By Blueberry, 2022 - 2032F |
| 6.1.6 Singapore Collagen Drinks Market Revenues & Volume, By Grape, 2022 - 2032F |
| 6.1.7 Singapore Collagen Drinks Market Revenues & Volume, By Orange, 2022 - 2032F |
| 6.2 Singapore Collagen Drinks Market, By Form |
| 6.2.1 Overview and Analysis |
| 6.2.2 Singapore Collagen Drinks Market Revenues & Volume, By Powder, 2022 - 2032F |
| 6.2.3 Singapore Collagen Drinks Market Revenues & Volume, By Liquid, 2022 - 2032F |
| 6.2.4 Singapore Collagen Drinks Market Revenues & Volume, By Capsules, 2022 - 2032F |
| 6.2.5 Singapore Collagen Drinks Market Revenues & Volume, By Gummies, 2022 - 2032F |
| 6.3 Singapore Collagen Drinks Market, By Source |
| 6.3.1 Overview and Analysis |
| 6.3.2 Singapore Collagen Drinks Market Revenues & Volume, By Bovine, 2022 - 2032F |
| 6.3.3 Singapore Collagen Drinks Market Revenues & Volume, By Porcine, 2022 - 2032F |
| 6.3.4 Singapore Collagen Drinks Market Revenues & Volume, By Marine, 2022 - 2032F |
| 6.3.5 Singapore Collagen Drinks Market Revenues & Volume, By Chicken, 2022 - 2032F |
| 6.4 Singapore Collagen Drinks Market, By Type |
| 6.4.1 Overview and Analysis |
| 6.4.2 Singapore Collagen Drinks Market Revenues & Volume, By Hydrolyzed, 2022 - 2032F |
| 6.4.3 Singapore Collagen Drinks Market Revenues & Volume, By Unhydrolyzed, 2022 - 2032F |
| 6.4.4 Singapore Collagen Drinks Market Revenues & Volume, By Denatured, 2022 - 2032F |
| 6.4.5 Singapore Collagen Drinks Market Revenues & Volume, By Gelatin, 2022 - 2032F |
| 6.5 Singapore Collagen Drinks Market, By Application |
| 6.5.1 Overview and Analysis |
| 6.5.2 Singapore Collagen Drinks Market Revenues & Volume, By Skin Health, 2022 - 2032F |
| 6.5.3 Singapore Collagen Drinks Market Revenues & Volume, By Hair Growth, 2022 - 2032F |
| 6.5.4 Singapore Collagen Drinks Market Revenues & Volume, By Nail Strengthening, 2022 - 2032F |
| 6.5.5 Singapore Collagen Drinks Market Revenues & Volume, By Joint Pain Relief, 2022 - 2032F |
| 7 Singapore Collagen Drinks Market Import-Export Trade Statistics |
| 7.1 Singapore Collagen Drinks Market Export to Major Countries |
| 7.2 Singapore Collagen Drinks Market Imports from Major Countries |
| 8 Singapore Collagen Drinks Market Key Performance Indicators |
| 8.1 Consumer engagement on social media platforms for collagen drink brands |
| 8.2 Number of new product launches and innovations in the collagen drinks market |
| 8.3 Growth in distribution channels such as online sales and retail partnerships |
| 9 Singapore Collagen Drinks Market - Opportunity Assessment |
| 9.1 Singapore Collagen Drinks Market Opportunity Assessment, By Flavor, 2022 & 2032F |
| 9.2 Singapore Collagen Drinks Market Opportunity Assessment, By Form, 2022 & 2032F |
| 9.3 Singapore Collagen Drinks Market Opportunity Assessment, By Source, 2022 & 2032F |
| 9.4 Singapore Collagen Drinks Market Opportunity Assessment, By Type, 2022 & 2032F |
| 9.5 Singapore Collagen Drinks Market Opportunity Assessment, By Application, 2022 & 2032F |
| 10 Singapore Collagen Drinks Market - Competitive Landscape |
| 10.1 Singapore Collagen Drinks Market Revenue Share, By Companies, 2025 |
| 10.2 Singapore Collagen Drinks Market Competitive Benchmarking, By Operating and Technical Parameters |
| 11 Company Profiles |
| 12 Recommendations |
| 13 Disclaimer |
Export potential assessment - trade Analytics for 2030
Export potential enables firms to identify high-growth global markets with greater confidence by combining advanced trade intelligence with a structured quantitative methodology. The framework analyzes emerging demand trends and country-level import patterns while integrating macroeconomic and trade datasets such as GDP and population forecasts, bilateral import–export flows, tariff structures, elasticity differentials between developed and developing economies, geographic distance, and import demand projections. Using weighted trade values from 2020–2024 as the base period to project country-to-country export potential for 2030, these inputs are operationalized through calculated drivers such as gravity model parameters, tariff impact factors, and projected GDP per-capita growth. Through an analysis of hidden potentials, demand hotspots, and market conditions that are most favorable to success, this method enables firms to focus on target countries, maximize returns, and global expansion with data, backed by accuracy.
By factoring in the projected importer demand gap that is currently unmet and could be potential opportunity, it identifies the potential for the Exporter (Country) among 190 countries, against the general trade analysis, which identifies the biggest importer or exporter.
To discover high-growth global markets and optimize your business strategy:
Click Here
Pricing
- Single User License$ 1,995
- Department License$ 2,400
- Site License$ 3,120
- Global License$ 3,795

Search
Thought Leadership and Analyst Meet


Our Clients
Latest Reports
- France Thermally Conductive Filler Dispersants Market (2026-2032) | Challenges, Restraints, Value, Share, Size, segmentation, Analysis, Trends, Investment Opportunities, Outlook, Pricing, Demand, Forecast, Revenue, Companies, Growth, Drivers, Strategy, Insights, Competition
- Egypt Thermally Conductive Filler Dispersants Market (2026-2032) | Competition, Forecast, Strategy, Value, Insights, Outlook, Investment Opportunities, Pricing, Demand, Share, segmentation, Drivers, Size, Companies, Restraints, Growth, Trends, Revenue, Challenges, Analysis
- Czech Republic Thermally Conductive Filler Dispersants Market (2026-2032) | Forecast, Pricing, Analysis, Drivers, Insights, Size, Demand, Growth, Challenges, segmentation, Competition, Outlook, Trends, Investment Opportunities, Companies, Strategy, Revenue, Share, Value, Restraints
- Colombia Thermally Conductive Filler Dispersants Market (2026-2032) | segmentation, Trends, Share, Drivers, Strategy, Companies, Demand, Insights, Size, Challenges, Value, Competition, Analysis, Growth, Revenue, Restraints, Forecast, Pricing, Outlook, Investment Opportunities
- China Thermally Conductive Filler Dispersants Market (2026-2032) | Restraints, Investment Opportunities, Pricing, Companies, Share, Size, Challenges, Trends, Outlook, Value, Analysis, Competition, Revenue, Drivers, Forecast, Demand, Insights, Growth, Strategy, segmentation
- Chile Thermally Conductive Filler Dispersants Market (2026-2032) | Investment Opportunities, Trends, Value, Restraints, Share, Companies, Forecast, segmentation, Pricing, Challenges, Demand, Size, Analysis, Drivers, Outlook, Growth, Competition, Strategy, Revenue, Insights
- Cambodia Thermally Conductive Filler Dispersants Market (2026-2032) | Analysis, Share, Outlook, Strategy, Pricing, Demand, Size, Growth, segmentation, Insights, Revenue, Forecast, Challenges, Competition, Companies, Investment Opportunities, Trends, Restraints, Value, Drivers
- Brazil Thermally Conductive Filler Dispersants Market (2026-2032) | Restraints, Forecast, Competition, Size, Revenue, Value, Investment Opportunities, Trends, Insights, Outlook, Growth, Analysis, Drivers, segmentation, Pricing, Challenges, Strategy, Share, Companies, Demand
- Bangladesh Thermally Conductive Filler Dispersants Market (2026-2032) | Restraints, Trends, Analysis, Competition, Insights, Forecast, Value, Investment Opportunities, Pricing, Share, Demand, Outlook, Revenue, segmentation, Companies, Drivers, Growth, Size, Challenges, Strategy
- Bahrain Thermally Conductive Filler Dispersants Market (2026-2032) | Trends, Outlook, Pricing, Demand, Value, Competition, Forecast, Growth, segmentation, Revenue, Companies, Analysis, Insights, Size, Drivers, Challenges, Strategy, Investment Opportunities, Share, Restraints
Industry Events and Analyst Meet

HIMTEX 2026

India Refining Summit 2026

India EV Show 2026

EV tech India Expo 2026

Auto Tech Asia 2026
Whitepaper
- Middle East & Africa Commercial Security Market Click here to view more.
- Middle East & Africa Fire Safety Systems & Equipment Market Click here to view more.
- GCC Drone Market Click here to view more.
- Middle East Lighting Fixture Market Click here to view more.
- GCC Physical & Perimeter Security Market Click here to view more.
6WResearch In News
- Doha a strategic location for EV manufacturing hub: IPA Qatar
- Demand for luxury TVs surging in the GCC, says Samsung
- Empowering Growth: The Thriving Journey of Bangladesh’s Cable Industry
- Demand for luxury TVs surging in the GCC, says Samsung
- Video call with a traditional healer? Once unthinkable, it’s now common in South Africa
- Intelligent Buildings To Smooth GCC’s Path To Net Zero