Singapore Phthalic anhydride Market (2026-2032) Outlook | Trends, Revenue, Size, Share, Growth, Companies, Forecast, Analysis, Value & Industry
Market Forecast By Process Type (O-Xylene Catalytic Oxidation, Napthalene Catalytic Oxidation), By Applications (Plasticizer, Polyester Resin, Alkyd Resin, Polyester Polyols, Dyes, Medicine, Insecticides, Others), By End-users (Automotive & Transportation, Building & Construction, Paints & Coatings, Marine, Electrical & Electronics, Plastics, Agriculture, Others) And Competitive Landscape
| Product Code: ETC088606 | Publication Date: Jun 2021 | Updated Date: Mar 2026 | Product Type: Report | |
| Publisher: 6Wresearch | Author: Ravi Bhandari | No. of Pages: 70 | No. of Figures: 35 | No. of Tables: 5 |
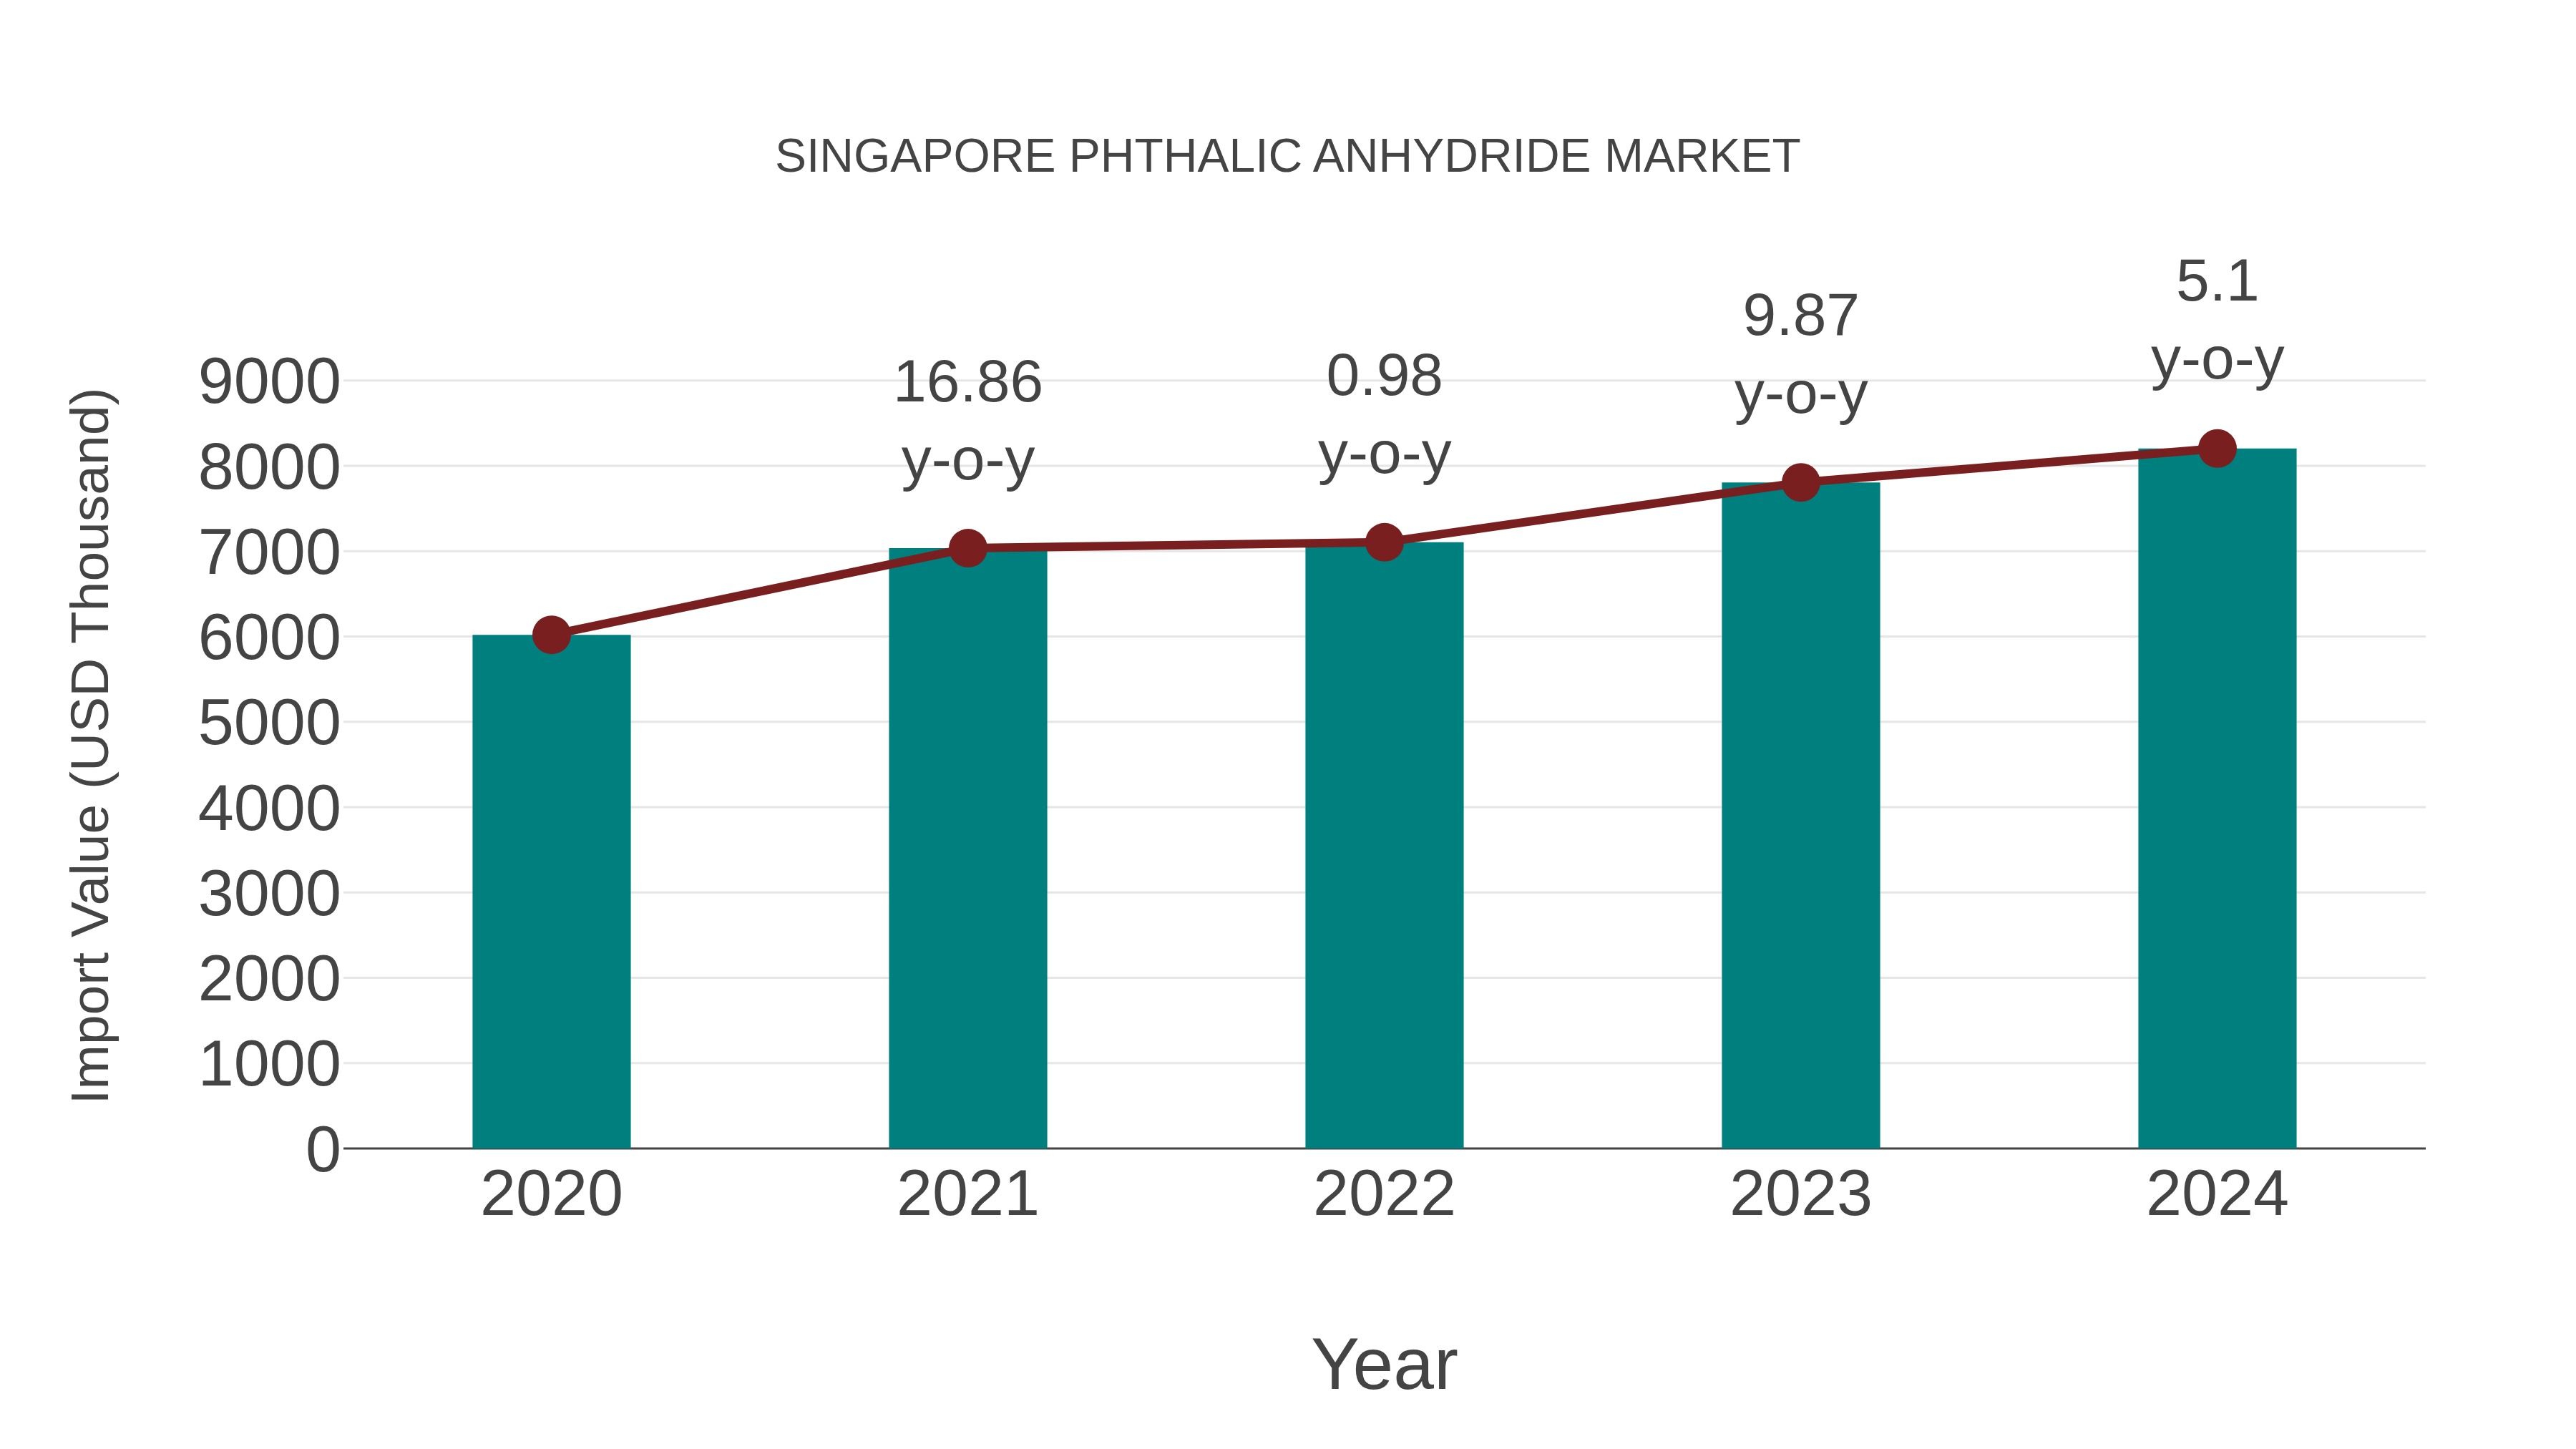
Singapore Phthalic Anhydride Market: Import Trend Analysis
In 2024, Singapore`s import of phthalic anhydride showed a steady increase, driven by growing demand from various industries. The trend reflected a consistent reliance on imported phthalic anhydride to meet domestic market needs.
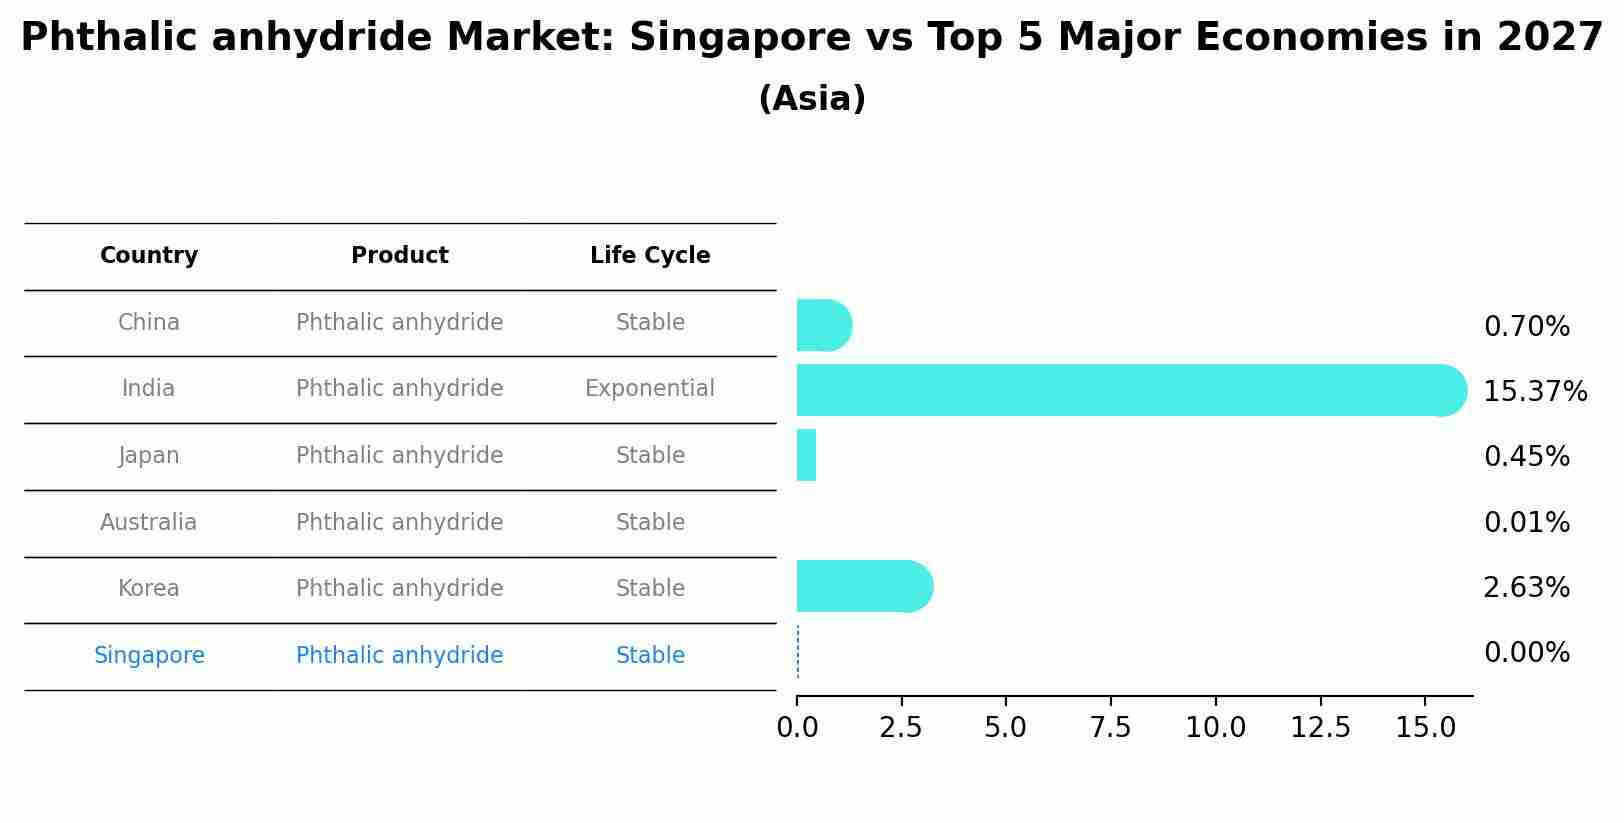
Phthalic anhydride Market: Singapore vs Top 5 Major Economies in 2027 (Asia)
The Phthalic anhydride market in Singapore is projected to grow at a stable growth rate of 0.00% by 2027, highlighting the country's increasing focus on advanced technologies within the Asia region, where China holds the dominant position, followed closely by India, Japan, Australia and South Korea, shaping overall regional demand.
Singapore Phthalic Anhydride Market Synopsis
The Singapore phthalic anhydride market is closely linked to the chemical and plastics industries. Phthalic anhydride is a key component in the production of phthalate plasticizers used in various plastic applications. The market may experience moderate growth, driven by the construction and automotive sectors. However, increasing environmental concerns and regulatory restrictions on phthalates may impact market dynamics, pushing manufacturers toward alternative plasticizers.
Drivers of the Market
The Singapore Phthalic Anhydride market is closely tied to the chemicals and plastics industries. Phthalic anhydride is a key ingredient in the production of plasticizers, which are essential in plastics manufacturing. The construction and automotive sectors are significant consumers of plasticizers, contributing to the demand for phthalic anhydride. Singapore strategic location and well-developed infrastructure make it an attractive hub for chemical manufacturing and trade, further boosting the market`s potential.
Challenges of the Market
The Singapore phthalic anhydride market encounters challenges associated with the chemical`s use in the production of plastics and resins. Environmental concerns related to phthalates, which are derived from phthalic anhydride and used as plasticizers, have led to increased regulations and consumer awareness. Meeting regulatory requirements while maintaining product quality is a delicate balance. Additionally, fluctuations in the price of feedstock chemicals and global demand for plastics can impact market dynamics and profitability. Innovation in sustainable alternatives to phthalates is another challenge for the market, as sustainability becomes a more prominent factor in material choices.
COVID-19 Impact on the Market
The Singapore phthalic anhydride market has shown resilience despite the challenges posed by the COVID-19 pandemic. Phthalic anhydride is a key chemical used in various industries, including plastics and coatings. During the pandemic, disruptions in the global supply chain led to fluctuations in prices and availability. However, as the world recovers, Singapore strategic position as a trade hub is expected to benefit the market, with steady demand from sectors like automotive and construction. The market outlook remains positive, with opportunities for growth through innovation and sustainable practices.
Key Players in the Market
The Singapore Phthalic Anhydride market is showing steady growth due to its applications in the chemical and plastics industries. Key players in this sector include BASF SE, ExxonMobil, and Nan Ya Plastics Corporation.
Key Highlights of the Report:
- Singapore Phthalic anhydride Market Outlook
- Market Size of Singapore Phthalic anhydride Market, 2025
- Forecast of Singapore Phthalic anhydride Market, 2032
- Historical Data and Forecast of Singapore Phthalic anhydride Revenues & Volume for the Period 2022-2032F
- Singapore Phthalic anhydride Market Trend Evolution
- Singapore Phthalic anhydride Market Drivers and Challenges
- Singapore Phthalic anhydride Price Trends
- Singapore Phthalic anhydride Porter's Five Forces
- Singapore Phthalic anhydride Industry Life Cycle
- Historical Data and Forecast of Singapore Phthalic anhydride Market Revenues & Volume By Process Type for the Period 2022-2032F
- Historical Data and Forecast of Singapore Phthalic anhydride Market Revenues & Volume By O-Xylene Catalytic Oxidation for the Period 2022-2032F
- Historical Data and Forecast of Singapore Phthalic anhydride Market Revenues & Volume By Napthalene Catalytic Oxidation for the Period 2022-2032F
- Historical Data and Forecast of Singapore Phthalic anhydride Market Revenues & Volume By Applications for the Period 2022-2032F
- Historical Data and Forecast of Singapore Phthalic anhydride Market Revenues & Volume By Plasticizer for the Period 2022-2032F
- Historical Data and Forecast of Singapore Phthalic anhydride Market Revenues & Volume By Polyester Resin for the Period 2022-2032F
- Historical Data and Forecast of Singapore Phthalic anhydride Market Revenues & Volume By Alkyd Resin for the Period 2022-2032F
- Historical Data and Forecast of Singapore Phthalic anhydride Market Revenues & Volume By Polyester Polyols for the Period 2022-2032F
- Historical Data and Forecast of Singapore Phthalic anhydride Market Revenues & Volume By Dyes for the Period 2022-2032F
- Historical Data and Forecast of Singapore Phthalic anhydride Market Revenues & Volume By Medicine for the Period 2022-2032F
- Historical Data and Forecast of Singapore Phthalic anhydride Market Revenues & Volume By Insecticides for the Period 2022-2032F
- Historical Data and Forecast of Singapore Phthalic anhydride Market Revenues & Volume By Others for the Period 2022-2032F
- Historical Data and Forecast of Singapore Phthalic anhydride Market Revenues & Volume By End-users for the Period 2022-2032F
- Historical Data and Forecast of Singapore Phthalic anhydride Market Revenues & Volume By Automotive & Transportation for the Period 2022-2032F
- Historical Data and Forecast of Singapore Phthalic anhydride Market Revenues & Volume By Building & Construction for the Period 2022-2032F
- Historical Data and Forecast of Singapore Phthalic anhydride Market Revenues & Volume By Paints & Coatings for the Period 2022-2032F
- Historical Data and Forecast of Singapore Phthalic anhydride Market Revenues & Volume By Marine for the Period 2022-2032F
- Historical Data and Forecast of Singapore Phthalic anhydride Market Revenues & Volume By Electrical & Electronics for the Period 2022-2032F
- Historical Data and Forecast of Singapore Phthalic anhydride Market Revenues & Volume By Plastics for the Period 2022-2032F
- Historical Data and Forecast of Singapore Phthalic anhydride Market Revenues & Volume By Agriculture for the Period 2022-2032F
- Historical Data and Forecast of Singapore Phthalic anhydride Market Revenues & Volume By Others for the Period 2022-2032F
- Singapore Phthalic anhydride Import Export Trade Statistics
- Market Opportunity Assessment By Process Type
- Market Opportunity Assessment By Applications
- Market Opportunity Assessment By End-users
- Singapore Phthalic anhydride Top Companies Market Share
- Singapore Phthalic anhydride Competitive Benchmarking By Technical and Operational Parameters
- Singapore Phthalic anhydride Company Profiles
- Singapore Phthalic anhydride Key Strategic Recommendations
Singapore Phthalic anhydride Market (2026-2032): FAQs
6Wresearch actively monitors the Singapore Phthalic anhydride Market and publishes its comprehensive annual report, highlighting emerging trends, growth drivers, revenue analysis, and forecast outlook. Our insights help businesses to make data-backed strategic decisions with ongoing market dynamics. Our analysts track relevent industries related to the Singapore Phthalic anhydride Market, allowing our clients with actionable intelligence and reliable forecasts tailored to emerging regional needs.
Yes, we provide customisation as per your requirements. To learn more, feel free to contact us on sales@6wresearch.com
1 Executive Summary |
2 Introduction |
2.1 Key Highlights of the Report |
2.2 Report Description |
2.3 Market Scope & Segmentation |
2.4 Research Methodology |
2.5 Assumptions |
3 Singapore Phthalic anhydride Market Overview |
3.1 Singapore Country Macro Economic Indicators |
3.2 Singapore Phthalic anhydride Market Revenues & Volume, 2022 & 2032F |
3.3 Singapore Phthalic anhydride Market - Industry Life Cycle |
3.4 Singapore Phthalic anhydride Market - Porter's Five Forces |
3.5 Singapore Phthalic anhydride Market Revenues & Volume Share, By Process Type, 2022 & 2032F |
3.6 Singapore Phthalic anhydride Market Revenues & Volume Share, By Applications, 2022 & 2032F |
3.7 Singapore Phthalic anhydride Market Revenues & Volume Share, By End-users, 2022 & 2032F |
4 Singapore Phthalic anhydride Market Dynamics |
4.1 Impact Analysis |
4.2 Market Drivers |
4.3 Market Restraints |
5 Singapore Phthalic anhydride Market Trends |
6 Singapore Phthalic anhydride Market, By Types |
6.1 Singapore Phthalic anhydride Market, By Process Type |
6.1.1 Overview and Analysis |
6.1.2 Singapore Phthalic anhydride Market Revenues & Volume, By Process Type, 2022-2032F |
6.1.3 Singapore Phthalic anhydride Market Revenues & Volume, By O-Xylene Catalytic Oxidation, 2022-2032F |
6.1.4 Singapore Phthalic anhydride Market Revenues & Volume, By Napthalene Catalytic Oxidation, 2022-2032F |
6.2 Singapore Phthalic anhydride Market, By Applications |
6.2.1 Overview and Analysis |
6.2.2 Singapore Phthalic anhydride Market Revenues & Volume, By Plasticizer, 2022-2032F |
6.2.3 Singapore Phthalic anhydride Market Revenues & Volume, By Polyester Resin, 2022-2032F |
6.2.4 Singapore Phthalic anhydride Market Revenues & Volume, By Alkyd Resin, 2022-2032F |
6.2.5 Singapore Phthalic anhydride Market Revenues & Volume, By Polyester Polyols, 2022-2032F |
6.2.6 Singapore Phthalic anhydride Market Revenues & Volume, By Dyes, 2022-2032F |
6.2.7 Singapore Phthalic anhydride Market Revenues & Volume, By Medicine, 2022-2032F |
6.2.8 Singapore Phthalic anhydride Market Revenues & Volume, By Others, 2022-2032F |
6.2.9 Singapore Phthalic anhydride Market Revenues & Volume, By Others, 2022-2032F |
6.3 Singapore Phthalic anhydride Market, By End-users |
6.3.1 Overview and Analysis |
6.3.2 Singapore Phthalic anhydride Market Revenues & Volume, By Automotive & Transportation, 2022-2032F |
6.3.3 Singapore Phthalic anhydride Market Revenues & Volume, By Building & Construction, 2022-2032F |
6.3.4 Singapore Phthalic anhydride Market Revenues & Volume, By Paints & Coatings, 2022-2032F |
6.3.5 Singapore Phthalic anhydride Market Revenues & Volume, By Marine, 2022-2032F |
6.3.6 Singapore Phthalic anhydride Market Revenues & Volume, By Electrical & Electronics, 2022-2032F |
6.3.7 Singapore Phthalic anhydride Market Revenues & Volume, By Plastics, 2022-2032F |
6.3.8 Singapore Phthalic anhydride Market Revenues & Volume, By Others, 2022-2032F |
6.3.9 Singapore Phthalic anhydride Market Revenues & Volume, By Others, 2022-2032F |
7 Singapore Phthalic anhydride Market Import-Export Trade Statistics |
7.1 Singapore Phthalic anhydride Market Export to Major Countries |
7.2 Singapore Phthalic anhydride Market Imports from Major Countries |
8 Singapore Phthalic anhydride Market Key Performance Indicators |
9 Singapore Phthalic anhydride Market - Opportunity Assessment |
9.1 Singapore Phthalic anhydride Market Opportunity Assessment, By Process Type, 2022 & 2032F |
9.2 Singapore Phthalic anhydride Market Opportunity Assessment, By Applications, 2022 & 2032F |
9.3 Singapore Phthalic anhydride Market Opportunity Assessment, By End-users, 2022 & 2032F |
10 Singapore Phthalic anhydride Market - Competitive Landscape |
10.1 Singapore Phthalic anhydride Market Revenue Share, By Companies, 2025 |
10.2 Singapore Phthalic anhydride Market Competitive Benchmarking, By Operating and Technical Parameters |
11 Company Profiles |
12 Recommendations |
13 Disclaimer |
Global Go To Market Strategy - 2030
Export potential enables firms to identify high-growth global markets with greater confidence by combining advanced trade intelligence with a structured quantitative methodology. The framework analyzes emerging demand trends and country-level import patterns while integrating macroeconomic and trade datasets such as GDP and population forecasts, bilateral import–export flows, tariff structures, elasticity differentials between developed and developing economies, geographic distance, and import demand projections. Using weighted trade values from 2020–2024 as the base period to project country-to-country export potential for 2030, these inputs are operationalized through calculated drivers such as gravity model parameters, tariff impact factors, and projected GDP per-capita growth. Through an analysis of hidden potentials, demand hotspots, and market conditions that are most favorable to success, this method enables firms to focus on target countries, maximize returns, and global expansion with data, backed by accuracy.
By factoring in the projected importer demand gap that is currently unmet and could be potential opportunity, it identifies the potential for the Exporter (Country) among 190 countries, against the general trade analysis, which identifies the biggest importer or exporter.
To discover high-growth global markets and optimize your business strategy:
Click Here
Pricing
- Single User License$ 1,995
- Department License$ 2,400
- Site License$ 3,120
- Global License$ 3,795

Leadership Perspectives from Industry Events
Search
Thought Leadership and Analyst Meet


Our Clients
6WResearch In News
- India Air Conditioner Market Set for Strong Rebound in 2026 After Weather-Led Correction and GST-Driven Recovery: 6Wresearch
- ADAS in India: How Automatic Emergency Braking, Blind Spot Detection & Driver Monitoring are Transforming Road Safety
- Doha a strategic location for EV manufacturing hub: IPA Qatar
- Demand for luxury TVs surging in the GCC, says Samsung
- Empowering Growth: The Thriving Journey of Bangladesh’s Cable Industry
- Demand for luxury TVs surging in the GCC, says Samsung
Latest Reports
- Poland Fire Protection Systems Market (2026-2032)
- Cape Verde Portable Hand-Thrown Extinguisher Market (2026-2032)
- Canada Portable Hand-Thrown Extinguisher Market (2026-2032)
- Cameroon Portable Hand-Thrown Extinguisher Market (2026-2032)
- Burundi Portable Hand-Thrown Extinguisher Market (2026-2032)
- Burkina Faso Portable Hand-Thrown Extinguisher Market (2026-2032)
- Bulgaria Portable Hand-Thrown Extinguisher Market (2026-2032)
- Brunei Portable Hand-Thrown Extinguisher Market (2026-2032)
- Botswana Portable Hand-Thrown Extinguisher Market (2026-2032)
- Bosnia and Herzegovina Portable Hand-Thrown Extinguisher Market (2026-2032)
Industry Events and Analyst Meet

HIMTEX 2026

India Refining Summit 2026

India EV Show 2026

EV tech India Expo 2026

Auto Tech Asia 2026
Whitepaper
- Middle East & Africa Commercial Security Market Click here to view more.
- Middle East & Africa Fire Safety Systems & Equipment Market Click here to view more.
- GCC Drone Market Click here to view more.
- Middle East Lighting Fixture Market Click here to view more.
- GCC Physical & Perimeter Security Market Click here to view more.